RETRIEVAL OF COASTAL OCEAN CURRENTS USING MCC TECHNIQUE ON
SATELLITE IMAGERY FOR SUPPLEMENTING ALTIMETER DERIVED
CURRENTS
Preeti Rajput, Ratheesh Ramakrishnan, A.S. Rajawat
Geo-Science and Application Group, Space Applications Centre (ISRO), Ahmedabad 380015, India ([email protected])
Keywords: Suspended Sediment Concentration, Maximum cross correlation, Oceansat-2, Ocean color monitor, OSCAR currents
Abstract: Maximum Cross Correlation (MCC) technique have been used to derive coastal currents from sequential OCM
derived suspended sediment concentration (SSC) maps and the MCC currents are integrated with the Ocean surface current analysis-Real time (OSCAR) ocean currents along the coastal regions of the Southern India. OSCAR currents are mainly depended on the oceanographic measurements from the satellite altimeter which have limitations in the coastal region and in representing the mesoscale properties dominating the coastal ocean. Sequential pair of atmospherically corrected and geo-referenced OCM image is used to derive SSC, along the southern coast of India. Maximum Cross-Correlation (MCC) method is applied on the sequential time lapsed images of OCM for matching the suspended sediment dispersion patterns. The MCC technique involves computing of cross-correlation coefficients and identifying correlation peaks. The spatial change of the sediment pattern occurs due to the advection by the currents and the extent of the change corresponds to the speed and direction of the current. From the first image, template window is selected, which is searched in the second image within large region defined as the search window. The movement of the SSC pattern is calculated based on the maximum cross correlation in successive images. Error statistics are calculated between the spatially coherent MCC vectors and OSCAR currents. Based on statistical analysis, an error threshold of 30 degree for current direction and 0.06m/sec for current speed was given to MCC currents and MCC currents beyond the error limit are rejected, while the MCC current within the error limit is merged with the OSCAR ocean currents. The merging of MCC currents has spatially enhanced the OSCAR currents. MCC method is significant in calculating the coastal currents and its mesoscale properties, which dominate the coastal surface flow field and can be used in supplementing the OSCAR ocean currents. Merging of both the currents, have effectively resulted in preparing contiguous maps of coastal ocean currents.
Introduction:
Under the present state of art remote sensing capabilities, synoptic observation of ocean current from satellite born data is from altimeter observations. Satellite altimeter observation forms the major component in the Ocean surface current analysis-Real time (OSCAR) ocean current, which is used by the scientific community in studying the ocean surface current patterns. Oceanographic measurements from the satellite altimeter are unable to yield the relatively small scale currents at the coast. Currents derived from nadir sampling altimeters has limited representations of the actual surface flow, since the along-track-only measurements of sea surface heights estimates only the cross-track component of the surface geostrophic velocity. The altimeter derived currents are also not valid along the coast due to the proximity of the land features. Thus, the satellite altimeters are unable to measure the velocity of geostrophic currents.
Multispectral satellite images are widely used to interpret ocean phenomenon and surface patterns. Satellite data are found to be reliable as its single scene covers a large portion enough to identify different features. From the sequential satellite data, suitable methods have been developed to obtain the surface velocity of the ocean. Feature selection and finding the change of position of the same feature in the sequential image is termed as feature tracking and is widely applied to derive advective velocity
from the satellite images. The selection and detection process involved in feature tracking method is considered to be highly subjective (Garcia and Robinson 1989). Surface velocities are obtained from inversion of heat equation applied to sequential infrared satellite data (Chen et al. 2008). Another method is the maximum cross-correlation (MCC) in which cross-cross-correlation between sequential images is used.
The present paper discuss the application of MCC technique applied on sequential suspended sediment concentration (SSC) maps obtained from Ocean Colour Monitor (OCM) onboard Oceansat-2, which is used to supplement OSCAR ocean currents along the coastal regions of the Southern Indian coastal region, where the study region is shown in figure 1.
Figure1: Study region-Karnataka Coast
Data and Methodology
Oceansat-2 OCM
Sequential pair of SSC images is derived from the Oceansat-2 OCM imagery. Ocean Colour Monitor (OCM) onboard Indian remote sensing satellite OCEANSAT-2, launched by Indian Space Research Organisation (ISRO), is designed to measure ocean colour by recording the spectral variation of water leaving radiance that can be related to concentration of phytoplankton pigments, suspended sediments, coloured dissolved organic matter, and aerosols. OCM collects data in eight spectral channels (412nm, 443nm, 490nm, 510nm, 555nm, 620nm, 740nm and 865nm) with spatial resolution of 360 m, every alternate day for the same region at local time around 12 noon with radiometric resolution of 12 bits. Each OCM scene covers 1420km by 1420km ground area.
Geometrical and atmospheric corrections have been applied to the satellite images. After correction, MCC method is applied to evaluate surface ocean currents in the data.
Atmospheric Correction
The total signal received by the satellite at the top of the atmosphere is highly dominated by atmospheric scattering and absorption processes and only very small percentage of this signal contributes to actual water leaving signal
reflectance. From the first six channels of OCM, corresponding to the visible spectrum water leaving radiance (Lw) is extracted after correcting for the
atmospheric constituents. The sensor observed radiance (Lt) can be partitioned into components corresponding to
distinct physical processes like Rayleigh scattering by the atmospheric gaseous constituents (Lr), scattering by the
aerosol particles (La) and the water leaving radiance (Lw).
Lr is computed from its spectral dependency, which leaves
La as the unknown to be determined to obtain Lw from Lt.
Lw at band 7 and band 8 in the near infra red (NIR) region
is assumed to be negligible enabling estimates of NIR La.
La at visible bands is obtained by extrapolating the NIR La
using aerosol model (Gordon, 1997).
Geometric correction
Geometric correction and co-registration is necessary for the implementation of pattern matching techniques with an error limit of one pixel. A translation shift in images reduces the matching accuracy. Using polynomial transformation, co-registration was done between two-succssesive images by wraping one image over the other. The transformation was defined by matching more than 25 pairs (as many as possible) of Ground Control Points(GCP) on the images, selected from identifiable coastline features surrounding the study area. Then resampling was performed using cubic convolution interpolation techniques to keep the spatial distortion at a minimum. The pair of the images could be co-registered within an error limit of one pixel (here 360 meters).
Suspended Sediment Concentration
Even though a large number of sediment algorithms have been proposed to quantify total suspended matter (Pradhan, 2005; Erico et al., 2007), universal sediment algorithms are unavailable (Acker et al, 2005). In the current study, from the water leaving radiances, SSC values were derived from algorithm proposed by Tassan (1994)
log(S) = 1.83 + 1.26log(Xs)
where Rrs(λ) is the remote-sensing reflectance in respective
wavelengths.
MCC Method:
Where x and y are two random variable from a set(population) of two-dimension, var is the variance and cov is the covariance between two variable. The value of ρ defined is between -1 to +1.
The surface current velocities are calculated by identifying the maximum cross-correlation between two sequential time lagged images of SSC. The first image is divided into continuous sub areas called template window (f). A window of mxn size as large as the auto-correlation length scale is taken, so that this smaller window can meaningfully capture features within it. Another subset (g) of size MxN has been taken from the second image. The size of this subset must be sufficiently large such that the features we are tracking from f window (template) must be identifiable in second window (g). This smaller window (f) is shifted one pixel at a time, and a correlation is computed.
The pixel values of the template window are
f
(
p
,
q
)
and the corresponding pixels in the second window are)
,
(
p
q
g
at no lag andg
(
p
+
x
,
q
+
y
)
for a lag (x, y). The cross-correlation function between template and search window is given by{
}
var is the variance and cov is the covariance. Cross-correlation matrix is calculated with moving template
within the search window. The displacement (
max
x ,
y
max) at the maximum value of the cross-correlation determines the speed c and direction θ which are given by sequential images andx
maxandy
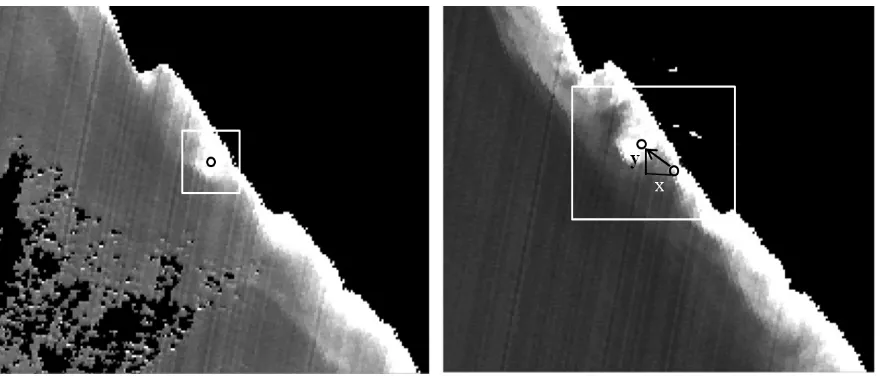
maxis the displacement coordinate values for MCC. Figure 2 illustrates the MCC technique to derive surface current.OSCAR currents
Ocean general circulation along the southern Indian coastal regions are analysed from OSCAR (Ocean surface current analysis-Real time) currents downloaded from www.oscar.noaa.gov.in. Ocean current data analysis- OSCAR is a modeled product derived using quasi-linear and steady flow momentum equations. Model constitutes Geostrophic, Ekman and Stommel shear dynamics, and surface buoyancy gradient (Bonjean and Lagerloef 2002). OSCAR current is derived using three parameters viz. SSH, Surface vector and SST estimates from various satellites and in situ measurements. SSH derived from TOPEX/POSEIDON, Jason-1 and 2, ERS1-2 and Envisat altimeters. Wind velocity is derived from QScat. Weakly SST is obtained using Reynolds and Smith version 2 dataset. Spatial resolution available is 1/3° and 1°, latitudinal spatial coverage of data is from 80° N to 80° S. Temporal resolution is approximately 5 days.
Merging MCC current with OSCAR currents
From the assumption of locally coherent current direction, MCC derived surface current were filtered out using the OSCAR current. The technique compares the direction of surface current with its nearest neighbor OSCAR current and calculates the error. Similarly, errors are obtained for the current speed. By using calculated error statistic, a common error threshold has been set for the removal of surface current vectors, which are not coherent with the OSCAR current vectors. This filtering technique will eliminate bad vectors and leaves better vectors to be merged with the OSCAR currents.
Result and Discussion:
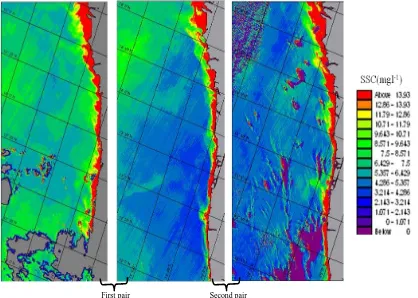
The Suspended sediment concentration in the Karnataka coast derived from OCM imagery is shown in figure 3. High value of SSC 30-10 mgl-1 is observed entirely along the inner shelf of the coastal region, for about 25 km from the coast. Coastal sequestering of sediments is reported by Chauhan et al, (2012) for the study region. The deeper region is observed to have lower SSC values < 10 mgl-1. The dispersion of sediments is observed to be along the coast, where offshore transport is negligible. The sediments forms unique pattern along the periphery of the inner shelf and are observed to get dispersed along the shore (figure 2). Template window is defined subsuming these unique patterns. The template window is searched for in the second image within a larger region defined as the search window whose size depends on the maximum current speed expected. Individual template windows with unique sediment patterns are manually identified and MCC is calculated. While identifying the templates, care has been
given to distribute the templates spatially. In this study, we have taken template window of size 15X15 and search window of size 60x60. A large shift in sediment patterns among the sequential images gives a stronger velocity whereas smaller shift gives weaker ones. A threshold MCC of 0.65 has been suggested by Domingues et. al. (2000) and in the present study if MCC is below this threshold, the currents derived are not taken into consideration. Scattered MCC vectors are then spatially interpolated. After taking the template and the search window, we have found that most of the derived currents satisfy this threshold value of cross-correlation.
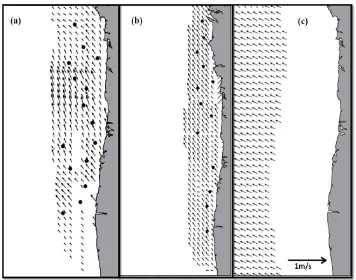
MCC derived surface current vectors using SSC image of 20th and 22nd December 2011 is shown in figure 4(a). The inset boxes represent the area where templates have been taken. Surface currents are derived within the 60 km of the coast, where the current speed reaches a maximum of 0.05 ms-1 and current direction varies from 185° to 360°. Surface current vectors derived using SSC images of 22nd and 24th December 2011 is shown in figure 4(b). For the second pair also the surface current are derived within the 60 km of the coast. Maximum speed of current 0.11 ms-1 is derived from the second pair and the current direction varies from 285° to 305°. OSCAR surface current are obtained with a temporal frequency of 5 days and hence OSCAR current for 20-25th December-2010 has been used for comparative studies (figure 4c). These current are available from a distanceof about 70 km away from the coast. Along the study region OSCAR current speed has a maximum of 0.14 ms-1 and current direction varies from 290.90° to 295.71° with respect to the north.
Figure 3 SSC maps derived from Oceansat-2 OCM imagery at the Karnataka coast for the dates (a) 20-11-2011 (b) 22-11-2011
Figure 4 MCC derived surface current along the Karnataka coast using the SSC images of (a) 20th and 22nd December 2011. (b) 22nd and 24th December 2011 and (c) OSCAR currents at the Karnataka coast during the period 20th to 25th December 2011 MCC current derived from the first pair is observed to
underestimates the current speed but shows coherency in current direction. Table 1 shows RMSE calculated for current speed and direction. An error of 0.062ms-1 in current speed and 33° in current direction is obtained for current from the first pair of images. While for the current from the second pair, an error of 0.038ms-1 and 26° is found. It is observed that the MCC derived current has the same direction as that of the OSCAR current while the current speed is slightly less by a value of 0.02 ms-1.
While merging MCC derived current vectors to the OSCAR currents, an error threshold of 30° in current direction and 0.06 ms-1 in current speed is given. Similarly, error statistic has been generated for the MCC derived vectors from the pair of SSC images on 22nd and 24th December 2011. MCC vectors derived from the first and second pair are filtered and merged with the OSCAR current and are shown in figure 6a and 6b respectively.
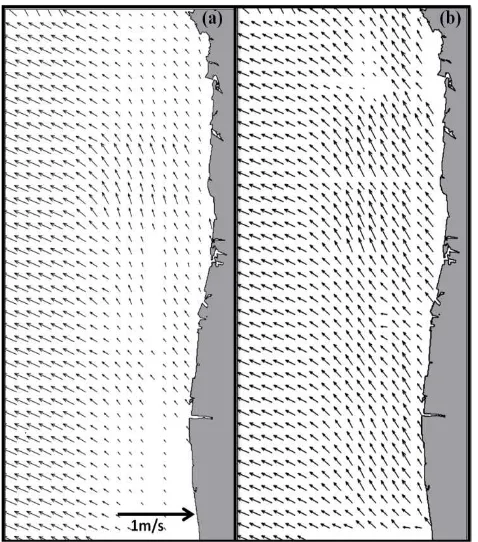
The merged currents, as can be seen from figure 6, have enhanced the spatial coverage of the individual current vector maps. MCC currents depend on the sediment dispersion and offshore dispersion of sediment is almost negligible in the study region, which prohibits the calculation of vectors through MCC methods beyond 60-70 km offshore from the coast. On the other hand, OSCAR currents are not valid towards the coastal region due to inherent errors in the microwave altimeter and scatterometer data acquisition near the coast. The merging of the MCC vectors and OSCAR vectors have made a possibility to study seamless coastal ocean currents and flow pattern along the coastal region.
MCC derived surface current for the pair of 22nd and 24th December shows more correlation with OSCAR current. The spatial coherency of ocean currents is found to be better for the merged current of the MCC from the pair of 22nd and 24th December.
Table1: Error statistic calculated for current speed and direction
Period of calculation RMSE-magnitude RMSE-direction
20-12-2011 to 22-12-2011 0.062ms-1 33°
Figure 6: OSCAR currents merged with MCC vectors derived from the pair of SSC images on (a) 20th and 22nd December-2011 (b) 22nd and 24th December 2011.
Conclusion:
The study shows a practical approach towards the use of sequential OCM data for deriving current vectors through MCC method. The merging of MCC derived current vectors has been done using error threshold methods. The MCC derived vectors retains the mesoscale property of the ocean surface currents along the coastal region. The result shows the feasibility of combining MCC derived current vectors and OSCAR currents to obtain a seamless current pattern along the coastal region. The inherent drawbacks of MCC derived vectors such as dispersion and deposition of sediments and vertical dispersions by the currents are not addressed in the present study, which can be removed by applying suitable techniques of pattern matching thus improving the retrieval of surface currents vectors using MCC methods.
Acknowledgment:
The authors express their sincere gratitude to Dr. A. S. Kiran Kumar, Director SAC and Dr. P.K. Pal, Deputy Director, EPSA and Dr. Manab Chakraborty, Group Director, GSAG for their guidance and valuable suggestions during the course of this study. Thanks to the two reviewers Dr. Prakash Chauhan and Dr. B.S. Munjal for their constructive comments which have greatly improved the presentation of this work.
References:
Bonjean, F., and Lagerloef, G. S. E., 2002, Diagnostic model and analysis of the surface currents in the tropical Pacific Ocean. Journal of Physical Oceanography 32: 2938-2954
Chen, W., Richard, P. M., and Colin, Y. S., Estimation of surface velocity estimation of surface from infrared image using the global optimal solution to an inverse model. 2008, IEEE pp. I-383 to I-386
Domingues, C. M., Glauber, A. G., Ghisolfi, D.R. and Garcia, E. A. C., (2000) Remote-sensing Sens. Environ. 7 (2000) Elsevier Science Inc., 73:218–226
Dransfeld, S., Larcinol, G. and Traon, P.L., 2006, The Potential of the Maximum Cross-Correlation Technique to Estimate surface currents from thermal AVHRR global area coverage data. IEEE Transaction of Geosciences and Remote Sensing, 3, pp. 508-511.
Emery, W. J., Gade, M., Romeiser, R., Coastal ocean surface current retrievals from sequences of Terra SAR-X images 2006 IEEE
Evans, A.N., 2000, Glacier Surface Motion Computation from Digital Image Sequences. IEEE Transaction of Geosciences and Remote Sensing, 38, pp. 1064-1072.
Evans, A.N., 2006, Cloud Motion Analysis Using Multichannel Correlation-Relaxation Labeling. IEEE Geosciences and Remote Sensing Letters, 3, pp. 392-396.
Garcia, C.A.E. and Robinson, I.S., 1989, Sea surface velocities in shallow seas extracted from sequential Coastal Zone Colour Scanner Satellite Data. Journal of Geophysical Research, 94(C9), pp. 12681-12691.
Gao, J. and Lythe, M. .B., 1998, Effectiveness of the MCC method in detecting oceanic circulation patterns at a local scale from sequential AVHRR images; Photogrammetric Engineering & Remote Sensing 64 4 301–308
Gordon H., R. and Clark, D. K., 1981, Clear water radiances for atmospheric correction of Coastal Zone Color Scanne imagery, Appl. Optics, 204175–4180
Kelly K., A., 1989, An inverse model for near-surface velocity from infrared images; J. Physical Oceanography, 19550-565
La Violette P., E., 1984, The advection of submesoscale thermal features in the Alboran sea gyro; J. Physical Oceanography, 14, 550-565
Prasad, J. S., Rajawat, A. S., Pradahan, Y., Chauhan, O. S., and Nayak, S. R., 2002, Retrieval of sea surface velocities using sequential Ocean Colour Monitor (OCM) data. Proceedings of Indian Academy of Sciences, 111, pp. 189-195.
Tassan S., 1994, Local algorithm using SeaWiFS data for retrieval of phytoplankton pigment, suspended sediments and yellow substance in coastal waters;Appl. Opt.12 2369– 2378
Vastano A., C., and Borders S., E., 1984 Sea surface motion over an anticyclonic eddy on the Oyashio Front; Remote Sensing Environment 16 87-90