*Corresponding author:
STRAIN GAUGE SENSOR OF MASS MEASUREMENT USING
A BRASS CANTILEVER
Hena Dian Ayu1, Akhmad Jufriadi1, Kurriawan Budi Pranata1, Endarko2, Melania Suweni Muntini2
1Department of Physics Education, Science, and Technology of Faculty, University of Kanjuruhan Malang
Jl. Soedanco Supriadi No.48, East Java, Indonesia
2Department of Physics, Mathematic and Natural Science of Faculty, Sepuluh Nopember Institute ofTechnology
Jl. Arief Rahman Hakim, Surabaya 60111
ABSTRACT
A study of mass measurement using strain gauge 120 Ω which was placed in the corner of the brass cantilever has been done. This study essentially utilizes deflection phenomena on the surface. This phenomenon occurs due to the mass placed on one end of the brass cantilever. The Mass was calibrated with standard mass gauge using OHAUS PA214 PioneerTM analytical balance. It was done a variation of mass-reduction and addition at the end of the brass cantilever with a multiple of 0.1 gram over a span interval of 1.1-7.5 grams. It obtained hysteresis curve plot for the changing strain gauge resistance (ΔR) versus mass variations on which the system has the maximum load range (7,1-7,5 gram). Moreover, The test of the system for the mass variations in the output voltage of the IC AD521JD differential amplifier was approximated as a quadratic function which was expressed in the system characteristic equation m = 2,4×V2 - 0,8533×V + 1,1449, with m (gram) and V (Volt). The characteristic equation was used in the ADC microcontroller conversion. The measured mass value was displayed on 2 × 16 LCDs in grams.
Keywords: brass cantilever,strain gauge, whetstone.
Introduction
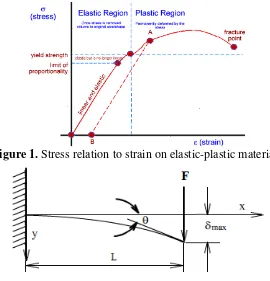
The design of measurement systems for engineering physics is commonly based on the application of theoretical models. One of measurement systems is a mass measurement system utilizing strain phenomenon in materials caused by mass increases1. In general, the material structure represents a linear relation between stress and strain at low-stress levels as shown in Figure 1.
In Fig. 1, a linear elastic condition of a material represented by a straight line on the graph of the stress-strain relationship. The critical point between the elastic region and
the plastic region is called by the limit of proportionality.
Based on the linearity relationship between the stress-strain shown in Fig. 1, it obtained a research concept that utilizes the elasticity of a material due to deflection change caused by the addition of an external force perpendicular to the surface plane end2 as shown in Figure 2. The physical interpretation of Fig. 2 still does not fully represent the idea of this study due to the unclearness in converting the physical mass measurement analysis to the electric measurement. Therefore, it needs further analysis both experimentally and theoretically.
Figure 1. Stress relation to strain on elastic-plastic material1
Figure 2. Deflection of a material when subjected to a force at its surface end3. Fig. 2 shows that the greater compressive
force (F) causes the deflection value running into the maximum value (δmax) which
indicates the limit of proportionality of the material as shown in Figure 1. The relationship of the compressive force values (F ) is very closely related to the physical
quantity of Stress (σ). As stress arises from a force acting on a cantilever area, so it can be formulated in Eq. 1 3:
𝜎 =
𝐹𝐴(1)
where σ isstress (N/m2), F is the compressive force (N) on its one surface end, and A is an area of material (m2).
Based on Eq. 1 and Fig. 1, it is clear that stress has a relationship with the strain. it also can be clarified its relationship as follows3:
𝜀 =
𝜎𝐸(2)
Eq. 2 indicates that the strain ε has a
physical relationship with the compression force F (N), and is inversely proportional to the young modulus material, E (N/m2). Using
Eq. 2, a design concept of mass measurement system utilizing the modulus of elasticity of a material can be built by indicating the deflection change due to the addition of a perpendicular outer force. The addition of this external force can be assumed as gravity. Hence, the mass variable can be determined.
For the changing strain values are small in scale, so the strain measurement can be determined by using a micro scale measuring device. To detect the changing strain value automatically, a sensor or strain gauge transducer can be set up. A strain gauge sensor has a changing resistance value requiring a series of Wheatstone bridges to produce a voltage output4. Using transducer, instrumentation design of mass measurement can be set up completely with a display. Methods
Aluminum Brass Magnesium Zinc
Tensile strength, psix100 47 55 34 41
Yield strength, psix100(0,2 pct offset
28 30 23 -
Shear strength, psi x 100 28 37 20 31
Fatigue strength, psi x 1000 20 25 14 7
Elongation, pct in 2 in. 3.5 15 3 10
Hardness (brinell) 80 91 63 82
Specific gravity 2.71 8.3 1.8 6.6
Weight, lb/cu.in 0.098 0.305 0.066 0.24
Melting point (liquid), oF 1100 1670 1105 728
Thermal conductivity, CGS 0.23 0.21 0.16 0.27
Thermal expansion, in./in./oF x 10-6 12.1 12 15 15.2 Electrical conductivity, pct of
copper standard
27 20 10 27
Modulus of elasticity, psi x 106 10.3 15 6.5 -
Inpact strength (charpy), ft/lb 3 40 2 43
Figure 3. Mechanical properties of various materials5
On Figure 3 shows that a brass has the highest modulus young value (15 × 106 psi). It
means that a brass is difficult to encounter elongation or reduction6.
In this sense, a brass cantilever was created due to its good strength properties once the excessive load was given. In order that the brass cantilever system is able to measure mass in the gram order, the system should have a relatively small length (L), thickness (t), and width (b) in dimension. The brass cantilever system was designed as shown in Fig. 4.
Figure 4. Physical variables on the brass cantilever
Dimensions and sizes are presented in Table 1 as follows:
Table 1 Sizes of the brass cantilever
Dimension Size
Length (L) 1 cm
Width (b) 0,4 cm
Thickness (t) 6 m
Based on table 1, the used small thickness of the brass cantilever system is estimated
increasing its elasticity property resulting in the increased sensitivity response of strain gauge sensors as a load which is placed at th cantilever ends. Since it was supported by a high young modulus value, it is estimated that the created brass cantilever system is also not easily broken once variations of load are involved.
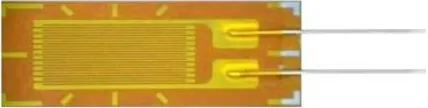
Meanwhile, the used strain gauge sensor in this study was an uniaxial strain gauge with a resistance of 120-ohm KFG series whose a gauge constant factor (Ks) of 2. It also has a good ability in detecting a maximum strain (ε) up to 50.000 microstrain7. Physically, the uniaxial strain gauge transducer is shown in Fig. 5 below:
Figure 5. The uniaxial strain gauge transducer
The design of strain gauge sensor system which is mounted on the brass cantilever system is shown in Fig. 6.
In Fig. 6, Once the compressive weight (F) increases, the brass cantilever system undergoes a deflection accompanied by a strain gauge sensor displacement which results in the changing of its resistance value.
Figure 7. Wheatstone bridges series coupled with strain gauge sensors8.
The changing resistance value in the strain gauge is converted to an analog voltage signal through a Wheatstone bridges series as shown in Fig. 7 with a value of Vin = 2 Volts and the
values R1, R2, R3, R4 = R. It can be expressed
in Eq. 3.
𝑉
𝑜 𝑤ℎ𝑠𝑡𝑜𝑛𝑒= 𝑉
𝑖𝑛[
2𝑅+∆𝑅𝑅−
2𝑅𝑅]
(3)If ΔR is very small, Eq. 3 can be simplified as follows:
𝑉
𝑜 𝑤ℎ𝑠𝑡𝑜𝑛𝑒=
14 ∆𝑅𝑅𝑉
𝑖𝑛 (4)The output voltage Vowheatstone in Fig.7 is
connected to the signal conditioning circuit with the gain of 1000 times using the AD521JD IC9.
Result and Discussion
This study was conducted measuring the output voltage of quarter Wheatstone bridge type and strain gauge mounted on a brass cantilever whose length 3 cm, width 1 cm, and
thickness 6 μm. The first treatment was given a load sample of 0.1 gram and calibrated using OHAUS PioneerTM type PA214.The adding treatment of each 0.1 grams mass in succession is to obtain an estimated brass cantilever deflection for which its used load range is still linear to the changing resistance of the strain gauge. The changes of strain
gauge sensor resistance according to ΔR can
be expressed using Eq. 4. Based on Eq. 4, the Vin variable is 2 volts, R is 120 Ω, and
Vwheatstone value was measured using a digital
multimeter. Using these measured variables and Eq. 4, the changing resistance of strain gauge sensor ΔR can be calculated. Based on the experimental result, it obtained the output voltage of ± 0.040 mV on the measurement of Wheatstone bridge output bands with the mass of 0.1 grams, while the change in resistance
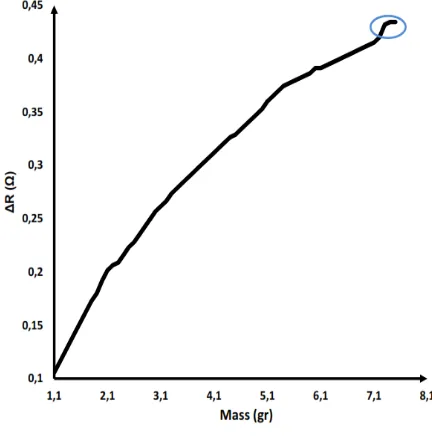
strain gauge ΔR of 0.10 Ω. The graph of the
changing resistance of strain gauge ΔR to the
addition of 0.1 grams multiplier mass with a mass addition span of between 1.1 grams to 7.5 grams is presented in Figure 8.
Figure 8. The graph of the changing
resistance of strain gauge ΔR to the addition
of 0,1 grams multiplier mass
In Figure 8, the blue circle shows the saturation graph pattern which indicates the maximum deflection occurred on the brass cantilever system in the range of 7.3-7.5 grams. As a result, the strain gauge sensor system placed as in Fig. 6 was also reached a maximum deflection but its resistance was constant.Hence, it can be concluded that the brass cantilevered system of mass measurements has a maximum load of 7.3 grams. If the mass measurement is above 7.3 grams, the brass cantilever system will attain a maximum deflection indicated on the saturation curve as shown in Fig. 8.
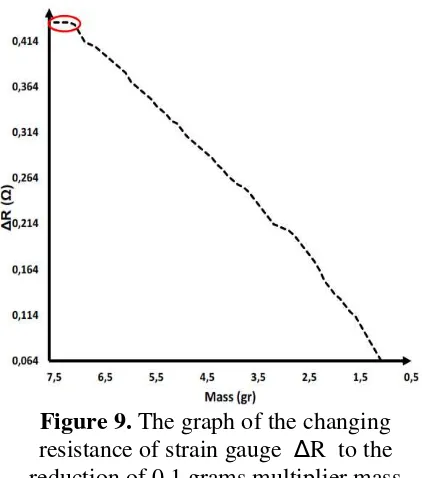
Fig. 9, ie mass reduction graph to the changing resistance of strain gauge sensor.
Figure 9. The graph of the changing resistance of strain gauge ΔR to the reduction of 0,1 grams multiplier mass
In Figure 9 the red circle indicates saturation pattern occurred from the beginning of the mass reduction. It is estimated that there is no a resistance change. For further, it does not contribute towards a deflection change on the brass cantilever at the mass range 7,5-7.1 gram.
Using Fig. 8 and 9, The masses on the x-axis are cut along the mass range of 6.6-7.5 grams to sketch a hysteresis curve during addition reduction of mass. It can be seen in Figure 10.
Gambar 10. Hysteresis pattern regarding the changing resistance of strain gauge ΔR to
the addition-reduction of mass
Hysteresis curve in Figure 10 characterizes its deviation pattern is somewhat big. As the reduction of mass is applied, the brass cantilever does not return to its initial shape but a maximum deflection on the mass reduction range of 7.5-7.1 grams exists. This process is signed by the red rectangular in Fig. 10. Moreover, it also indicates the resistance of strain gauge sensor does not change which is figured by the flat curve.
In practice, the changing resistance of the strain gauge sensor was very small during the direct observation. It assigned an effect toward the smallness of the output voltage signal from the Wheatstone bridge circuit. Therefore, this study conducted the strengthening of the voltage signal to support in observation of digital conversion system. The amplifier of this signal used a differential amplifier circuit with a gain of 1000 times using AD521JD IC.
The measured output voltage of the differential amplifier at a mass of 0.1 grams was ± 0.04 V. The graph of the retrieval data describing the relationship between the output voltage, V, to the mass addition, m, in the multiples of 0.1 grams with a span of 1-7.5 grams is shown in Fig. 11.
Figure 11. The Relationship between the output voltage of the differential amplifier
and the addition of 0,1 gram mass.
gram of mass range. The initial 1 gram mass is the mass of the container as a loading place. From the measurement result, it was obtained the characteristic formulation of the changing mass addition towards the voltage change, ie. y = 0.2014x + 0.4064, where y is the differential amplifier output voltage (Volt) and x is the free variable of mass addition (gram).
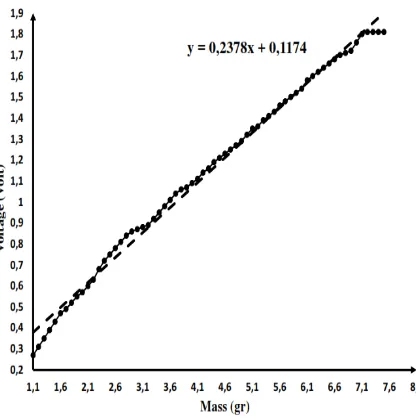
In addition, the characteristic graph of the strain gauge sensor obtained from the analog output voltage reading from the differential amplifier to 0.1 gram mass reduction from 1 g to 7.5 gram is shown in Fig. 12.
Figure 12. The Relationship between the output voltage of the differential amplifier
and the reduction of 0,1 gram mass. A linear curve of the relation between the output voltage and the mass reduction is obtained as shown in Fig. 12. Afterward, It is determined its characteristic equation by fitting the graphs. It obtained the characteristic equation y = 0.2378 x + 0.1174, where y the differential amplifier of the output voltage and x the free variable of the mass reduction.
Figure 13 shows a part of hysteresis curves which describes the deviation between the mass addition and the mass reduction curves. It can be seen that the deviation is somewhat large and the meeting point between the final mass reduction measurement and the initial mass addition was not reached. It is mainly caused that the strain gauge sensor detected
the elasticity of thebrass cantilever which did not move back into the initial position of measurement. This can be seen from the differential amplifier of the output voltage value from 0.44 Volt at the initial measurement of the mass addition to 0.27 Volt at the final measurement of the mass reduction. Hence, it has a difference value of 0.17 Volt.
Figure 13. The comparative curve of the relationship between the output voltage of the differential amplifier AD521JD IC and the addition-reduction of mass in 0.1 gram
mass multiples.
Figure 13 shows a part of hysteresis curves which describes the deviation between the mass addition and the mass reduction curves. It can be seen that the deviation is somewhat large and the meeting point between the final mass reduction measurement and the initial mass addition was not reached. It is mainly caused that the strain gauge sensor detected the elasticity of thebrass cantilever which did not move back into the initial position of measurement. This can be seen from the differential amplifier of the output voltage value from 0.44 Volt at the initial measurement of the mass addition to 0.27 Volt at the final measurement of the mass reduction. Hence, it has a difference value of 0.17 Volt.
measurement tool using digital display. For this reason, it requires the ADC conversion equation. This equation is determined by fitting the result graphics as shown in Figure 14.
Figure 14. The fitting graph using linear function approach to obtain the ADC
conversion equation.
In Fig. 14 shows that once the linear function was fit on the graph, the relative error + 0,1V indicates the significant big error. But the result is different when a quadrate function approach was applied as sketched in Fig. 15
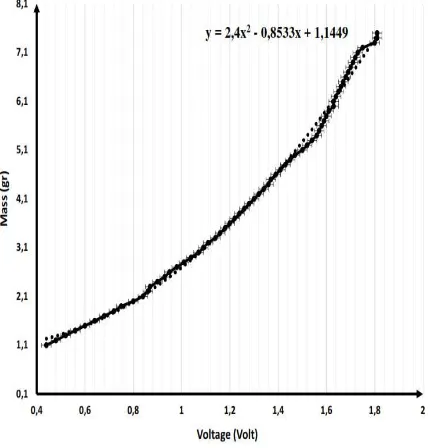
Figure 15. The fitting graph using the quadrate function approach to obtain The
ADC conversion equation.
In Figure 15 visualizes the measurement curve which coincides the curve as the quadrate function approach was applied. The relative error using this approach is much better than using the linear approach, that is + 0.02 V.
Based on the fitting graphic in Fig. 15, it obtained the appropriate ADC conversion equation using the quadratic equation approach. The characteristic equation was m = 2,4 × V2 - 0,8533 × V + 1,1449, with m (gr), V in (Volt). Furthermore, this characteristic equation is run into the microcontroller programming algorithm using CodeVision AVR software. The portable design of the overall mass measurement system in the gram order, which is completed with the 5 mm acrylic casing and the display LCD 2x16, is shown in Figure 16.
Figure 16. The portable design of mass measurement system using the brass cantilever (0,1 × 0,004 × (6 × 10-6) m3). In digital calibration, the analog voltage was converted to digital with a 10 bit ADC resolution that was already integrated into the microcontroller. In electronics, The mechanism of analog to digital voltage converter uses a successive approximation which states one LSB (least significant bit) can be calculated by the following equation10.
mV V
V
LSB Maxn Min 4,89
2 0 5 2
1 1 101
Where:
VMax = the maximum input voltage (5 volts)
Vmin = the minimum input voltage (0 volts)
The 4.89 mV voltage is the conversion voltage whose accuracy ± 4.89 mV. In this study, the 0.1 gram mass addition with a span of 1-7.5 grams was completely done. It obtained the output voltage on the digital conversion showed a minimum voltage 0.44 volts and a maximum voltage 1.81 volts. In addition, As the output voltage of the differential amplifier 1,81 Volt was inserted in the characteristic equation m = 2,4×V2 - 0,8533×V + 1,1449, it obtained the 7,37 grams measured mass on the LCD
Conclusion
The design of mass measurement systems was successfully built by utilizing the 120-ohm uniaxial strain gauge KFG series sensor and the AD521JD IC signal amplifier with the gain 1000 times. It obtained sensitivity value of 0.1 gram and maximum measurement mass limit of 7.1 grams. The mass measurement results yielded the characteristic graph pattern approximated by the quadratic function m = 2,4 × V2 - 0,8533 × V + 1,1449. The minimum sensitivity and the measurement limits can perform maximum by adding the gain of the differential amplifier circuit system.
Acknowledgment
The strain gauge sensor was supported by Instrumentation Physics Laboratory, Mathematic and Natural Science of Faculty, Sepuluh Nopember Institute of Technology Surabaya. Bed, 2012 35th International Conference on Telecommunications and Signal Processing (TSP); IEE Conference Publications; 2012. Page: 484 – 488. 3. Beams, David M. Introduction to Strain
gauges, Chris Field and David M. Beams, Department of Electrical Engineering, University of Texas at Tyler, Texas; 2005.
4. Manojlović. J, Janković. P, Bridge Measuring Circuits In The Strain Gauge Sensor Configuration. Mechanical Engineering.2013;11(1):75-84.
5. Premier Die Casting Company. Typical Mechanical Properties. [internet]. 2017. [cited.2017 Apr 29]; Available from:
http://diecasting.com/resource-center/design-ideas/alloy-properties.php 6. Mechanichal Design. [Internet]. 2008.
[cited. 2017 Apr 25]; Available from: http://designmekanik.blogspot.co.id/201 1/04/modulus-youngmodulus-elastis-dan.html.
7. Omega Engineering, INC. New Horizons® in Strain Gages: Users Guide and Technical Reference. [Internet]. USA: OMEGADYNE;2008. [Update 2008; cited 2017 apr]. Available from: www.omega.com/literature/omegadyne/ omegadyneNH_sg.pdf
8. Kyowa. Electronic Instrument co., LTD.
“How Strain gage Work”, Sensor System
Solutions. Japan; 2006.
Url.http://www.kyowaei.co.jp/english/pr oduct/gages/pdf/howsgw.pdf.