Introduction
As a form of monetary sacrifice and the sig
-nal quality of a product, price has long been regarded as a key factor determining customer purchasing decisions (Zeithaml, 1988). This is especially true in products that are “low touch” or “no touch”. When the product quality is con
-stant across vendors, customers will focus on
the minimization of price (Dodds et al., 1991). In the context of online shopping, the effect of prices is even stronger as customers can easily compare prices from one store to another (Kim et al., 2011).
Effects of Perceived Trust and Perceived Price on Customers’
Intention to Buy in Online Store in Indonesia
Ricky Setiawan and Adrian Achyar*
Price and trust are important factors that influence customer purchasing decision in online shop
-ping. However, the synergy of these two factors in customer intention to buy still needs to get higher attention. This paper examines the relative influence of perceived trust and perceived price on cus
-tomers intention to buy, both for cus-tomers who have bought item from the store (repeat cus-tomers) and who have not (potential customers), and examines whether a difference exists on the strength of influence of price and trust to purchase intention in those groups. Data are analyzed with the multiple-group analysis structural equation modeling, comparing the repeat customers and potential customers. The results of this paper reveal that there is no significant difference of effect between perceived trust and perceived price on intention to buy between potential and repeat customers and that perceived trust exerts a stronger effect than perceived price on purchase intentions for both potential and repeat customers of an online vendor. This paper also reveals that while perceived trust exerts a positive influence, perceived price exerts a negative influence on both perceived value and intention to buy.
Keywords: Perceived price, perceived trust, perceived value, intention to buy, e-commerce
Harga dan kepercayaan adalah faktor penting yang mempengaruhi keputusan pembelian dalam jaringan (online). Namun, sinergi antara kedua faktor tersebut dalam mempengaruhi keinginan un
-tuk membeli masih memerlukan riset lebih lanjut. Artikel ini menyelidiki pengaruh relatif antara persepsi kepercayaan yang dimiliki pelanggan (perceived trust) dan persepsi harga yang dianggap
wajar oleh pelanggan (perceived price) terhadap keinginan membeli, baik oleh pelanggan yang per
-nah membeli dari toko (pelanggan berulang) dan yang belum per-nah membeli (pelanggan potensial). Artikel ini juga menyelidiki adanya perbedaan kekuatan pengaruh antara persepsi harga dan persepsi kepercayaan terhadap keinginan untuk membeli di kedua kelompok pelanggan tersebut (pelanggan berulang dan pelanggan potensial). Data diolah dengan structural equation modelling dengan metode multiple-group analysis untuk membandingkan antara kedua kelompok pelanggan. Hasil pengola
-han data menemukan tidak ada perbedaan yang signifikan antara pelangganberulang dan pelanggan
potensial di kekuatan pengaruh harga dan kepercayaan terhadap keinginan untuk membeli. Selain
itu, persepsi kepercayaan ditemukan lebih kuat mempengaruhi keinginan untuk membeli daripada persepsi harga, baik untuk pelanggan berulang dan pelanggan potensial. Hal lain yang juga ditemu
-kan adalah walaupun kepercayaan berpengaruh positif terhadap keinginan untuk membeli, namun harga berpengaruh negatif terhadap nilai yang didapat pelanggan (perceived value) dan keinginan
untuk membeli dalam jaringan.
Kata kunci: harga, kepercayaan, nilai pelanggan, keinginan membeli, perniagaan elektronik
* Department of Management, Faculty of Econom
Beside price, trust is also considered as one of important factors in customers’ purchasing decision-making process. Customer will more likely to buy products from an online vendor if they trust the vendor. Therefore, an online ven
-dor can capture a larger market share if it is able to increase customer trust to them (Hoffman et al., 1999, Pavlou et al., 2007 & Vintone, 2001 in Kim et al, 2011).
Although several studies have examined the importance of price and trust in online stores, the synergy effect of these two factors in cus
-tomer intention to buy still needs to get higher attention. For online vendors, deciding whether to compete based on price or on trust is a very important strategic issue. Based on the facts that the price is a determining factor on customer decision making and that customers can easily compare prices from one vendor to another, on
-line vendors may choose to develop price-ori
-ented strategy. On the other hand, based on the argument that trust is also a motivating factor in online shopping, trust-oriented strategy is also worth considering (Kim et al., 2011).
In between these two extremes, online ven
-dors could also try creating a balance of price levels and trust by giving different weights on both (Kim et al., 2011). To do this, they need to know the relative importance of price and trust in purchasing decisions. They also need to know whether there are differences in the strength of influence of trust and price on po
-tential customers and repeat customers.
The purposes of this study are twofold. First, it is trying to find the relative influence of per
-ceived trust and per-ceived price on customers intention to buy, for customers who have bought items from an online store (repeat customers) and who have not (potential customers). Sec
-ond, this study is trying to examine whether a difference exists on the strength of influence of price and trust to purchasing intention between repeat and potential customers.
Literature Review
Perceived Price
In the simplest form, prices can be defined as the nominal value charged to the customer to acquire products and to be benefited from
the ownership or use of products (Kotler and Armstrong, 1996). Beside accepted as face value, price is also used for comparative refer
-ence price, which amount depending on social class and background of the customer (Mus
-tafa, 2004, in Dodds et al., 1991).). This form of perceived price is defined as the subjective customers’ perception towards the objective price of the product (Jacoby and Olson, 1977, in Dodds et al., 1991).
In addition, price can also be a signal quality of a product (Zeithaml, 1988). But in the case of online book shopping, its function as qual
-ity signal is not important because books usu
-ally have relatively same quality across vendors (Reibstein, 2002). As a monetary sacrifice, ex
-pensive price will lower the customers acquisi
-tion utility.
Price may also create image and differentia
-tion (Nagle and Holden, 1995). Buyers typical
-ly have a range of specific price they can take. They will not want to buy a product if the price is above the range and will doubt the quality of the product when the price of the product lies below (Cooper, 1969, in Dodds et al., 1991).
This is also related to the effect of price on perceived value. The relationship between price and perceived value is curvilinear: the per
-ceived value will increase when price is above the lower limit and will reduce when price is above this range (Szybillo and Jacoby, 1974, in Dodds et al., 1991). In determining which strat
-egy is best and may be used, decision makers need to understand the overall situation and at the same time do the calculations as accurately as possible (Nagle and Holden, 1995).
Perceived Trust
Trust has long been conceptualized by vari
-ous studies in different ways, both theoretically and operationally, and yet there is no univer
-sally accepted definition of trust (Gefen et al., 2003). It is not only different, but some are also conflicting. This happens at least for two rea
-sons. First, it is because each discipline views trust from the viewpoint of their own perspec
Chervany, 2002).
Second, grammatically, trust has a vague meaning. Three major English dictionaries (Webster’s, Random House, and Oxford) on av
-erage give 17 definitions for the word “trust”; it is too much when compared to other words like “cooperation”, “confidence”, and “predictable”, each of which has a number of definitions of an average of 4.7 (McKnigh and Chervany, 2002).
Faced with the amount of its definition, Ge
-fen et al. (2003) summarized and defined trust as: (1) a set of specific beliefs that relate to in
-tegrity, virtue, and the ability of other parties, (2) a general belief that the other party can be trusted, often referred to as an intention to trust or “the will of the party to be vulnerable to an
-other party,” (3) affection, which is reflected in the confidence and sense of security to another party, or (4) a combination of the above ele
-ments.
Chiles and McMackin (1996) found that per
-ceived trust could reduce the cost of non-mon
-etary transactions, including the time and effort required by customers to choose the right seller. Perceived trust could also reduce the level of risk in online transactions (Jarvenpaa et al., 2000 & Kim et al., 2010).
Perceived Value
Perceived value is conceptualized as a form of cognitive evaluation of customer, which is based on two things, namely perceived benefit and perceived cost (Zeithaml, 1988). Perceived benefits are derived from the factors expected by the customer, such as prestige, reputation, and service performance (Holbrook and Corf
-man, 1985, in Kim et al., 2011). Perceived cost can be divided into two, in the form of mon
-etary cost (price paid by customers) and non-monetary cost such as time spent, mental stress or physical stress experienced before, during, or after the consumption of goods and services.
Potential Customers and Repeat Customers
Potential customers are defined as customers who already signed up but have never bought items on a particular website, while repeat cus
-tomers are defined as cus-tomers who already signed up and had bought items on the website. Compared to potential customers, repeat cus
-tomers typically have a higher degree of cer
-tainty to the vendor, which comes from their past experience in transactions with the vendor (Kim et al., 2010). According to prospect the
-ory (Kahneman and Tversky, 1979, in Kim et al., 2010), the high level of certainty in a trans
-action could create a greater value; or in other words, repeat customers usually get greater value than do potential customers.
On the other hand, potential customers face higher perceived uncertainty and the risk of transactions over the Internet than do repeat customers. Lambert (1972) found that custom
-ers prefer to buy from vendors who offer high prices when they face uncertainty in the trans
-action. Similarly, if they do not have informa
-tion about the quality of products, they prefer to buy products at high prices as a signal of quality (Lichtenstein et al., 1993, in Kim et al., 2010).
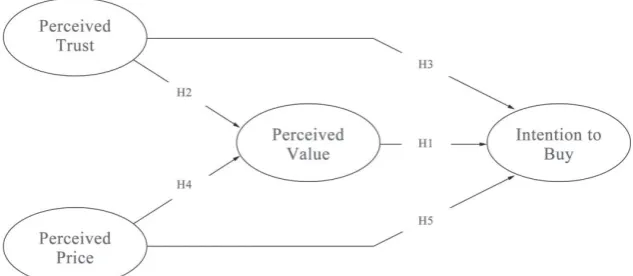
Hypotheses
Perceived value has long been known as one of the factors that influence customer pur
-chasing decisions. Zeithaml (1988) found that customers preferred a vendor whose products
were able to maximize the value they received. This is confirmed by Chang and Wildt (1994) and Dodds et al. (1991) and is most likely ap
-plicable to the context of online shopping.
H1: Perceived value (VAL) has a positive effect
on purchase intentions (INT) for both po
-tential customers and repeat customers In marketing, trust is defined as a psycho
-logical condition, in which one party is willing to accept vulnerability because he has posi
-tive expectations of other’s intentions (Singh and Surdeshmukh, 2000, in Kim et al., 2011) and willingness to rely on other parties (Gane
-san, 1994, in Kim et al., 2011). Perceived trust could potentially reduce non-monetary cost of a transaction, for example by reducing the ef
-fort and time taken by customers to choose an online vendor (Chiles and McMackin, 1996, in Kim et al., 2011). Because it can reduce non-monetary cost of a transaction, perceived trust to an online vendor could potentially increase acquisition utility and non-monetary aspects of transaction utility, which in turn will increase perceived value of customer.
H2: Perceived trust (TRU) in an online vendor
has a positive effect on perceived value (VAL) for both potential customers and re -peat customers
Based on research conducted by Chiu et al. (2010) as well as several other studies (Gefen et al., 2003; Grazioli and Jarvenpaa, 2000; Jar
-venpaa et al., 2000; Lu et al., 2010; Pavlou and Gefen, 2004), perceived trust also has a direct effect on purchase intention. In the context of online shopping, this relationship may also oc
-cur in both potential customers and repeat cus
-tomers.
H3: Perceived trust (TRU) in an online vendor
has a positive effect on purchase intention (INT) for both potential customers and re -peat customers
Price is defined as a monetary sacrifice to obtain a product. Price is also a signal of the quality of a product (Lichtenstein et al., 1993, Zeithaml, 1988, in Kim et al., 2011). However, in the context of books, in which products from different vendors have a relatively equal qual
-ity, price function as a signal of product quality can be ignored (Reibstein, 2002). As a mon
-etary sacrifice, increase in product prices in a vendor will lower acquisition utility if the same
products in another vendor have not changed. Perceived price also has a direct effect on the monetary aspects of the transaction utility. Due to its influence on acquisition and transaction utility, price perception has the possibility of a negative effect on the perceived value.
H4: Perceived price (PRI) has a negative effect
on perceived value (VAL) for both poten
-tial customers and repeat customers
Perceived price is also likely to have a direct effect on purchase intentions. High prices will lead to greater costs for the customer, which then reduces the willingness of customers to purchase the product (Dodds et al., 1991, Von Neumann and Morgenstern, 1953, in Kim et al., 2011). In the context of online shopping, this relationship may also occur for both potential customers and repeat customers.
H5: Perceived price (PRI) has a negative effect
on purchase intention (INT) for both poten
-tial customers and repeat customers
The effect of perceived trust in an online vendor (H3) is likely to have different levels on the purchase intention of potential custom
-ers and repeat custom-ers. In this study, potential customers are defined as people who already have accounts but have never bought a product on the site KutuKutuBuku.com. Potential cus
-tomers typically have less information than do repeat customers because they have never had experience in dealing with the vendor. There
-fore, they have a higher risk perception. Under these conditions, the ability to have control be
-comes more important in determining behavior (Koller, 1988, in Kim et al., 2011). Referring to the theory of planned behavior (Ajzen, 2002, in Kim et al., 2011), a person’s behavioral in
-tentions are influenced by their perceptions of behavioral control. Perception of behavioral control is the belief in the existence of internal control and external factors (Ajzen, 2002, in Kim et al., 2011). One of its forms is the belief of trust or trust belief, which is also a part of perceived trust (Kim et al. 2011).
Because trust belief affects customer percep
-tions about their ability to control the transac
online vendor, which resulted in lower level of risk.
H6: Perceived trust (TRU) in online vendors
has a stronger positive effect on purchase intentions (INT) of potential customers than that of repeat customers.
The effect of perceived price of an online vendor (H5) is likely to have different levels of influence on purchase intention among poten
-tial customers and repeat customers. Because of their experience, repeat customers tend to perceive a lower risk and a higher degree of certainty when dealing with online vendors (Kim et al., 2011). According to the prospect theory, the certainty of such transactions makes the customers more sensitive to monetary gain from the transaction. Given that the perception of price is a reflection of monetary benefit ac
-quired in a transaction (Dodds et al., 1991), the perception of price is likely to have a strong in
-fluence on the behavior of repeat customers. On the other hand, due to lack of transaction experience, potential customers are likely to have higher uncertainty. This uncertainty will reduce customer sensitivity to the monetary benefits of the transaction. Because of this, per
-ceived price is likely to have a weaker influence on the behavior of potential customers than to repeat customers.
H7: Perceptions of price (PRI) in online ven
-dors has a stronger positive effect on pur
-chase intentions (INT) of potential custom
-ers than that of repeat custom-ers.
The effect of perceived trust on purchase in
-tentions (H3) may be different from the effect of perceived price on purchase intention (H5). Customers will only buy things when the ben
-efit is greater than the cost. Therefore, prospect theory states that the customer would prefer to avoid risk (risk averse) and choose a small but definite advantage compared to big gains that cannot certainly obtained. In the context of on
-line shopping, customers are more focused on maximizing the level of certainty rather than maximizing monetary profits.
H8: Perceived trust (TRU) in an online vendor
has a stronger effect on purchase intention (INT) than on perceived price (PRI), for both potential customers and repeat cus
-tomers.
Methods
This study was conducted in Indonesia, where electronic trading is growing rapidly. Indonesia is one of the largest countries in the number of Internet users in Asia with a growth rate over 1,150% from 2000 to 2009 (Asia In
-ternet Usage and Population, 2011). However, there are several obstacles to this growth, one of which is a matter of trust. Trust becomes in
-creasingly important as Indonesia has a poor re
-cord in online fraud; the level of cyber crime in Indonesia is the highest in the world (Susanto, 2009).
This study takes an online bookstore as an object of study because books are the most widely purchased products online in Indone
-sia, followed by clothing, airline tickets, and electronic equipment (The Nielsen Company, 2010). Books are also the most frequently pur
-chased goods over the Internet worldwide. The quality of books (paper, printing quality, etc.) is usually constant across vendors, so this study can be more focused on several important vari
-ables, namely perceived trust and perceived price. KutuKutuBuku.com was chosen as the object of study primarily because KutuKutuBu
-ku.com does not have brick and mortar store, so that customers’ perceived trust and price purely come from its online store.
Measurements were adapted from Kim et. al. (2011) and translated to Indonesian, and data were collected using questionnaires. There are three main requirements to become respondents in this study. First, so that perceived trust can be measured, respondents should have visited Ku
-tukutubuku.com for at least once. Second, re
-spondents should have tried the kutukutubuku. com system. Third, so that perceived price can be measured, respondents should have seen the prices offered on KutuKutuBuku.com.
To obtain respondents who fit the criteria, potential respondents were asked to complete a five-step procedure so that all three conditions mentioned above were met. On the first step, re
-spondents were instructed to visit the site http:// www.rickysetiawan.com/skripsi. On the home page, an explanation of the research was dis
-er they had signed up at KutuKutuBuku.com. If they hadn’t, they would proceed to the second step, in which respondents were redirected to the KutuKutuBuku.com’s registration page to sign up. This second step was intended to group respondents into two distinct groups: potential customers and repeat customers.
After signing up, they would proceed to step three, in which they were asked to choose three titles with total value of not more than Rp.150,000. Later, three lucky respondents would receive books of their choice through a lottery. This would push the respondents to try the KutuKutuBuku.com system such as regis -Table 4. Test of Overall Model Fit for Structural Model
Model X2 RMSEA ECVI NFI NNFI CFI IFI RFI CN SRMR GFI AGFI Minimum Requirement >0.0 <0.8 - >0.9 >0.9 >0.9 >0.9 >0.9 >200 <0.05 >0.9 >0.9
Estimation Results 187.8 0.059 1.37 0.93 0.96 0.97 0.97 0.91 150.67 0.047 0.9 0.86 Table 1. Validity Analysis of Latent Variables for Measurement Model
Constructs Items t-values (>1.96) Factor Loading (>0.3)
INT INT1 12.94 0.79
INT2 13.85 0.83
INT3 14.23 0.84
INT4 14.39 0.85
VAL VAL1 15.35 0.88
VAL2 15.91 0.89
VAL3 13.7 0.81
VAL4 15.39 0.87
TRU TRU1 15.36 0.88
TRU2 15.48 0.88
TRU3 14.97 0.85
TRU4 15.32 0.87
TRU5 14.19 0.83
PRI PRI1 11.82 0.76
PRI2 14.48 0.88
PRI3 12.52 0.79
PRI4 8.39 0.58
Table 2. Good of Fit Indices for Measurement Model
Indices X2 RMSEA ECVI NFI NNFI CFI IFI RFI CN SRMR GFI AGFI Minimum Requirement >0.0 <0.8 - >0.9 >0.9 >0.9 >0.9 >0.9 >200 <0.05 >0.9 >0.9
INT 15.93 0.2 0.17 0.97 0.91 0.97 0.97 0.9 114.88 0.03 0.96 0.79 VAL 10.63 0.15 0.14 0.98 0.96 0.99 0.99 0.95 171.66 0.02 0.97 0.86 TRU 16.53 0.11 0.19 0.98 0.97 0.99 0.99 0.96 180.86 0.02 0.97 0.9
PRI 14.17 0.18 0.15 0.96 0.89 0.96 0.96 0.87 129.05 0.042 0.97 0.83
Table 3. Construct Reliability and Variance Extracted for Measurement Model
Constructs Items SLF Error Variance CR VE
INT
INT1 0.79 0.38
0.9 0.86
INT2 0.83 0.32
INT3 0.84 0.29
INT4 0.85 0.28
VAL
VAL1 0.88 0.23
0.92 0.9
VAL2 0.89 0.2
VAL3 0.81 0.34
VAL4 0.87 0.23
TRU
TRU1 0.88 0.23
0.9 0.86
TRU2 0.88 0.23
TRU3 0.85 0.25
TRU4 0.87 0.24
TRU5 0.83 0.31
PRI
PRI1 0.76 0.43
0.85 0.77
PRI2 0.88 0.23
PRI3 0.79 0.37
tration, navigation, and search.
In step four, they were asked to enter a book that had been chosen along with the price to a form. The limitation of books’ value (Rp.150,000) were made to ensure that respon
-dents saw the price of the products offered, so their perceived price can be measured. After meeting the three criteria above, respondents were asked to fill out online questionnaires in Google Docs (http://docs.google.com). In the questionnaire, respondents were given ques
-tions to measure four latent variables: per
-ceived trust, per-ceived price, per-ceived value and purchase intentions, using the Likert scale. The total number of questions was 17 ques
-tions. Questionnaires were randomly distrib
-uted using iMacros program via social media, including but not limited to Facebook, Twitter, and Kaskus.co.id.
Result and Discussion
Respondents’ Profile
Of the questionnaires distributed, 198 re
-spondents obtained. In terms of gender, 60% (119 respondents) of respondents were male, while the remaining 40% (79 respondents) were female. In terms of age, the majority of respon
-dents (59%) aged between 18-25 years, fol
-lowed by a second group of 26-34 years (30%). Other groups are <18 years (8%), 35-55 years (3%), and above 55 years (0%). Most (47%) had status as students, 65% live in Greater Jakarta, 26% had expenditures between Rp.900,000 - Rp.1.750,000, and 57% had diploma or were undergraduates.
Measurement Model
Validity analysis is focused on the calcula
-tion of the offending estimates, t-value, and the standardized loading factors. The test results is shown in table 1.
Twelve statistics are used to measure the goodness of fit of the model, as shown in
From table 2, it can be concluded that the latent variables INT, VAL, TRU, and the PRI have good fit.
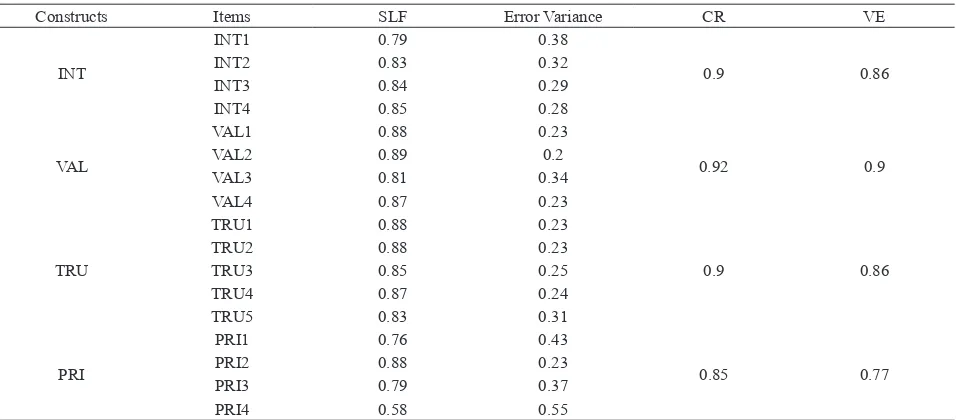
Reliability analysis of the measurement model was done by calculating the value of
Construct Reliability (CR) and Variance Ex
-tracted (VE). The results of reliability testing is shown in table 3.
In the table 2, it can be seen that all variables have CR value of ≥ 0.70 and VE ≥ 05 (Wijanto, 2008). Hence, re-specification to the model is not needed, and it can be concluded that the model is reliable.
Structural Model
After the confirmatory factor analysis (CFA) for measurement model had been done, latent scores were measured for each latent variable. Analysis for the structural model included sev -eral criteria:
1. Test of overall model fit
2. Analysis of causal relationship, which in
-clude
a. T-value and coefficient of structural equa -tion
b. Coefficient of determination (R2)
After testing the fitness of each variable, the fitness of entire model was tested. The is shown in table 4.
From the twelve statistics above, nine fulfill the requirement of good fit. Hence, it can be concluded that the model has good fit.
On the next step, coefficients or parameters that show the causal relationship between latent variables were evaluated, and the hypotheses were tested. The hypotheses are:
H1: Perceived value (VAL) has a positive effect
on purchase intentions (INT) for both po
-tential customers and repeat customers
H2: Perceived trust (TRU) in an online vendor
has a positive effect on perceived value (VAL) for both potential customers and re -peat customers
H3: Perceived trust (TRU) in an online vendor
has a positive effect on purchase intention (INT) for both potential customers and re -peat customers
H4: Perceived price (PRI) has a negative effect
on perceived value (VAL) for both poten
-tial customers and repeat customers
H5: Perceived price (PRI) has a negative effect
on purchase intention (INT) for both poten
-tial customers and repeat customers
The coefficients of determination are as fol
-lows:
INT = 0.33*VAL + 0.47*TRU - 0.12 *PRI (0.11) (0.11) (0.062) 3.03 4.40 -1.97 , Errorvar.= 0.32 , R² = 0.68 (0.063)
5.12
VAL = 0.75*TRU - 0.17*PRI, Errorvar.= 0.30 (0.069) (0.055) (0.048) 10.94 -3.16 6.29 , R² = 0.70
The results show that coefficient of deter
-mination of perceived trust (TRU) and per
-ceived price (PRI) to per-ceived value (VAL) is 0.70, which means that 70% of the variance on perceived value is explained by the variance on perceived trust (TRU) and perceived price (PRI).
On the other hand, coefficient of determina
-tion of perceived trust (TRU), perceived price (PRI), and perceived value (VAL) to intention to purchase (INT) is 0.68%, which means that 68% of the variance on intention to purchase is explained by the variance on PRI, VAL, and TRU.
SEM with Multi-sample Analysis
Hypotheses 6 and 7 tried to find differences between potential customers and repeat cus
-tomers. As stated previously, these hypotheses
are:
H6: Perceived trust (TRU) in online vendors
has a stronger positive effect on purchase intentions (INT) of potential customers than that of repeat customers.
H7: Perceptions of price (PRI) in online ven
-dors has a stronger positive effect on pur
-chase intentions (INT) of potential custom
-ers than that of repeat customer.
This multi sample hypotheses used the same research model with the model used to test the all previous hypotheses (H1—H5). The data were divided into two groups (Wijanto, 2008), namely the REPEAT and the POTENTIAL, which consisted of 85 repeat customers and 113 potential customers. The next step was to develop baseline models. Baseline model is a model-specific study for each group that has had a good fit. (Wijanto, 2008).
Goodness of Fit Tests for Baseline Models
Data for baseline model REPEAT was tested using 12 goodness of fit statistics. This test re
-sults is shown in table 6.
From the 12 statistics, the REPEAT model has eight statistics that fulfill the requirement of good fit and two statistics of marginal fit while the POTENTIAL model has six good fit statis
-tics and four marginal fit. Hence, it can be con
-cluded that both model have good fit.
After both the REPEAT and POTENTIAL groups proved to have a good fit, both models were estimated simultaneously. On this multi sample model, the value of parameters on both the measurement model and structural model were set to be equal. This estimation on the two baseline models with equal parameters is re
-ferred as the model A, and the error variance of the intention to buy (INT) and perceived value (VAL) were set to 0.77. The results is shown in table 7.
From the data above, we concluded that the model A has good fit. The number of Chi Square and degree of freedom of model A are 397.08 and 266.
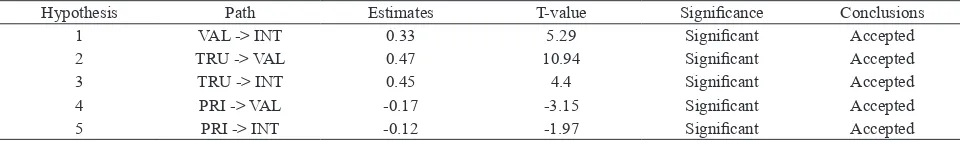
Table 5. Test of Hypotheses 1 to 5
Hypothesis Path Estimates T-value Significance Conclusions
1 VAL -> INT 0.33 5.29 Significant Accepted
2 TRU -> VAL 0.47 10.94 Significant Accepted
3 TRU -> INT 0.45 4.4 Significant Accepted
4 PRI -> VAL -0.17 -3.15 Significant Accepted
5 PRI -> INT -0.12 -1.97 Significant Accepted
Table 6. Goodness of Fit Indices for Baseline Models
Model X2 RMSEA ECVI NFI NNFI CFI IFI RFI CN SRMR GFI AGFI Minimum requirement >0.0 <0.8 >0.9 >0.9 >0.9 >0.9 >0.9 >200 <0.05 >0.9 >0.9
Estimation of Multisample Model with Different Parameter
The next step was to measure the estimation of multi sample model with the values of pa
-rameters are set to be different on each group. The parameters to be examined were estimated independently of each corresponding group. This estimation on two groups with different parameters is referred as the model B. The er
-ror variance of intention to buy (INT) and per
-ceived value (VAL) were set to 0.77. The re
-sults is shown in table 8.
From the data above, it can be concluded that the model has good fit. The number of Chi Square and degree of freedom of model B are 395,80 and 261.
Next, The difference between REPEAT and POTENTIAL groups were estimated by calcu
-lating the difference of the Chi Square and de
-gree of freedom between Model A and Model B:
1. Model A: Chi-square (X2) = 397.08, degree of freedom (df) = 266
2. Model B: X2 = 395.8, degree of freedom (df)
= 261
3. ΔX2 = X2 Model A - X2 Model B = 397.08 –
395.8 = 1.28
4. Δdf = df Model A – df Model B = 266 – 261 = 5
From the table of distribution of X2, with X2
= 1.28 and df = 5, the p-value we obtained was 0.9369. Because the p-value was greater than 0.05, it can be concluded that there is no struc
-tural difference between the REPEAT and PO
-TENTIAL groups. Hence, Model C, which is aimed at measuring the difference in the struc
-tural coefficient value of one latent variable to another latent variable, does not need to be done, and hypotheses 6 and 7 are rejected.
Effects of Perceived Trust and Perceived Price to Purchase Intention
To test the hypothesis 8, standardized solu
-tions were compared. As mentioned above, the hypothesis 8 is:
H8: Perceived trust (TRU) in an online vendor has a stronger effect on purchase intention (INT) than on perceived price (PRI), for both potential customers and repeat cus
-tomers.
From the results of data processing, the re
-sults is shown in table 10.
Table 10 shows that the value of standard
-ized solution is greater on path VAL -> INT compared to PRI -> INT. This indicates that the effect of perceived trust (TRU) to purchase intention (INT) is higher than the effect of perceived price (PRI) to intention to purchase (INT). Therefore, hypothesis 8 is accepted.
Conclusion
There are some findings that can be drawn from this study. First, the acceptance of hypoth
-esis 1 shows that perceived value has a positive effect on purchase intentions for both poten
-tial customers and repeat customers. The more customers feel that they get higher benefits and fewer costs when shopping online, the more their willingness to shop in the store. This is consistent with previous studies conducted by Chang & Wildt (1994) and Dodds et al. (1991).
Table 7. Global Goodness of Fit Indices for Model A
Model X2 RMSEA ECVI NFI NNFI CFI IFI RFI CN SRMR GFI
Minimum requirement >0.0 <0.8 - >0.9 >0.9 >0.9 >0.9 >0.9 >200 <0.05 >0.9
Model A 397.1 0.07 2.43 0.85 0.93 0.93 0.93 0.84 144.49 0.17 0.82
Table 8. Global Goodness of Fit Indices for Model B
Model X2 RMSEA ECVI NFI NNFI CFI IFI RFI CN SRMR GFI
Minimum requirement >0.0 <0.8 >0.9 >0.9 >0.9 >0.9 >0.9 >200 <0.05 >0.9 Model B 395.8 0.07 2.48 0.85 0.93 0.93 0.93 0.84 143.97 0.15 0.83
Table 9. Test of Hypotheses 6 and 7
Hypotheses Significance Conclusions
6 Significant Rejected
The reception of hypothesis 2 shows that the perceived trust to an online vendor has a positive effect on the perceived value on both potential customers and repeat customers. The greater the trust of customers to shop online, the greater the value they get from an online ven
-dor. This happens as perceived trust reduces the price of non-monetary transactions, for exam
-ple by reducing the effort and time customers take to choose an online vendor and reducing risks associated with online shopping (Chiles and McMackin, 1996, in Kim et al., 2011). This ‘trust’ is characterized by the willingness of cus
-tomers to open themselves, making themselves vulnerable to fraud and unpleasant acts from online vendors. Acceptance of the hypothesis is consistent with previous studies conducted by Jarvenpaa et al. (2000) and Kim et al. (2010).
The reception of hypothesis 3 shows that per
-ceived trust in an online vendor has a positive effect on purchase intentions for both potential customers and repeat customers. The higher the level of customer trust towards an online ven
-dor, the more purchase intention on that online store. This is consistent with previous studies conducted by Chiu et al. (2010).
The reception of hypothesis 4 indicates that the perceived price has a negative effect on the perceived value for both potential customers and repeat customers. The increase in product prices in an online vendor will reduce the utility acquisition if the price of the same products in another vendor has not changed because cus
-tomers are reluctant to shop at the vendor. This results are similar to the results of the study of Kim et al. (2011).
The reception of hypothesis 5 indicates that perceived price has a negative effect on pur
-chase intention for both potential customers and repeat customers. For the same product, high prices will lead to greater costs for the customer, which then reduces the willingness of customers to try to purchase or repurchase
the product. The results of this study are similar to the results of research conducted by Dodds et al. (1991) and Von Neumann and Morgenstern (1953).
The rejection of hypotheses 6 and 7 means that there is no significant structural difference between the effect of perceived trust and per
-ceived price to per-ceived value, and the effect of perceived trust, perceived price, and perceived value to intention to purchase among potential customers and repeat customers.
The reception of hypothesis 8 means that the effect of perceived trust is greater than the ef
-fect of perceived price on purchase intention. This may be caused by high rates of fraud and the status of Indonesia as the world’s highest cyber-crime rate (Sutanto, 2009), so that cus
-tomers prefer to buy from an online store that they trust rather than just providing low prices. This is consistent with Kim et al. (2011).
Managerial Implications
For the reason that both potential custom
-ers and repeat custom-ers have equally posi
-tive view of the high level of trust and nega-tive view to high prices, both price-oriented strategy and trust-oriented strategy are equally neces
-sary. In other words, online vendors can reach larger market share if they are able to sell at lower prices than do the competitors, and at the same time get a higher level of trust from the customers.
However, the result of hypothesis 8 suggests that the effect of trust is stronger than the effect of prices on the perceived value and willingness to try or repurchase the product. Thus, when re
-source is limited, online vendors should more focus on increasing customer trust rather than lowering the prices.
On the results of hypotheses 6 and 7, it was concluded that there is no difference between the attitudes of potential customers and repeat
Table 10. Standardized Solutions of Perceived Trust and Perceived Price to Purchase Intention
Paths Standardized Solution
TRU -> INT 0.47
PRI -> INT -0.12
Table 11. Test of Hypothesis 8
Hypothesis Conclusions
customers. On both group the effect of per
-ceived trust is stronger to intention to buy than is to the effect of perceived price. This suggests that the customer-based price discrimination
strategy should not be imposed; both groups of customers should be given same features and equal prices.
References
Asia Internet Usage and Population. (2011). Internet World Stats. Retrieved from http://www.inter
-networldstats.com/stats3.htm#asia on November 29, 2011
Chang, T. Z., and Wildt, A. R. (1994) Price, Product Information and Purchase Intention: an Empiri
-cal Study. Journal of the Academy of Marketing Science, 22, 1, 1994, 6–27.
Chiu, C. M., Huang, H. Y., and Hui, Y. C. (2010). Antecedents of Trust in Online Auctions. Electronic Commerce Research and Applications, 9, 2, 2010, 148–159.
Chiles, T. H., and McMackin, J. F. (1996). Integrating variable risk preferences, trust, and transaction cost economics. Academy of Management Review, 21, 1, 1996, 73–99.
Dodds, W. B., Monroe, K. B., and Grewal, D. (1991) The Effects of Price, Brand and Store Informa
-tion on Buyers’ Product Evalua-tions. Journal of Marketing Research, 28, 3, 1991, 307–319. Gefen, D., Karahanna, E., and Straub, D. W. (2003). Trust and TAM in Online Shopping: an Inte
-grated Model. MIS Quarterly, 27, 1, 2003, 51–90.
Jarvenpaa, S. L., Tractinsky, N., and Vitale, M. (2000). Customer Trust in an Internet Store. Informa
-tion Technology and Management, 1, 12, 2000, 45–71.
Kim, H. W., Yunjie Xu, and Sumeet Gupta. (2011). Which is More Important in Internet Shopping, Perceived Price or Trust? Electronic Commerce Research and Applications, doi:10.1016/j.eler
-ap.2011.06.003
Kim, C., Tao, W., Shin, N., and Kim, K.-S. (2010). An Empirical Study of Customers’ Perceptions of Security and Trust in E-Payment Systems. Electronic Commerce Research and Applications, 9, 1, 2010, 84–95.
Kotler, P. and Armstrong, G. (1996). Principles of Marketing 7th edition. Prentice Hall International, Inc.
McKnight, D. H., and Chervany, N. K. (2002). What Trust Means in E-Commerce Customer Re
-lationships: an Interdisciplinary Conceptual Typology. International Journal of Electronic Com
-merce, 6, 2, 2002, 35–59.
Nagle, T. and Holden, R. (1995). The Strategy and Tactics of Pricing: A Guide to Profitable Decision Making.
Reibstein, D. J. (2002). What Attracts Customers to Online Stores and What Keeps Them Coming Back? Journal of the Academy of Marketing Science, 30, 4, 2002, 465–473.
Susanto, A. (2009, 25 Maret). “Cyber Crime”, Indonesia Tertinggi di Dunia. Kompas.com Retrieved from http://nasional.kompas.com/read/2009/03/25/18505497/Cyber.Crime. Indonesia.Tertinggi. di.Dunia on November 28, 2011
Thaler, R. (1985). Mental Accounting and Customer Choice. Marketing Science, 4, 3, 1985, 199–214. The Nielsen Company. (2010). Nielsen Global Trends in Online Shopping Report. 14 Juli 2010. Re
-trieved from http://id.nielsen.com/news/News14072010.shtml on November 17, 2011.
Wijanto, S. (2008). Structural Equation Modelling dengan LISREL 8.8I. Yogyakarta: Graha Ilmu. Zeithaml, V. A. (1988). Customer Perceptions of Price, Quality, and Value: A Means-End Model and