ISSN: 2089-3272, DOI: 10.11591/ijeei.v6i1.351 45
Effect of Solar Radiation on Module Photovoltaics 100 Wp With
Variation of Module Slope Angle
Azriyenni Azhari Zakri*1, Iswadi Hasyim Rosma2, Dohardo P H Simanullang3 Department of Electronical Engineering, Faculty of Engineering, Universitas Riau, Indonesia
Article Info ABSTRACT
Article history:
Received Jan 9, 2018 Revised Jan 23, 2018 Accepted Feb 14, 2018
Solar photovoltaic generation system is a very promising type of renewable energy, particularly when it is implemented in the tropical country like Indonesia where it receives a huge amount of sunshine. Solar photovoltaic generation system can be utilised to supply power for different types of consumer, namely utility grids, industrials as well as household. This article discusses the effect solar radiation to the photovoltaic module with different slope angles namely; 300, 400 and 500 respectively. It was used a 100 Wp solar module in the research. It is not only the slope angle of module analysed in this article but also the weather condition such as: sunny or cloudy conditions. The performances of solar photovoltaic at temperature ranging from 280C to 500C are analysed significantly. The results showed that the above conditions affected the voltage generated by solar photovoltaic system. Finally, the results of this test will be compared with the simulation results of photovoltaic system modeling using Matlab/Simulink.
Copyright © 2018 Institute of Advanced Engineering and Science. All rights reserved.
Corresponding Author:
Azriyenni Azhari Zakri,
Department of Electronical Engineering, Faculty of Engineering, Universitas Riau, Kampus Bina Widya Km 12,5 Simpang Baru, Panam, Pekanbaru, Indonesia Email: [email protected]
1. INTRODUCTION
When integrating solar photovoltaic based renewable energy, a number of problems will arise such as prediction of photovoltaic configuration and battery size, prediction of energy consumption, maximum power system and photovoltaic system performance analysis. Initial stage of solar photovoltaic systems must consider a number of parameters, namely: size, identification and simulation applications. This article will introduce solar radiation model based on weather forecasting system. It produces short-term photovoltaic output predictions from the meteorological department data. The output of solar radiation is a prediction model of photovoltaic power output and computation speed algorithm [1].
Mohamed A has proposed the installation of photovoltaic systems requiring an estimation of solar radiation. The size of the photovoltaic module represents the characteristics of V and I in which the model predicted. Artificial Neural Network Method (ANN) has applied variable parameters controlled and uncontrolled input by way of learning. An advantage of using ANN is the ability to handle complex systems with many parameters [2]. Ramenah has proposed a solar cell based power system sensitivity to temperature. In real conditions, photovoltaic modules operate at temperatures influenced by random solar radiation. Photovoltaic systems are on variable weather basis. He reviewed the experimental influence of changes in temperature relations and solar radiation on the performance of photovoltaic systems. The experimental approach leads to the expression of the solar energy transfer process model to electrical energy [3].
The aim of this research is to evaluate the performance of a 100 Wp at different temperature. Furthermore, the modeling of photovoltaic system is using Matlab/Simulink and will simulate the radiation values against different temperatures. These two results are analysed by the effect of solar absorption on photovoltaic module.
1.1. Solar radiation
Solar energy in electromagnetic radiation emitted to the earth from sunlight. Solar energy consists of photons or particles of solar energy converted into electrical energy. The solar energy arriving at the surface of the earth called a global solar radiation measured by power density at the surface of the receiving area. The average value of earth's solar radiation is 1,353 W/m2 characterised in a solar constant. The intensity of solar radiation has been affected by the cycle time of the earth's rotation. Weather conditions include cloud quality and quantity. The intensity of solar radiation in Indonesia lasts 4 - 5 hours per day [5, 6].
The energy of solar radiation is located in the form of light and electromagnetic waves. The solar radiation spectrum itself consists of two, namely: short wavy rays. Any changes in the distance of the earth and the sun give rise to variations on the reception of solar energy. The intensity of solar radiation, i.e the size of angle of the sun's rays on the surface of the earth. The amount received is precisely proportional to the angle. Rays with oblique angles come less energizing on the earth's surface, because radiation is scattered on very wide surfaces through the atmospheric layers. The rays are angles that are perpendicular further than if the rays with angles come perpendicular. The amount received is precisely proportional to the angular magnitude of the incident angle. The rays atmosphere will partly be adsorbed by gas, dust and water vapor. It will be reflected back and emitted. The rest forwarded to the surface of the earth. Air, moisture and dust will absorb, diffuse, and reflect solar radiation. Clouds absorb most of the radiation at different wavelengths and the radiation situation more complex. In addition, solar radiation is a lot of reflection between cloud and soil for the presence of clouds. This situation will have a significant impact on changes in illumination at the base of the atmosphere. The prediction of solar power we need is information obtained from the meteorology department could not be obtained directly from the meteorology department [7, 8].
For more details, meteorological data such as direct and disperse solar radiation, ambient temperature, humidity and speed may be indispensable for the completeness of the data [9]. The PV generator connected to the grid provides with supplying power to low the voltage distribution network will be the current and voltage unbalance. Non linear characteristic panels solar cell based on various environmental conditions such as temperature and solar radiation [10]. The performance of PV systems According to operate conditions as well as solar cells and the quality of array design. The output voltage, current and power of the PV arrangement vary as a solar function level of irradiation, temperature and load current. Hence, the effect of these three numbers must be observed in the design of PV arrays so that any changes in temperature and sun irradiation levels should not affect the output of the PV array to the load. The PV model is also designed in this paper with a circuit based model to be used with Simulink [11].
2. RESEARCH METHOD
Photovoltaic technology is designed to capture solar energy resulting in higher photovoltaic output voltage than battery voltage. The photovoltaic output voltage adjusted by using Solar Charge Controller (SCC) function as a voltage regulator to the battery. The initial designing can be made to distribute electrical energy according to the required energy. In this research will be tested solar cell with capacity 100 Wp (Watt-peak). It will do a simulation of solar cell based on Matlab/Simulink. The capacity observed the effect of solar radiation, temperature, voltage and current photovoltaic. This paper includes the modeling of photovoltaic module as well as the photovoltaic array. The modeling is built on mathematical expression which was found from the equivalent circuit of a solar cell. The effect of parameter variation on output of a photovoltaic module is thought to be.
The aim of this research is evaluated and simulated using Matlab/Simulink. In this article, it also shows in the performance of current versus voltage generated from the absorption of solar cells. The evaluation was conducted from 08.00 to 17.00 WIB with variation of photovoltaic module slope angles, namely: 30°, 40°, and 50°. The testing procedures are presented as follows.
i. Measuring the absorption of solar radiation on photovoltaic. ii. Measuring temperature on photovoltaic module.
Table 1. Specification of SP-100-P36 Photovoltaic Module Electrical Parameter Photovoltaic Module
Nominal power output 100 W
Voltage open circuit (Voc) 22.6 V
Current short circuit (Isc) 6.09 A
Voltage at Pmax 17.6 V
Current at Pmax 5.69 A
Temperature -
No. of series connected cell 36
Furthermore, this research is further conduction the modeling design of photovoltaic system using Matlab/Simulink. This model of 100 Wp is shown in Figure 1. Figure 1 also shows a simulation with solar radiation input value (Ir) and temperature FV (Tfv). This model is subsequently simulated comprehensively with solar radiation variations of 100 W/m2 to 1000 W/m2.
Figure 1. Photovoltaic modeling via Matlab/Simulink
3. RESULTS AND ANALYSIS
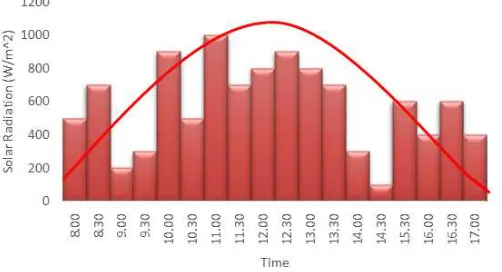
The test results of the solar radiation absorption system on the photovoltaic module expressed in graphical form illustrated in Figure 2 to Figure 4.Figure 2 shows the graph of solar radiation absorption (Ir) when solar panel slope angle at 30. The solar radiation from 100 W/m2 to 1000 W/m2 was used in the simulation. The measured temperature of the photovoltaic module was between 28C to 50C.
Figure 3 shows a graph of solar radiation absorption (Ir) against time when the solar module slope angle at 40. The solar radiation tested 100 W/m2 to 1000 W/m2. The temperature of the photovoltaic module was from 28C to 50C.
Figure 3. Graph of solar radiation absorption at a slope the angle of 40
Figure 4 shows the characteristic of solar radiation absorption (Ir) test against time with the slope angle of the photovoltaic module at 50. Range of solar radiation is form 100 W/m2 to 1000 W/m2. The temperature of the photovoltaic module was from 28C to 50C.
Figure 4. Graph of solar radiation absorption at a slope of the angle of 50
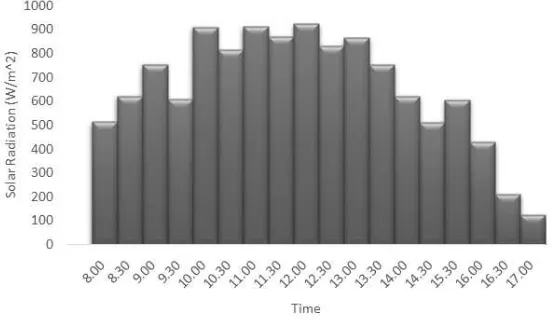
Figure 5. Graph of solar radiation absorption for simulation of photovoltaic systems
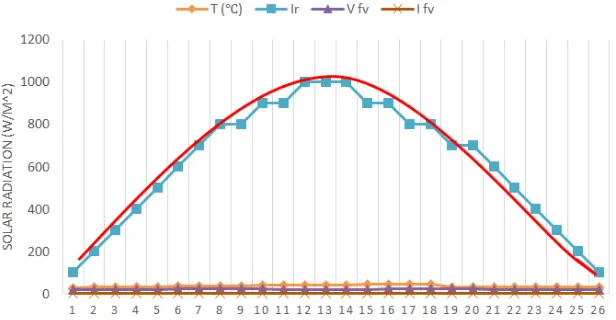
Figure 6 shows a graph of the results of the test results and simulation results of solar radiation absorption (Ir) and power (P) produced by photovoltaic. The power output of the simulation is better than the test result. This is because the weather at the time of testing is not stable, due to the weather that suddenly overcast and consequently the absorbed current becomes unstable.
Figure 6. Graph of the voltage comparison between test and simulation results
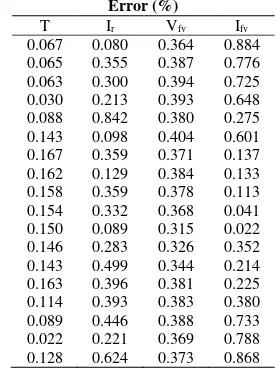
Figure 7. The comparison of error percentage
In this section, it is explained the results of research and at the same time is given the comprehensive discussion. The results can be presented in Figures 7, graphs, Tables and others that make the reader understand easily. The discussion can be made in several sub-chapters.
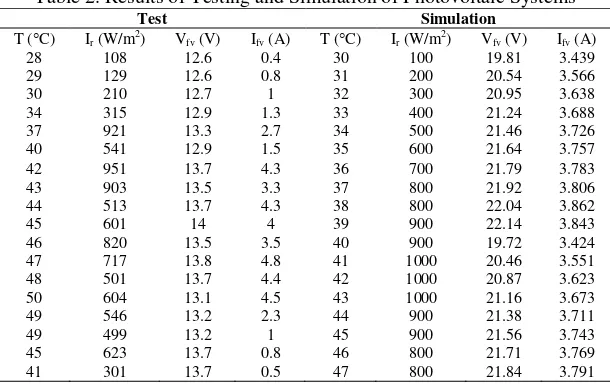
Table 2 shows comparison between the test results and simulation results of a 100 Wp photovoltaic system. The tests were conducted on the temperature from 28C to 50C, and the measured radiation results of 108 W/m2 to 951 W/m2. Furthermore, for the simulation results, the photovoltaic temperature values from 30C to 47C, and input radiation values ranging from 100 W/m2 to 1000 W/m2.
Table 2. Results of Testing and Simulation of Photovoltaic Systems Test Simulation
Table 3 shows the calculation of error values of test results and simulation results for photovoltaic systems. This table 2, for temperature (T) the error value is not more than 0.163%. Solar radiation (Ir) found the highest error value 0.624%. Voltage (Vfv) generated the highest error value 0.404%. Finally, the current (Ifv) is found to be an error value not exceeding 0.884%.
varying angles of different photovoltaic panels. Modeling and characteristics of photovoltaic generator system make it possible to confirm that the slope of angle of 50 provides good absorption of value ideal solar radiation.
Table 3. Result of Error Percentage for Photovoltaic System Error (%)
There are several differences from the results of solar radiation absorption testing conducted by Nurhalim et.al at the temperature interval starting at 24°C and 36°C. The Solar module testing was performed at 08.00 AM - 05.00 PM at temperatures starting from 28°C to 50°C. The extreme weather that occurs causes the process of absorption of solar radiation. The observed differences at significant temperatures, this has the effect of fluctuations occurring on the absorption of radiation to the solar module. This study provides an improvement from previous research that observed the process of solar radiation absorption for the slope of panel angles varied. Finally, this study contributes to the testing of solar cells for the slope of different panel angles. All data will be saved as a data base that can be used as a reference for solar cell design in the future.
4. CONCLUSION
The results of this study have presented the results of direct testing and simulation of 100 Wp photovoltaic system modeling. The test results for photovoltaic module elevation have been performed at different angles. Corner angle elevation has been tested; 30, 40, and 50. The test results of these three elevation angles are not much different. The results of the test and simulation have given the characteristics of the solar radiation absorption system, the voltage characteristics of the photovoltaic system to 100 Wp. Photovoltaic system modeling design that has been designed using software, so it can be a reference for designing the prototype with the capacity we want. Direct testing has been done by observing in different weather. It has been validated with simulation results for the prediction and estimation of solar radiation. The characteristics of the photovoltaic generator system have been confirmed that the slope of angle 50 provides superior absorption of near ideal solar radiation.
REFERENCES
[1] Meijun Lin, Z.W., Yang Liu, Meng Chen, Fanyao Meng, Power Prediction Model of Grid Connected Photovoltaic and Power Flow Analysis, in IEEE. 2012.
[2] Mohamed Abdelmoula, M., Bruno Robert. Design and Modeling of a Stand alone Photovoltaic System. in International conference on Sciences and Techniques of Automatic control & computer engineering 2014. Hammamet, Tunisia: IEEE.
[3] H. Ramenah, C.T., L. Cicero, Toward a prediction of the photovoltaic based power production from Experimental Thermal modeling, in ITEC Asia-Pacific. 2014.
[6] Boucetta Abd Allah, L.D., Control of Power and Voltage of Solar Grid Connected. International Journal of Electrical and Computer Engineering, 2016. 6(1): p. 26-33.
[7] Wikipedia Radiasi Matahari. 2017.
[8] Mohamed Louzazni, E.H.A., Hanane Yatimi, Modeling and Simulation of A Solar Power Source for a Clean Energy without Pollution. International Journal of Electrical and Computer Engineering (IJECE), 2013. 3(4): p. 568-576.
[9] Mustapha Elyaqouti, L.B., Ahmed Ihlal, Modelling and Predicting of the Characteristics of a Photovoltaic Generator on a Horizontal and Tilted Surface. International Journal of Electrical and Computer Engineering (IJECE), 2016. 6(6): p. 2557~2576
[10] Amirullah, A.K., Power Quality Enhancement of Integration Photovoltaic Generator to Grid under Variable Solar Irradiance Level using MPPT-Fuzzy. International Journal of Electrical and Computer Engineering (IJECE), 2016. 6(6): p. 2629~2642.
[11] J. Surya Kumari, C.S.B., Mathematical Modeling and Simulation of Photovoltaic Cell using Matlab-Simulink Environment. International Journal of Electrical and Computer Engineering (IJECE), 2012. 2(1): p. 26~34. [12] Nurhalim, Azriyenni, Firdaus and Syaiful Bahri, Solar Electric Power Generator (SEPG) as a Solution for Peak