Optimization Model On The Use Of Agriculture
Land In The Catchment Area Of Lake Toba
Razali, Zulkifli Nasution, Rahmawaty
Abstract; Different from the study optimization of land use model of a watershed that has been exist; this research aims to get the model of the use of agricultural land in the lake Toba catchment area based on maximum economies advantage. Calculation of the maximum economical agricultural land use based on two things, which are wide cropping who guided by land evaluation suitability and analysis of farmer's agricultural commodities that are cultivated on the lake Toba catchment area. This research was conducted with methods of survey and regression analysis. The results show that there is diversity and farmer advantage and if sorted then: mango > red onion > clove>hazelnut> bunded rice> peanuts >Arabica coffee > cassava > corn. Only 18 of the total 36 Land units on land area of study that suit to be area cropping commodities are tested with an area of 137847.90 ha. Land use in the catchment area of Lake Toba achieving profitability with optimal combination of farmer cropping mango (89.28%), the onion (9.27%) and bunded rice (1.45%).
Keywords: catchment area, land suitability, lands unit, the advantage of farming system.
————————————————————
1.
Introduction
Optimization of agricultural land is increased utilization of the land resources while not organized or lower cropping index into a more productive farming land (Ministry of Agriculture, 2012). According to Zhang, et al., (2012), an optimal allocation of land use activities to improve the efficiency of land use types to determine the appropriate land use. Sarker, et al, (1977), stating the proper selection of plants for every type of land is a major issue in an attempt to maximize the overall contribution of land. Planning of the plant is related to many factors such as the type of land, yield rate, weather conditions, and availability of agricultural inputs, food requirements, capital availability, and cost of production. Study of land use optimization models a Watershed / Sub-watershed / catchment area commonly used there are 3 models, namely based agroforestry (Rauf, 2005; Hilmanto, 2012); based on hydrology and erosion prediction (Montarcih, et al., 2010; Sutapa, 2010) and is based on the allocation of land use (Nikkami et al, 2009; Walangitan et.al.2012). All three models of studies above do not describe the optimization of the use of agricultural land from the economical (for maximum advantage). According to Hassan, et al., (2005), the benefit of farmers cannot be maximized without optimal cropping patterns. Determination of optimum cropping pattern is one farm planning that can be done to anticipate the limited land area and the achievement of maximum profitability. Therefore, it is necessary to study a model that looked at optimizing the use of land for farming economic benefit maximum at a Watershed. This model is based on consideration of the suitability of land plants and their farm profits.
2.
Materials and Methods
2.1 Description of Study Area.
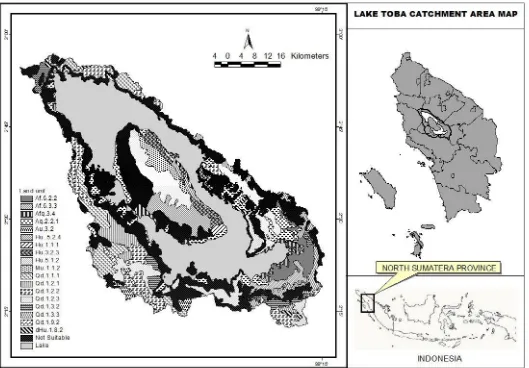
Studies the entire catchment area of Lake Toba. Including parts of North Sumatra Province of The Indonesia Republic
.Located in the geographic position 98° 20’– 99° 50’ east longitude and 2° 10’–3° 0’ North latitude (Figure 1). Altitude 900 – 2.195 m above sea level. Has an average temperature range between 19.3 –21,4 °C, the average humidity is 82 - 88% and the average yearly rainfall between 1561-2203 mm. On the basis of the potential of land resources / natural area of Lake Toba diverse and reliable for the purpose of accelerating the development, the Lake Toba catchment area becomes very important. In 2008, the Indonesian government set the Lake Toba region as a National Strategic Area with emphasis on its function in the supporting capacity of the environment. Most of the population living in the region of Lake Toba catchment area rely the agricultural sector as a source of livelihood. In practice economic commodity choice and cultivated planting area farmers often change every year.
______________________
Razali, Zulkifli Nasution, B.S.J.Damanik, Rahmawaty affliliated Faculty of Agriculture, University of Sumatera Utara. Medan 20155. Indonesia
Razali, Faculty of Agriculture, University of Sumatera Utara. Medan 20155. Indonesia
2 Figure 1. Lake Toba Catchment Area Map
2.2 Data Collection
The study used survey methods, data collected consists of: a. Primary data, form of the data :
i. Feasibility of farming system, farmers obtained using interviews through filling a questionnaire that has been prepared.
As for agricultural commodities that will be used for this research is a plant that has been in economic value for the community know in Lake Toba catchment area, namely:
Seasonal crops: bunded rice, corn, cassava, peanuts and red onion.
Annual crops: mango, Arabica coffee, clove and hazelnut.
ii.Land quality of each land unit incoming catchment area Lake Toba, form of limiting factor: the availability of oxygen (oa), rooting condition (rc), erosion hazard (er), flooding hazard (fh) and land preparation (lp). While the limiting factor of temperature (tc) and the availability of water (wa) is known from the climate data processing. Land units obtained by overlay the Lake Toba catchment area maps with maps of land units and book Map Land and Land Unit Pematangsiantar Sheet (0718) and Sidikalang (0618) (Junus et al., 1989). b. Secondary data is a general overview of the research
areas of data sourced from the Central Bureau of
Statistics Department of Meteorology and Geophysics, Land Research Center of Bogor and reports / maps of institutions / agencies.
2.3 Methodology
i. The advantage of farming system
Damanik (2007), states that the analysis of income (profit) farm is the result of a reduction between revenue and costs. Farm income using the formula:
𝜋” = TR – TC ...(1) 𝜋” = Revenue of farming system
TR = Total benefit
TC = Total cost
To know the economic feasibility of farming can be defined by: Benefit Cost Ratio (B / C ratio) is the ratio between the benefit to cost. Criteria B / C ratio ,i.e.: a. B/C ratio > 1,means farming profitable
b. B/C ratio < 1, means farming unprofitable
c. B/C ratio = 1,means farming at breakeven (revenues = expenditures), or the occurrence of Break Event Point (BEP)
ii. Land Suitability Classification
technical guidelines for land evaluation for agricultural commodities Ministry of Agriculture of the Republic of Indonesia (Djaenudin et al, 2011).This method is a modification of the structure of land suitability classification according to the framework of FAO (1976) which can be distinguished according to their levels, i.e. the level of the Order, class, subclass, and unit. Order is the state of the global land suitability. At the level of the land suitability order to distinguish between land that is classified as suitable (S = Suitable) and land that is not suitable (N = Not Suitable). Class is a state level according to the level of orders. At the class level, land belonging to the order corresponding (S) differentiated into three classes, i.e.: land highly suitable (S1), is quite suitable (S2), and marginally suitable (S3). While the land belonging to the order is not suitable (N) is not differentiated into classes. Sub-Class is a state level in the land suitability classes. Land suitability classes are divided into subclasses based on the quality and characteristics of the land that became the heaviest limiting factor. In this study, land suitability classification performed until the level of subclass.
iii. Model
To calculate the economic value of land use (Imax) /
year of linear equations used (Sarker et al, 1997; Hassan et al., 2005; Walangitan, et al., 2012):
n 11
Imax = ∑ ∑ PijXij ………equation (1) J=1 i=1
Imax = maximum profit
i = type of plant (i = 1,2,3, ...., 10); consecutive 1 = bunded rice, 2 = corn, 3 = cassava, 4 = peanuts 5 = red onion, 6 = mango, 7 = Arabica coffee, 8 = cloves and 9 = hazelnut.
J = Land Unit; (j = 1, 2, ..n)
Xij = area of land for crop i (ha) in the Land Unit j
Pi = profit on a farm (IDR) of plant i / ha in the Land
Unit j
3.
Results
3.1. Farming
4 3.2 Land Suitability Commodities in catching area
Unit Land Lake Toba.
Land units are relatively homogeneous areas related to climate, landscape, soil and vegetation. Each land unit has the same problems and opportunities to respond to the management carried out (FAO, 1993). Land suitability evaluation is done by matching (match) between characteristics of the land in each land unit to growth requirements / land use according to the technical guidelines for land evaluation for agricultural commodities Ministry of Agriculture of the Republic of Indonesia (Djaenudin et al, 2011). For the evaluation of land suitability, land units that have a slope> 30% do not need to do land evaluation testing anymore because the terms of the slope of the hillside have not qualified for used in agriculture sector. Based on the description of each land unit information by Junus et al., (1989), known in the catchment area Lake Toba there are 12 land units that have a slope> 30%. So from 36 Land units found only 24 who
3.3 Optimization farming advantage modeling in Lake Toba catching area.
In the context of land optimization, linear programming model has been developed to determine the area to be used for different crops for maximum contribution (Sarker et al, 1997; Hassan et al., 2005; Walangitan, et al., 2012). To achieve the optimization of the economic advantages of land use are two main things to note are the advantages of farming and cropping patterns. The summary of the average results of farming some agricultural commodities in the Lake Toba catchment area can be seen in Table 1, while based on land suitability evaluation, land acquired units in Lake Toba catching area which can be used as a cultivation area for agricultural commodities that were tested (Table 2). Land suitability categories S2 / S3 are a unit of land that can be cultivated with the commodity being tested. While the land suitability of commodity categories N means tested cannot be cultivated on land units intended. By combining the data of land suitability evaluation and the results of the farm, then the linear model for the optimal benefit of farming in Lake Toba catching area is:
P max = 13.3 X1 + 5.6 X2 + 6.6 X3 +10.8 X4 + 25.3 X5 +
From processing possible combinations of crops that may be made based on the suitability of the land, then the value of Pmax is obtained by a combination of planting bunded rice
2001.17 ha, red onion 12781.13 ha and mango 123,065.6 ha. So the value:
Pmax = 13.3 X1+ 25.3 X5 + 29.2 X6
Pmax = 13.3(2001,17) + 25.3(12781,13) + 29.2(123065,60)
= 3941927million
By considering that in the study area:
Within one year, there are 2 seasons namely the rainy season and the dry season when the season effect on the choice of crops.
From the experience of the local farmers that planting at one location is not allowed to plant the same crop in the rainy season and the dry season (can lead to crop failure).
The cropping pattern that provides the optimum advantages is:
In the dry season peanut 12781.13 ha. The rest of the land area of 2001.17 ha (land units Au 3.2) is
not suitable for crops that being tested besides bunded rice. In order to be used in the dry season to land the unit is necessary to find other suitable plants.
Conclusions
This study tried to obtain a model of land use in the Lake Toba catchment area the highest farming advantage. From the results of the study concluded:
1. For agricultural commodities that being tested, mango gives the highest farm advantages. While the lowest corn.
2. Not all land units in Lake Toba catching area can be used for agriculture.
3. Models of land use to get the optimization advantages of farming in Lake Toba catching area with a combination of planting: bunded rice 2001.17 ha, red onion 12781.13 ha and mango 123,065.6 ha.
Suggestions
Cultivation of plants for some commodities made in Lake Toba catching area is simple so that their farm advantages are also small. It is possible to conduct intensive cultivation. This will affect their farm advantages that will affect the use of land in the Lake Toba catching area.
Acknowledgment
We are grateful to Directorate General of higher education of the Ministry of education and culture of Indonesia for providing financial assistance and professional advice; The University of Sumatera Utara (USU), Medan, Indonesia, for financial assistance and support for this research.
References
[1] Damanik S. 2007. Analisis Ekonomi Usahatani Serai Wangi (Studi Kasus Kecamatan Gunung Halu, Kabupaten Bandung Selatan). Bul. Littro. Vol. XVIII No. 2, 2007, 203 – 221.
[2] Djaenudin, D., Marwan, H., Subagjo, H., dan A. Hidayat. 2011. Petunjuk Teknis Evaluasi Lahan Untuk Komoditas Pertanian. Balai Besar Litbang Sumberdaya Lahan Pertanian, Badan Litbang Pertanian, Bogor. 36p.
[3] Food and Agricultural Organization (FAO) (1993). Guidelines for Land Use Planning. Rome, Italy.
[4] Hassan I., M.A. Raza, I.A. Khan and R. Ilahi. 2005. Use of Linear Programming Model to Determine the Optimum Cropping Pattern, Production and Income Level: A Case Study from Dera Ghazi Khan Division. Journal Of Agriculture & Social Sciences Vol. 1, No. 1, 2005 p 32-34
[5] Hilmanto. R. 2012. Optimalisasi Harga Komoditi Agroforestri Untuk Meningkatkan Pendapatan Petani. Jurnal Administrasi Bisnis.Vol 1.No1.(2012).hal 84-91.
6
Balsem. Explanatory booklet of the Land Unit and Soil map of The Pematangsiantar (0718) and Sidikalang (0618) sheets, Sumatra. Center for Soil Research Bogor.
[7] Kementerian Pertanian.2012. Pedoman Teknis Pengembangan Optimasi Lahan T.A. 2012. Direktorat Perluasan dan Pengelolaan Lahan, Direktorat Jenderal Prasarana dan Sarana Pertanian.
[8] Montarcih L., A. Masrevaniah dan E. A. Subiyantoro. 2010. Studi Optimasi Pengelolaan dan Pengembangan Sub Daerah Aliran.Sungai (DAS) Lesti Kabupaten Malang. Jurnal pengairan. Vol 1, No 2 (2010). Hal 76-83.
[9] Nikkami D. M. Shabbani and H.Ahmadi. 2009. Land Use Scenarios and Optimization in a Watershed. Journal of Applied Sciences 9 (2): 287-295, 2009.
[10] Rauf A. 2005. Optimalisasi Sistem Agroforestry Di Kawasan Perbukitan Kritis Guna Mendukung Kebutuhan Hidup Layak Petani.(Kasus Kawasan Penyangga Taman Nasional Gunung Leuser,Kabupaten Langkat, Sumatera Utara). Prosiding Seminar Nasional Sosialisasi Hasil Penelitian dan Pengkajian Pertanian Sumatera Utara, 21-22 November 2005.ISBN:979-3137-05-03. Hal 573-581.
[11] Sarker R.A., S. Talukdar and A.F.M. Anwarul Haque. 1997. Determination of Optimum Crop Mix For Crop Cultivation in Bangladesh. Appl. Math. Modelling, 1997, Vol. 21, October.
[12] Sutapa I.W. 2010. Analisis Potensi Erosi pada Daerah Sungai (DAS) di Sulawesi Tengah. Jurnal SMARTek, Vol. 8 No. 3. Agustus 2010: 169 – 181.
[13] Walangitan, H.D., B. Setiawan, B.T. Raharjo and B. Polii. 2012. Optimization of Land Use and Allocation to Ensure Sustainable Agriculture in the Catchment Area of Lake Tondano, Minahasa, North Sulawesi, Indonesia. International Journal of Civil & Environmental Engineering IJCEE-IJENS Vol: 12 No: 03 p 68-75