Microsoft
®SQL Server
®2012 Analysis Services:
The BISM Tabular Model
Published with the authorization of Microsoft Corporation by: O’Reilly Media, Inc.
1005 Gravenstein Highway North Sebastopol, California 95472
Copyright © 2012 by Marco Russo, Alberto Ferrari, Christopher Webb
All rights reserved. No part of the contents of this book may be reproduced or transmitted in any form or by any means without the written permission of the publisher.
ISBN: 978-0-7356-5818-9
1 2 3 4 5 6 7 8 9 M 7 6 5 4 3 2
Printed and bound in the United States of America.
Microsoft Press books are available through booksellers and distributors worldwide. If you need support related to this book, email Microsoft Press Book Support at [email protected]. Please tell us what you think of this book at http://www.microsoft.com/learning/booksurvey.
Microsoft and the trademarks listed at http://www.microsoft.com/about/legal/en/us/IntellectualProperty/ Trademarks/EN-US.aspx are trademarks of the Microsoft group of companies. All other marks are property of their respective owners.
The example companies, organizations, products, domain names, email addresses, logos, people, places, and events depicted herein are fictitious. No association with any real company, organization, product, domain name, email address, logo, person, place, or event is intended or should be inferred.
This book expresses the author’s views and opinions. The information contained in this book is provided without any express, statutory, or implied warranties. Neither the authors, O’Reilly Media, Inc., Microsoft Corporation, nor its resellers, or distributors will be held liable for any damages caused or alleged to be caused either directly or indirectly by this book.
Acquisitions and Developmental Editor: Russell Jones Production Editor: Holly Bauer
Editorial Production: nSight, Inc.
Technical Reviewers: Darren Gosbell and John Mueller Copyeditor: Kerin Forsyth / Ann Weaver
Indexer: Nancy Guenther
Cover Design: Twist Creative • Seattle
To the many BI communities that have supported me in the
last years.
—M
arcor
ussoI dedicate this book to Caterina, Lorenzo, and Arianna: my
family.
—a
lbertoF
errariI dedicate this book to my wife, Helen, and my two daughters,
Natasha and Mimi. Thank you for your love, understanding, and
patience.
Contents at a Glance
Foreword xix
Introduction xxi
ChApTeR 1 Introducing the Tabular Model 1
ChApTeR 2 Getting Started with the Tabular Model 19
ChApTeR 3 Loading Data Inside Tabular 75
ChApTeR 4 DAX Basics 121
ChApTeR 5 Understanding evaluation Context 147
ChApTeR 6 Querying Tabular 185
ChApTeR 7 DAX Advanced 237
ChApTeR 8 Understanding Time Intelligence in DAX 291
ChApTeR 9 Understanding xVelocity and DirectQuery 329
ChApTeR 10 Building hierarchies 361
ChApTeR 11 Data Modeling in Tabular 381
ChApTeR 12 Using Advanced Tabular Relationships 407
ChApTeR 13 The Tabular presentation Layer 429
ChApTeR 14 Tabular and powerpivot 449
ChApTeR 15 Security 463
ChApTeR 16 Interfacing with Tabular 487
ChApTeR 17 Tabular Deployment 513
ChApTeR 18 Optimizations and Monitoring 559
AppenDIX A DAX Functions Reference 589
What do you think of this book? We want to hear from you! Microsoft is interested in hearing your feedback so we can continually improve our books and learning resources for you. To participate in a brief online survey, please visit:
microsoft.com/learning/booksurvey
Contents
Foreword . . . xix
Introduction . . . xxi
Chapter 1 Introducing the Tabular Model
1
The Microsoft BI Ecosystem . . . 1What Is Analysis Services and Why Should I Use It? . . . 1
A Short History of Analysis Services . . . 2
The Microsoft BI Stack Today . . . 3
Self-Service BI and Corporate BI . . . 4
Analysis Services 2012 Architecture: One Product, Two Models . . . 6
The Tabular Model . . . 6
The Multidimensional Model . . . 8
Why Have Two Models? . . . 9
The Future of Analysis Services . . . 10
Choosing the Right Model for Your Project . . . .11
Licensing . . . .11
Upgrading from Previous Versions of Analysis Services . . . .12
Ease of Use . . . .12
Compatibility with PowerPivot . . . .12
Query Performance Characteristics . . . .13
Processing Performance Characteristics . . . .13
Hardware Considerations . . . .13
Real-Time BI . . . 14
Client Tools . . . .15
Feature Comparison . . . .15
Chapter 2 Getting Started with the Tabular Model
19
Setting Up a Development Environment . . . .19
Components of a Development Environment . . . .19
Licensing . . . .21
Installation Process . . . .21
Working with SQL Server Data Tools . . . 31
Creating a New Project . . . 31
Configuring a New Project . . . .33
Importing from PowerPivot . . . .37
Importing a Deployed Project from Analysis Services . . . .38
Contents of a Tabular Project . . . .38
Building a Simple Tabular Model . . . .40
Loading Data into Tables . . . 41
Working in the Diagram View . . . .49
Deployment . . . .52
Querying a Tabular Model in Excel . . . .53
Connecting to a Tabular Model . . . .54
Querying a Tabular Model in Power View . . . .65
Creating a Connection to a Tabular Model . . . .65
Building a Basic Power View Report . . . .66
Adding Charts and Slicers . . . .68
Interacting with a Report . . . .69
Working with SQL Server Management Studio . . . .71
Summary. . . 74
Chapter 3 Loading Data Inside Tabular
75
Understanding Data Sources . . . .75Understanding Impersonation . . . .77
Understanding Server-Side and Client-Side Credentials . . . 78
Working with Big Tables . . . .79
Loading from SQL Server . . . .80
Loading from a List of Tables . . . .83
Loading from a SQL Query . . . .87
Loading from Views . . . .87
Opening Existing Connections . . . .88
Loading from Access . . . .89
Loading from Analysis Services . . . .90
Using the MDX Editor . . . .92
Loading from a Tabular Database . . . 92
Loading from an Excel File . . . .95
Loading from a Text File . . . .98
Loading from the Clipboard . . . .100
Loading from a Reporting Services Report . . . .103
Loading Reports by Using Data Feeds . . . .108
Loading from a Data Feed . . . .110
Loading from SharePoint . . . .112
Loading from the Windows Azure DataMarket . . . .113
Choosing the Right Data-Loading Method . . . .116
Understanding Why Sorting Data Is Important . . . .118
Summary. . . .119
Chapter 4 DAX Basics
121
Understanding Calculation in DAX . . . .121DAX Syntax . . . .121
DAX Data Types . . . .123
DAX Operators . . . .124
DAX Values . . . .125
Understanding Calculated Columns and Measures . . . .125
Calculated Columns . . . .126
Measures. . . .126
Editing Measures by Using DAX Editor . . . .129
Choosing Between Calculated Columns and Measures . . . .130
Handling Errors in DAX Expressions . . . .131
Arithmetical Operation Errors . . . .132
Empty or Missing Values . . . .133
Intercepting Errors . . . .134
Common DAX Functions . . . .135
Aggregate Functions . . . .135
Logical Functions . . . .137
Information Functions . . . .138
Mathematical Functions . . . .139
Text Functions . . . .140
Conversion Functions . . . .140
Date and Time Functions . . . .140
Relational Functions. . . .141
Using Basic DAX Functions . . . .142
Summary. . . .146
Chapter 5 Understanding Evaluation Context
147
Evaluation Context in a Single Table . . . .147Filter Context in a Single Table . . . .148
Row Context in a Single Table . . . .151
Working with Evaluation Context for a Single Table . . . .157
Understanding the EARLIER Function . . . .161
Understanding Evaluation Context in Multiple Tables . . . .164
Row Context with Multiple Tables . . . .164
Understanding Row Context and Chained Relationships . . . .167
Using Filter Context with Multiple Tables . . . .168
Understanding Row and Filter Context Interactions . . . .173
Modifying Filter Context for Multiple Tables . . . .177
Final Considerations for Evaluation Context . . . .183
Summary. . . .183
Chapter 6 Querying Tabular
185
Tools for Querying Tabular . . . .185Using CALCULATETABLE and FILTER . . . 189
Using ADDCOLUMNS . . . 192
Using SUMMARIZE . . . 194
Using CROSSJOIN, GENERATE, and GENERATEALL . . . 203
Using ROW . . . 208
Using CONTAINS . . . 209
Using LOOKUPVALUE . . . 211
Defining Measures Inside a Query . . . .213
Test Your Measures with a Query . . . .216
Parameters in DAX Query . . . .217
Using DAX Query in SQL Server Reporting Services . . . .219
Querying by Using MDX . . . .223
Using DAX Local Measures in MDX Queries . . . .229
Drillthrough in MDX Queries . . . .230
Choosing Between DAX and MDX . . . .233
Summary. . . .235
Chapter 7 DAX Advanced
237
Understanding CALCULATE and CALCULATETABLE Functions . . . .237Evaluation Context in DAX Queries . . . .238
Modifying Filter Context by Using CALCULATETABLE . . . 240
Using FILTER in CALCULATE and CALCULATETABLE Arguments . .244 Recap of CALCULATE and CALCULATETABLE Behavior . . . .252
Control Filters and Selections . . . .252
Using ALLSELECTED for Visual Totals . . . .253
Filters and Cross Filters . . . .257
Maintaining Complex Filters by Using KEEPFILTERS . . . 267
Sorting Functions . . . .272
Using TOPN . . . 272
Using RANKX . . . 276
Statistical Functions . . . .285
Standard Deviation and Variance by Using STDEV and VAR . . . . 285
Sampling by Using the SAMPLE Function . . . .287
Summary. . . .290
Chapter 8 Understanding Time Intelligence in DAX
291
Tabular Modeling with Date Table . . . .291Creating a Date Table . . . .292
Defining Relationship with Date Tables . . . .296
Duplicating the Date Table . . . .302
Setting Metadata for a Date Table . . . .306
Time Intelligence Functions in DAX . . . .307
Aggregating and Comparing over Time . . . .307
Semiadditive Measures . . . .321
Summary. . . .328
Chapter 9 Understanding xVelocity and DirectQuery
329
Tabular Model Architecture in Analysis Services 2012 . . . .329In-Memory Mode and xVelocity . . . .331
Query Execution in In-Memory Mode . . . .331
Row-Oriented vs. Column-Oriented Databases . . . .334
xVelocity (VertiPaq) Storage . . . .337
Memory Usage in xVelocity (VertiPaq) . . . .339
Optimizing Performance by Reducing Memory Usage . . . .342
Understanding Processing Options . . . .348
Using DirectQuery and Hybrid Modes . . . .351
DirectQuery Mode . . . .352
Analyzing DirectQuery Mode Events by Using SQL Profiler . . . . .354
DirectQuery Settings . . . .355
Development by Using DirectQuery . . . .359
Chapter 10 Building Hierarchies
361
Basic Hierarchies . . . .361
What Are Hierarchies? . . . .361
When to Build Hierarchies . . . .363
Building Hierarchies . . . .363
Hierarchy Design Best Practices . . . .364
Hierarchies Spanning Multiple Tables . . . .365
Parent/Child Hierarchies . . . .367
What Are Parent/Child Hierarchies? . . . .367
Configuring Parent/Child Hierarchies . . . .368
Unary Operators . . . .373
Summary. . . .380
Chapter 11 Data Modeling in Tabular
381
Understanding Different Data Modeling Techniques . . . .381Using the OLTP Database . . . .383
Working with Dimensional Models . . . .384
Working with Slowly Changing Dimensions . . . .386
Working with Degenerate Dimensions . . . .389
Using Snapshot Fact Tables . . . .390
Computing Weighted Aggregations . . . .393
Understanding Circular Dependencies . . . .396
Understanding the Power of Calculated Columns: ABC Analysis . . . .399
Modeling with DirectQuery Enabled . . . .403
Using Views to Decouple from the Database . . . .405
Summary. . . .406
Chapter 12 Using Advanced Tabular Relationships
407
Using Multicolumn Relationships . . . .407Banding in Tabular . . . .410
Implementing Basket Analysis . . . 417
Querying Data Models with Advanced Relationships . . . .421
Implementing Currency Conversion . . . .425
Summary. . . .428
Chapter 13 The Tabular Presentation Layer
429
Naming, Sorting, and Formatting . . . .429Naming Objects . . . .429
Hiding Columns . . . .431
Organizing Measures . . . .432
Sorting Column Data . . . .432
Formatting . . . .436
Perspectives . . . .438
Power View–Related Properties . . . .440
Default Field Set . . . .441
Table Behavior Properties . . . .442
Drillthrough . . . 444
KPIs . . . .445
Summary. . . .448
Chapter 14 Tabular and PowerPivot
449
PowerPivot for Microsoft Excel 2010 . . . .449Using the PowerPivot Field List . . . .452
Understanding Linked Tables . . . .455
PowerPivot for Microsoft SharePoint . . . .455
Using the Right Tool for the Job . . . .458
Prototyping in PowerPivot, Deploying with Tabular . . . .460
Summary. . . .461
Chapter 15 Security 463
Roles . . . .463Administrative Security . . . .466
The Server Administrator Role . . . .466
Database Roles and Administrative Permissions . . . .468
Data Security . . . .469
Basic Data Security . . . .469
Testing Data Security . . . .471
Advanced Row Filter Expressions . . . 474
Dynamic Security . . . .479
DAX Functions for Dynamic Security . . . .479
Implementing Dynamic Security by Using CUSTOMDATA . . . 480
Implementing Dynamic Security by Using USERNAME . . . 481
Advanced Authentication Scenarios . . . .482
Connecting to Analysis Services from Outside a Domain . . . .482
Kerberos and the Double-Hop Problem . . . .483
Monitoring Security . . . .484
Summary. . . .486
Chapter 16 Interfacing with Tabular
487
Understanding Different Tabular Interfaces . . . .488Understanding Tabular vs. Multidimensional Conversion . . . .488
Using AMO from .NET . . . .491
Writing a Complete AMO Application . . . .494
Creating Data Source Views . . . .494
Creating a Cube . . . .495
Loading a SQL Server Table . . . .495
Creating a Measure . . . .498
Creating a Calculated Column . . . .500
Creating Relationships . . . .501
Drawing Some Conclusions . . . .506
Performing Common Operations in AMO with .NET . . . .507
Processing an Object . . . .507
Using AMO with PowerShell . . . .509
Using XMLA Commands . . . .510
CSDL Extensions . . . .512
Summary. . . .512
Chapter 17 Tabular Deployment
513
Sizing the Server Correctly . . . .513xVelocity Requirements . . . .513
DirectQuery Requirements . . . 517
Automating Deployment to a Production Server . . . 517
Table Partitioning . . . .518
Defining a Partitioning Strategy . . . .518
Defining Partitions for a Table in a Tabular Model. . . .520
Managing Partitions for a Table . . . .524
Processing Options . . . .527
Available Processing Options . . . .528
Defining a Processing Strategy . . . .532
Executing Processing . . . .535
Processing Automation . . . .539
Using XMLA . . . .539
Using AMO . . . .545
Using PowerShell . . . .546
Using SSIS . . . .547
DirectQuery Deployment . . . .551
Define a DirectQuery Partitioning Strategy . . . .551
Implementing Partitions for DirectQuery and Hybrid Modes . . . .552
Security and Impersonation with DirectQuery . . . .557
Summary. . . .558
Chapter 18 Optimizations and Monitoring
559
Finding the Analysis Services Process . . . .559Understanding Memory Configuration . . . .561
Understanding Query Plans . . . .569
Understanding SUMX . . . 575
Gathering Time Information from the Profiler . . . .577
Common Optimization Techniques . . . .578
Currency Conversion . . . .578
Applying Filters in the Right Place . . . .580
Using Relationships Whenever Possible . . . .582
Monitoring MDX Queries . . . .584
Monitoring DirectQuery . . . .585
Gathering Information by Using Dynamic Management Views . . . .585
Summary. . . .587
Appendix A
DAX Functions Reference
589
Statistical Functions . . . .589Table Transformation Functions . . . .591
Logical Functions . . . .591
Information Functions . . . .592
Mathematical Functions . . . .593
Text Functions . . . .594
Date and Time Functions . . . .595
Filter and Value Functions . . . .597
Time Intelligence Functions . . . .598
Index 601
About the Authors 627
What do you think of this book? We want to hear from you! Microsoft is interested in hearing your feedback so we can continually improve our books and learning resources for you. To participate in a brief online survey, please visit:
Foreword
I
have known Marco Russo, Alberto Ferrari, and Chris Webb for many years through my work on the Analysis Services product team. Early on, these authors were among the first to embrace multidimensional modeling and offered their insights and suggestions as valued partners to help us make the product even better. When we introduced tabu-lar modeling in SQL Server 2012, the authors were on board from the start, participat-ing in early reviews and applyparticipat-ing their substantial skills to this new technology. Marco, Alberto, and Chris have been instrumental in helping to shape the product design and direction, and we are deeply grateful for their contributions.The authors are truly among the best and brightest in the industry. Individually and collectively, they have authored many books. Expert Cube Development with Microsoft SQL Server 2008 Analysis Services notably stands out as a must-have book for under-standing multidimensional modeling in Analysis Services. In addition to writing amazing books, you can often find Marco, Alberto, and Chris speaking at key conferences, run -ning trai-ning courses, and consulting for companies who are applying business intel-ligence to improve organizational performance. These authors are at the top of their field; their blogs come up first in the search list for almost any query you might have related to building business intelligence applications.
The book you have in your hands describes ways to build business intelligence applications in detail, using DAX and tabular models. But what truly sets this book apart is its practical advice. This is a book that only seasoned BI practitioners could write. It is a great blend of the information you need the most: an all-up guide to tabular model-ing, balanced with sensible advice to guide you through common modeling decisions. I hope you enjoy this book as much as I do. I’m sure it will become an essential resource that you keep close at hand whenever you work on tabular models.
Edward Melomed Program Manager
Introduction
W
hen we, the authors of this book, first learned what Microsoft’s plans were for Analysis Services in the SQL Server 2012 release, we were not happy. Analysis Services hadn’t acquired much in the way of new features since 2005, even though in the meantime it had grown to become the biggest-selling OLAP tool. It seemed as if Microsoft had lost interest in the product. The release of PowerPivot and all the hype surrounding self-service Business Intelligence (BI) suggested that Microsoft was no longer interested in traditional corporate BI, or even that Microsoft thought profes-sional BI developers were irrelevant in a world where end users could build their own BI applications directly in Excel. Then, when Microsoft announced that the technology underpinning PowerPivot was to be rolled into Analysis Services, it seemed as if all our worst fears had come true: the richness of the multidimensional model was being aban-doned in favor of a dumbed-down, table-based approach; a mature product was being replaced with a version 1.0 that was missing a lot of useful functionality. Fortunately, we were proven wrong and as we started using the first CTPs of the new release, a much more positive—if complex—picture emerged.SQL Server 2012 is undoubtedly a milestone release for Analysis Services. Despite all the rumors to the contrary, we can say emphatically that Analysis Services is neither dead nor dying; instead, it’s metamorphosing into something new and even more pow -erful. As this change takes place, Analysis Services will be a two-headed beast— almost two separate products (albeit ones that share a lot of the same code). The Analysis Services of cubes and dimensions familiar to many people from previous releases will become known as the “Multidimensional Model,” while the new, PowerPivot-like flavor of Analysis Services will be known as the “Tabular Model.” These two models have dif-ferent strengths and weaknesses and are appropriate for difdif-ferent projects. The Tabular Model (which, from here onward, we’ll refer to as simply Tabular) does not replace the Multidimensional Model. Tabular is not “better” or “worse” than Multidimensional. Instead, the Tabular and Multidimensional models complement each other well. Despite our deep and long-standing attachment to Multidimensional, Tabular has impressed us because not only is it blindingly fast, but because its simplicity will bring BI to a whole new audience.
unlikely to be interested in reading about the Multidimensional Model anyway. One of the first things we’ll do in this book is to give you all the information you need to make the decision about which model to use.
We have enjoyed learning about and writing about Tabular and we hope you enjoy reading this book.
Who Should Read This Book
This book is aimed at professional Business Intelligence developers: consultants or members of in-house BI development teams who are about to embark on a project using the Tabular Model.
Assumptions
Although we’re going to start with the basics of Tabular—so in a sense this is an intro-ductory book—we’re going to assume that you already know certain core BI concepts such as dimensional modeling and data warehouse design. Some previous knowledge of relational databases, and especially SQL Server, will be important when it comes to understanding how Tabular is structured and how to load data into it and for topics such as DirectQuery.
Previous experience with Analysis Services Multidimensional isn’t necessary, but because we know most readers of this book will have some we will occasionally refer to its features and compare them with equivalent features in Tabular.
Who Should Not Read This Book
No book is suitable for every possible audience, and this book is no exception. Those without any existing business intelligence experience will find themselves out of their depth very quickly, as will managers who do not have a technical background.
Organization of This Book
introduce DAX, its concepts, syntax and functions, and how to use it to create calcu-lated columns, measures, and queries. Chapters 9 through 16 will deal with numerous Tabular design topics such as hierarchies, relationships, many-to-many, and security. Finally, Chapters 17 and 18 will deal with operational issues such as hardware sizing and configuration, optimization, and monitoring.
Conventions and Features in This Book
This book presents information using conventions designed to make the information readable and easy to follow:
■ Boxed elements with labels such as “Note” provide additional information or alternative methods for completing a step successfully.
■ Text that you type (apart from code blocks) appears in bold.
■ A plus sign (+) between two key names means that you must press those keys at the same time. For example, Press Alt+Tab means that you hold down the Alt key while you press the Tab key.
■ A vertical bar between two or more menu items (for example, File | Close), means that you should select the first menu or menu item, then the next, and so on.
System Requirements
You will need the following hardware and software to install the code samples and sample database used in this book:
■ Windows Vista SP2, Windows 7, Windows Server 2008 SP2, or greater. Either 32-bit or 64-bit editions will be suitable.
■ At least 4 GB of free space on disk.
■ At least 4 GB of RAM.
■ A 2.0GHz x86 or x64 processor or better.
Code Samples
The database used for examples in this book is based on Microsoft’s Adventure Works 2012 DW sample database. Because there are several different versions of this database in existence, all of which are slightly different, we recommend that you download the database from the link below rather than use your own copy of Adventure Works if you want to follow the examples.
All sample projects and the sample database can be downloaded from the following page:
http://go.microsoft.com/FWLink/?Linkid=254183
Follow the instructions to download the BismTabularSample.zip file and the sample database.
Installing the Code Samples
Follow these steps to install the code samples on your computer so that you can follow the examples in this book:
1. Unzip the samples file onto your hard drive.
2. Restore the two SQL Server databases from the .bak files that can be found in the Databases directory. Full instructions on how to do this can be found here:
http://msdn.microsoft.com/en-us/library/ms177429.aspx.
3. Restore the Adventure Works Tabular database to Analysis Services from the
.abf file that can also be found in the Databases directory. Full instructions on how to do this can be found here: http://technet.microsoft.com/en-us/library/ ms174874.aspx.
4. Each chapter has its own directory containing code samples. In many cases this takes the form of a project, which that must be opened in SQL Server Data Tools. Full instructions on how to install SQL Server Data Tools are given in Chapter 2, “Getting Started With the Tabular Model.”
Acknowledgments
Hrvoje Piasevoli, Jeffrey Wang, Jen Stirrup, John Sirmon, John Welch, Kasper de Jonge, Marius Dumitru, Max Uritsky, Paul Sanders, Paul Turley, Rob Collie, Rob Kerr, TK Anand, Teo Lachev, Thierry D’Hers, Thomas Ivarsson, Thomas Kejser, Tomislav Piasevoli, Vidas Matelis, Wayne Robertson, Paul te Braak, Stacia Misner, Javier Guillen, Bobby Henningsen, Toufiq Abrahams, Christo Olivier, Eric Mamet, Cathy Dumas, and Julie Strauss.
Errata & Book Support
We’ve made every effort to ensure the accuracy of this book and its companion con-tent. Any errors that have been reported since this book was published are listed on our Microsoft Press site at oreilly.com:
http://go.microsoft.com/FWLink/?Linkid=254181
If you find an error that is not already listed, you can report it to us through the same page.
If you need additional support, email Microsoft Press Book Support at
Please note that product support for Microsoft software is not offered through the addresses above.
We Want to Hear from You
At Microsoft Press, your satisfaction is our top priority and your feedback our most valuable asset. Please tell us what you think of this book at:
http://www.microsoft.com/learning/booksurvey
The survey is short, and we read every one of your comments and ideas. Thanks in advance for your input!
Stay in Touch
C H A P T E R 1
Introducing the Tabular Model
T
he purpose of this chapter is to introduce Analysis Services 2012, provide a brief overview of what the Tabular model is, and explore its relationship to the Multidimensional model, to Analysis Services 2012 as a whole, and to the wider Microsoft business intelligence (BI) stack. This chapter will also help you make what is probably the most important decision in your project’s life cycle: whether you should use the Tabular model.The Microsoft BI Ecosystem
In the Microsoft ecosystem, BI is not a single product; it’s a set of features distributed across several products, as explained in the following sections.
What Is Analysis Services and Why Should I Use It?
Analysis Services is an online analytical processing (OLAP) database, a type of database that is highly optimized for the kinds of queries and calculations that are common in a business intelligence envi-ronment. It does many of the same things that a relational database can do, but it differs from a rela-tional database in many respects. In most cases, it will be easier to develop your BI solution by using Analysis Services in combination with a relational database such as Microsoft SQL Server than by using SQL Server alone. Analysis Services certainly does not replace the need for a relational database or a properly designed data warehouse.
column that cannot be summed. This, in turn, means that end-user reporting and analysis tools must do much less work and can provide a clearer visual interface for end users to build queries. It also means that different tools can connect to the same model and return consistent results.
Another way of thinking about Analysis Services is as a kind of cache that you can use to speed up reporting. In most scenarios in which Analysis Services is used, it is loaded with a copy of the data in the data warehouse. Subsequently, all reporting and analytic queries are run against Analysis Services rather than against the relational database. Even though modern relational databases are highly optimized and contain many features specifically aimed at BI reporting, Analysis Services is a database specifically designed for this type of workload and can, in most cases, achieve much better query performance. For end users, optimized query performance is extremely important because it allows them to browse through data without waiting a long time for reports to run and without any breaks in their chain of thought.
For the IT department, the biggest benefit of all this is that it becomes possible to transfer the bur -den of authoring reports to the end users. A common problem with BI projects that do not use OLAP is that the IT department must build not only a data warehouse but also a set of reports to go with it. This increases the amount of time and effort involved, and can be a cause of frustration for the busi-ness when it finds that IT is unable to understand its reporting requirements or to respond to them as quickly as is desirable. When an OLAP database such as Analysis Services is used, the IT department can expose the models it contains to the end users and enable them to build reports themselves by using whatever tool with which they feel comfortable. By far the most popular client tool is Microsoft Excel. Ever since Office 2000, Excel PivotTables have been able to connect directly to Analysis Services cubes and Excel 2010 has some extremely powerful capabilities as a client for Analysis Services.
All in all, Analysis Services not only reduces the IT department’s workload but also increases end user satisfaction because users now find they can build the reports they want and explore the data at their own pace without having to go through an intermediary.
A Short history of Analysis Services
The Microsoft BI Stack Today
The successes of Analysis Services would not have been possible if it had not been part of an equally successful wider suite of BI tools that Microsoft has released over the years. Because there are so many of these tools, it is useful to list them and provide a brief description of what each does.
The Microsoft BI stack can be broken up into two main groups: products that are part of the SQL Server suite of tools and products that are part of the Office group. As of SQL Server 2012, the SQL Server BI-related tools include:
■ SQL Server relational database The flagship product of the SQL Server suite and the plat -form for the relational data warehouse. http://www.microsoft.com/sqlserver/en/us/default.aspx
■ SQL Azure The Microsoft cloud-based version of SQL Server, not commonly used for BI pur-poses at the moment, but, as other cloud-based data sources become more common in the future, it will be used more and more. https://www.windowsazure.com/en-us/home/features/ sql-azure
■ Parallel Data Warehouse A highly specialized version of SQL Server, aimed at companies with multiterabyte data warehouses, which can scale out its workload over many physical servers. http://www.microsoft.com/sqlserver/en/us/solutions-technologies/data-warehousing/ pdw.aspx
■ SQL Server Integration Services An extract, transform, and load (ETL) tool for moving data from one place to another. Commonly used to load data into data warehouses. http:// www.microsoft.com/sqlserver/en/us/solutions-technologies/business-intelligence/integration-services.aspx
■ Apache Hadoop The most widely used open-source tool for aggregating and analyzing large amounts of data. Microsoft has decided to support it explicitly in Windows and provide tools to help integrate it with the rest of the Microsoft BI stack. http://www.microsoft.com/ bigdata
■ SQL Server Reporting Services A tool for creating static and semistatic, highly formatted reports and probably the most widely used SQL Server BI tool of them all. http://
www.microsoft.com/sqlserver/en/us/solutions-technologies/business-intelligence/reporting-services.aspx
■ SQL Azure Reporting The cloud-based version of SQL Server Reporting Services, in beta at the time of writing. http://msdn.microsoft.com/en-us/library/windowsazure/gg430130.aspx
■ Power View A powerful new data visualization and analysis tool, available through Microsoft SharePoint, which acts as a front end to Analysis Services. http://www.microsoft.com/sqlserver/ en/us/future-editions/SQL-Server-2012-breakthrough-insight.aspx
■ Master Data Services A tool for managing a consistent set of master data for BI systems.
http://www.microsoft.com/sqlserver/en/us/solutions-technologies/business-intelligence/ master-data-services.aspx
■ Data Quality Services A data quality and cleansing tool. http://msdn.microsoft.com/en-us/
library/ff877917(v=sql.110).aspx
■ PowerPivot A self-service BI tool that enables users to construct their own reporting solu-tions in Excel and publish them in SharePoint. It is very closely related to Analysis Services and will be discussed in greater detail in the following section, “Self-Service BI and Corporate BI.”
BI tools developed by the Office group include:
■ SharePoint 2010 The Microsoft flagship portal and collaboration product. In the view of Microsoft, SharePoint is where all your BI reporting should be surfaced, through Excel and Excel Services, Reporting Services, Power View, or PerformancePoint. It also serves as the hub for sharing PowerPivot models by using PowerPivot for SharePoint.
■ PerformancePoint Services A tool for creating BI dashboards inside SharePoint.
■ Excel 2010 The venerable spreadsheet program and probably the most widely used BI tool in the world, Excel has long been able to connect directly to Analysis Services through pivot tables and cube formulas. Now, with the release of PowerPivot (which is an Excel add-in), it is at the center of the Microsoft self-service BI strategy.
It is also worth mentioning that Microsoft makes various experimental BI tools available on its SQL Azure Labs site (http://www.microsoft.com/en-us/sqlazurelabs/default.aspx), which include the projects code-named “Social Analytics” and “Data Explorer.” In addition, a large number of third-party soft-ware vendors make valuable contributions to the Microsoft BI ecosystem; for example, by building client tools for Analysis Services.
Self-Service BI and Corporate BI
The quickest way to start an argument between two BI professionals is to ask them what they think of self-service BI. On one hand, self-service BI makes BI development extremely business-focused, responsive, and agile. On the other hand, it can amplify the problems associated with the persistence of out-of-date data, poor data quality, lack of integration between multiple source systems, and dif-ferent interpretations of how data should be modeled, especially because self-service BI proponents often claim that the time-consuming step of building a data warehouse is unnecessary. Whatever the advantages and disadvantages of self-service BI, it is a fast-growing market and one that Microsoft, as a software company, could not ignore, so in 2010 it released its own self-service BI tool called PowerPivot.
PowerPivot is essentially a desktop-based version of Analysis Services, but it takes the form of a free-to-download add-in for Excel 2010. (See www.powerpivot.com for more details.) It makes it very easy for Excel power users to import data from a number of sources, build their own models, and then query them using pivot tables. The PowerPivot database runs in-process inside Excel; all the imported data is stored there and all queries from Excel go against it. Excel users can work with vastly greater data volumes than they ever could before if they were storing the data directly inside an Excel worksheet, and they can still get lightning-fast query response times. When the Excel workbook is saved, the PowerPivot database and all the data in it is saved inside the workbook; the workbook can then be copied and shared like any regular Excel workbook, although any other user wishing to query the data held in PowerPivot must also have PowerPivot installed on his or her PC. To share models and reports between groups of users more efficiently, PowerPivot for SharePoint, a service that inte -grates with Microsoft SharePoint 2010 Enterprise edition, is required. With PowerPivot for SharePoint, it becomes possible to upload a workbook containing a PowerPivot database into SharePoint, enabling other users to view the reports in the workbook over the web by using Excel Service or to query the data held in PowerPivot on the server by using Excel or any other Analysis Services client tool on the desktop.
Analysis Services 2012 Architecture: One Product, Two Models
This section explains a little about the architecture of Analysis Services, which in SQL Server 2012 is split into two models.
The first and most important point to make about Analysis Services 2012 is that it is really two products in one. Analysis Services in the SQL Server 2008 R2 release and before is still present, but it is now called the Multidimensional model. It has had a few improvements relating to performance, scalability, and manageability, but there is no new major functionality. Meanwhile, there is a new version of Analysis Services that closely resembles PowerPivot—this is called the Tabular model. The Tabular model is the subject of this book.
When installing Analysis Services, you must choose between installing an instance that runs in Tabular mode and one that runs in Multidimensional mode; more details on the installation process will be given in Chapter 2, “Getting Started with the Tabular Model.” A Tabular instance can sup-port only databases containing Tabular models, and a Multidimensional instance can supsup-port only databases containing Multidimensional models. Although these two parts of Analysis Services share much of the same code underneath, in most respects they can be treated as separate products. The concepts involved in designing the two types of model are very different, and you cannot convert a Tabular database into a Multidimensional database, or vice versa, without rebuilding everything from the beginning. That said, it is important to emphasize the fact that, from an end user’s point of view, the two models do almost the same things and appear almost identical when used through a client tool such as Excel.
The following sections compare the functionality available in the Tabular and Multidimensional models and define some important terms that are used throughout the rest of this book.
The Tabular Model
A database is the highest-level object in the Tabular model and is very similar to the concept of a database in the SQL Server relational database. An instance of Analysis Services can contain many data-bases, and each database can be thought of as a self-contained collection of objects and data relating to a single business solution. If you are writing reports or analyzing data and find that you need to run queries on multiple databases, you have probably made a design mistake somewhere because everything you need should be contained in a single database.
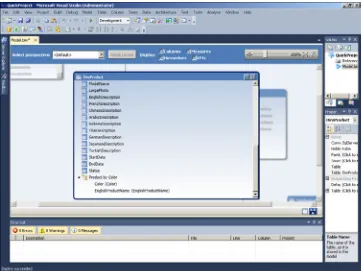
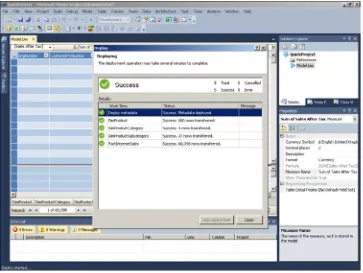
Tabular models are designed by using SQL Server Data Tools (SSDT), and a project in SSDT maps onto a database in Analysis Services. After you have finished designing a project in SSDT, it must be deployed to an instance of Analysis Services, which means SSDT executes a number of commands to create a new database in Analysis Services or alters the structure of an existing database. SQL Server Management Studio (SSMS), a tool that can be used to manage databases that have already been deployed, can also be used to write queries against databases.
number of columns that are defined at design time and can have a variable number of rows, depend -ing on the amount of data that is loaded. Each column has a fixed type, so for example, a s-ingle column could contain only integers, only text, or only decimal values. Loading data into a table is referred to as processing that table.
It is also possible to define relationships between tables at design time. Unlike in SQL, it is not possible to define relationships at query time; all queries must use these preexisting relationships. However, relationships between tables can be marked as active or inactive, and at query time it is possible to choose which relationships between tables are actually used. It is also possible to simulate the effect of relationships that do not exist inside queries and calculations. All relationships are one-to-many relationships and must involve just one column from each of two tables. It is not possible to define relationships that are explicitly one to one or many to many, although it is certainly possible to achieve the same effect by writing queries and calculations in a particular way. It is also not possible to design relationships that are based on more than one column from a table or recursive relation-ships that join a table to itself.
The Tabular model uses a purely memory-based engine and stores only a copy of its data on disk so that no data is lost if the service is restarted. Whereas the Multidimensional model, like most relational database engines, stores its data in a row-based format, the Tabular model uses a column-oriented database called the xVelocity in-memory analytics engine, which in most cases offers signifi -cant query performance improvements. (For more details on the column-based type of database, see
http://en.wikipedia.org/wiki/Column-oriented_DBMS.)
note The xVelocity analytics in-memory engine was known as the Vertipaq engine before the release of Analysis Services 2012. Many references to the Vertipaq name remain in docu mentation, blog posts, and other material online, and it even persists inside the
prod-uct itself in property names and Profiler events. The name xVelocity is also used to refer to
the wider family of related technologies, including the new column store index feature in the SQL Server 2012 relational database engine. For a more detailed explanation of this ter-minology, see http://blogs.msdn.com/b/analysisservices/archive/2012/03/09/xvelocity-and-analysis-services.aspx.
Queries and calculations in Tabular are defined in Data Analysis eXpressions (DAX), the native language of the Tabular model, and in PowerPivot. Client tools such as Power View can generate DAX queries to retrieve data from a Tabular model, or you can write your own DAX queries and use them in reports. It is also possible to write queries by using the MDX language that Multidimensional mod-els use. This means that the Tabular model is backward compatible with the large number of existing Analysis Services client tools that are available from Microsoft, such as Excel and SQL Server Reporting Services, and tools from third-party software vendors.
Derived columns, called calculated columns, can be added to a table in a Tabular model; they use
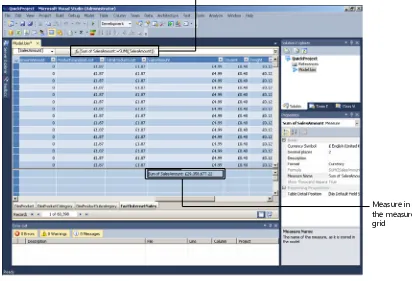
Measures can also be defined on tables by using DAX expressions; a measure can be thought of
as a DAX expression that returns some form of aggregated value based on data from one or more columns. A simple example of a measure is one that returns the sum of all values from a column of data that contains sales volumes. Key performance indicators (KPIs) are very similar to measures, but are collections of calculations that enable you to determine how well a measure is doing relative to a target value and whether it is getting closer to reaching that target over time.
Most front-end tools such as Excel use a PivotTable-like experience for querying Tabular models: Columns from different tables can be dragged onto the rows axis and columns axis of a pivot table so that the distinct values from these columns become the individual rows and columns of the pivot table, and measures display aggregated numeric values inside the table. The overall effect is some-thing like a Group By query in SQL, but the definition of how the data aggregates up is predefined inside the measures and is not necessarily specified inside the query itself. To improve the user experi -ence, it is also possible to define hierarchies on tables inside the Tabular model, which create multi-level, predefined drill paths. Perspectives can hide certain parts of a complex model, which can aid usability, and security roles can be used to deny access to specific rows of data from tables to specific users. Perspectives should not be confused with security, however; even if an object is hidden in a perspective it can still be queried, and perspectives themselves cannot be secured.
The Multidimensional Model
At the highest level, the Multidimensional model is very similar to the Tabular model: Data is orga-nized in databases, and databases are designed in SSDT (formerly BI Development Studio, or BIDS) and managed by using SQL Server Management Studio.
The differences become apparent below the database level, where multidimensional rather than relational concepts are prevalent. In the Multidimensional model, data is modeled as a series of cubes
and dimensions, not tables. Each cube is made up of one or more measure groups, and each measure group in a cube is usually mapped onto a single fact table in the data warehouse. A measure group contains one or more measures, which are very similar to measures in the Tabular model. A cube also has two or more dimensions: one special dimension, the Measures dimension, which contains all the measures from each of the measure groups, and various other dimensions such as Time, Product, Geography, Customer, and so on, which map onto the logical dimensions present in a dimensional model. Each of these non-Measures dimensions consists of one or more attributes (for example, on a Date dimension, there might be attributes such as Date, Month, and Year), and these attributes can themselves be used as single-level hierarchies or to construct multilevel user hierarchies. Hierarchies can then be used to build queries. Users start by analyzing data at a highly aggregated level, such as a Year level on a Time dimension, and can then navigate to lower levels such as Quarter, Month, and Date to look for trends and interesting anomalies.
model also has many features that have not yet been implemented in Tabular. A detailed feature comparison between the two models appears later in this chapter.
In terms of data storage, the Multidimensional model can store its data in three ways:
■ Multidimensional OLAP (MOLAP), where all data is stored inside Analysis Services’ own disk-based storage format.
■ Relational OLAP (ROLAP), where Analysis Services acts purely as a metadata layer and where no data is stored in Analysis Services itself; SQL queries are run against the relational source database when a cube is queried.
■ Hybrid OLAP (HOLAP), which is the same as ROLAP but where some pre-aggregated values are stored in MOLAP.
MOLAP storage is used in the vast majority of implementations, although ROLAP is sometimes used when a requirement for so-called real-time BI HOLAP is almost never used.
One particular area in which the Multidimensional and Tabular models differ is in the query and calculation languages they support. The native language of the Multidimensional model is MDX, and that is the only language used for defining queries and calculations. The MDX language has been suc -cessful and is supported by a large number of third-party client tools for Analysis Services. It was also promoted as a semiopen standard by a cross-vendor industry body called the XMLA Council (now effectively defunct) and, as a result, has also been adopted by many other OLAP tools that are direct competitors to Analysis Services. However, the problem with MDX is the same problem that many people have with the Multidimensional model in general: although it is extremely powerful, many BI professionals have struggled to learn it because the concepts it uses, such as dimensions and hierar-chies, are very different from the ones they are accustomed to using in SQL.
In addition, Microsoft has publicly committed (in this post on the Analysis Services team blog and other public announcements at http://blogs.msdn.com/b/analysisservices/archive/2011/05/16/ analysis-services-vision-amp-roadmap-update.aspx) to support DAX queries on the Multidimensional model at some point after Analysis Services 2012 has been released, possibly as part of a service pack. This will allow Power View to query Multidimensional models and Tabular models, although it is likely that some compromises will have to be made and some Multidimensional features might not work as expected when DAX queries are used.
Why have Two Models?
Why has this split happened? Although Microsoft does not want to make any public comments on this topic, there are a number of likely reasons.
technology to keep up. Retrofitting the new xVelocity in-memory engine into the existing Multidimensional model was not, however, a straightforward job, so it was necessary to intro-duce the new Tabular model to take full advantage of xVelocity.
■ Despite the success of Analysis Services Multidimensional, there has always been a perception that it is difficult to learn. Some database professionals, accustomed to relational data model -ing, struggle to learn multidimensional concepts, and those that do find the learning curve is steep. Therefore, if Microsoft wants to bring BI to an ever-wider audience, it must simplify the development process—hence the move from the complex world of the Multidimensional model to the relatively simple and familiar concepts of the Tabular model.
■ Microsoft sees self-service BI as a huge potential source of growth, and PowerPivot is its entry into this market. It is also important to have consistency between the Microsoft self-service and corporate BI tools. Therefore, if Analysis Services must be overhauled, it makes sense to make it compatible with PowerPivot, with a similar design experience so self-service models can easily be upgraded to full-fledged corporate solutions.
■ Some types of data are more appropriately, or more easily, modeled by using the Tabular approach, and some types of data are more appropriate for a Multidimensional approach. Having different models gives developers the choice to use whichever approach suits their circumstances.
What Is the BI Semantic Model?
One term that has been mentioned a lot in the discussions about Analysis Services 2012 is the
BI Semantic Model or BISM. This term does not refer to either the Multidimensional or Tabular models specifically but, instead, describes the function of Analysis Services in the Microsoft BI stack: the fact that it acts as a semantic layer on top of a relational data warehouse, adding a rich layer of metadata that includes hierarchies, measures, and calculations. In that respect, it is very similar to the term Unified Dimensional Model that was used around the time of the SQL Server 2005 launch. In some cases, the term BI Semantic Model has referred to the Tabular model only, but this is not correct. Because this book is specifically concerned with the Tabular model, we will not be using this term very often; nevertheless, we believe it is important to understand exactly what it means and how it should be used.
The Future of Analysis Services
Microsoft has been very clear in saying that the Multidimensional model is not deprecated and that the Tabular model is not its replacement. It is likely that new features for Multidimensional will be released in future versions of Analysis Services. The fact that the Tabular and Multidimensional mod-els share some of the same code suggests that some new features could easily be developed for both models simultaneously. The post on the Analysis Services blog previously referenced suggests that in time the two models will converge and offer much the same functionality, so the decision about which model to use is based on whether the developer prefers to use a multidimensional or relational way of modeling data. Support for DAX queries in the Multidimensional model, when it arrives, will represent one step in this direction.
One other thing is clear about the future of Analysis Services: It will be moving to the cloud. Although no details are publicly available at the time of writing, Microsoft has confirmed it is working on a cloud-based version of Analysis Services and this, plus SQL Azure, SQL Azure Reporting Services, and Office 365, will form the core of the Microsoft cloud BI strategy.
Choosing the Right Model for Your Project
It might seem strange to be addressing the question of whether the Tabular model is appropriate for your project at this point in the book, before you have learned anything about the Tabular model, but you must answer this question at an equally early stage of your BI project. At a rough guess, either model will work equally well for about 60 percent to 70 percent of projects, but for the remaining 30 percent to 40 percent, the correct choice of model will be vital.
As has already been stated, after you have started developing with one model in Analysis Services, there is no way of switching over to use the other; you have to start all over again from the begin -ning, possibly wasting much precious development time, so it is very important to make the correct decision as soon as possible. Many factors must be taken into account when making this decision. In this section we discuss all of them in a reasonable amount of detail. You can then bear these factors in mind as you read the rest of this book, and when you have finished it, you will be in a position to know whether to use the Tabular model or the Multidimensional model.
Licensing
SQL Server Enterprise edition on a server-plus-CALs basis as was possible in the past.) In SQL Server Business Intelligence and SQL Server Enterprise editions, both Tabular and Multidimensional models contain all available features and can use as many cores as the operating system makes available.
The upshot of this is that it could be more expensive in some situations to use Tabular than Multidimensional because Multidimensional is available in SQL Server Standard edition and Tabular is not. If you have a limited budget, already have existing Multidimensional skills, or are willing to learn them, and your data volumes mean that you do not need to use Multidimensional features such as partitioning, it might make sense to use Multidimensional and SQL Server Standard edition to save money. If you are willing to pay slightly more for SQL Server Business Intelligence edition or SQL Server Enterprise edition, however, then licensing costs should not be a consideration in your choice of model.
Upgrading from previous Versions of Analysis Services
As has already been mentioned, there is no easy way of turning a Multidimensional model into a Tabular model. Tools undoubtedly will appear on the market that claim to make this transition with a few mouse clicks, but such tools could only ever work for very simple Multidimensional models and would not save much development time. Therefore, if you already have a mature Multidimensional implementation and the skills in house to develop and maintain it, it probably makes no sense to abandon it and move over to Tabular unless you have specific problems with Multidimensional that Tabular is likely to solve.
ease of Use
In contrast, if you are starting an Analysis Services 2012 project with no previous Multidimensional or OLAP experience, it is very likely that you will find Tabular much easier to learn than Multidimensional. Not only are the concepts much easier to understand, especially if you are used to working with relational databases, but the development process is also much more straightforward and there are far fewer features to learn. Building your first Tabular model is much quicker and easier than building your first Multidimensional model. It can also be argued that DAX is easier to learn than MDX, at least when it comes to writing basic calculations, but the truth is that both MDX and DAX can be equally confusing for anyone used to SQL.
Compatibility with powerpivot
Query performance Characteristics
Although it would be dangerous to make sweeping generalizations about query performance, it’s fair to say that Tabular will perform at least as well as Multidimensional in most cases and will out-perform it in some specific scenarios. Distinct count measures, which are a particular weakness of the Multidimensional model, perform extremely well in Tabular, for instance. Anecdotal evidence also suggests that queries for detail-level reports (for example, queries that return a large number of rows and return data at a granularity close to that of the fact table) will perform much better on Tabular as long as they are written in DAX and not MDX. When more complex calculations or modeling techniques such as many-to-many relationships are involved, it is much more difficult to say whether Multidimensional or Tabular will perform better, unfortunately, and a proper proof of concept will be the only way to tell whether the performance of either model will meet requirements.
processing performance Characteristics
Comparing the processing performance of Multidimensional and Tabular is also difficult. It might be a lot slower to process a large table in Tabular than the equivalent measure group in Multidimensional because Tabular cannot process partitions in the same table in parallel, whereas Multidimensional (assuming you are using SQL Server Business Intelligence or SQL Server Enterprise edition and are partitioning your measure groups) can process partitions in the same measure group in parallel. Disregarding the different, noncomparable operations that each model performs when it performs processing, such as building aggregations and indexes in the Multidimensional model, the number of rows of raw data that can be processed per second for a single partition is likely to be similar.
However, Tabular has some significant advantages over Multidimensional when it comes to pro -cessing. First, there are no aggregations in the Tabular model, and this means that there is one less time-consuming task to be performed at processing time. Second, processing one table in a Tabular model has no direct impact on any of the other tables in the model, whereas in the Multidimensional model, processing a dimension has consequential effects. Doing a full process on a dimension in the Multidimensional model means that you must do a full process on any cubes that dimension is used in, and even doing a process update on a dimension requires a process index on a cube to rebuild aggregations. Both of these can cause major headaches on large Multidimensional deployments, especially when the window available for processing is small.
hardware Considerations
Multidimensional’s disk requirements will probably be easier to accommodate than Tabular’s mem-ory requirements. Buying a large amount of disk storage for a server is relatively cheap and straight-forward for an IT department; many organizations have storage area networks (SANs) that, though they might not perform as well as they should, make providing enough storage space (or increasing that provision) very simple. However, buying large amounts of RAM for a server can be more difficult— you might find that asking for half a terabyte of RAM on a server raises some eyebrows—and if you find you need more RAM than you originally thought, increasing the amount that is available can also be awkward. Based on experience, it is easy to start with what seems like a reasonable amount of RAM and then find that, as fact tables grow, new data is added to the model, and queries become more complex, you start to encounter out-of-memory errors. Furthermore, for some extremely large Analysis Services implementations with several terabytes of data, it might not be possible to buy a server with sufficient RAM to store the model, so Multidimensional might be the only feasible option.
Real-Time BI
Although not quite the industry buzzword that it was a few years ago, the requirement for real-time or near-real-time data in BI projects is becoming more common. Real-time BI usually refers to the need for end users to be able to query and analyze data as soon as it has been loaded into the data warehouse, with no lengthy waits for the data to be loaded into Analysis Services.
The Multidimensional model can handle this in one of two ways: Either use MOLAP storage and partition your data so that all the new data in your data warehouse goes to one relatively small partition that can be processed quickly, or use ROLAP storage and turn off all caching so that Multidimensional issues SQL queries every time it is queried. The first of these options is usually pre -ferred, although it can be difficult to implement, especially if dimension tables and fact tables change. Updating the data in a dimension can be slow and can also require aggregations to be rebuilt. ROLAP storage in Multidimensional can often result in very poor query performance if data volumes are large, so the time taken to run a query in ROLAP mode might be greater than the time taken to reprocess the MOLAP partition in the first option.
with very simple DAX calculations can be used. A full description of how to configure DirectQuery mode is given in Chapter 9, “Understanding xVelocity and DirectQuery.”
Client Tools
In many cases, the success or failure of a BI project depends on the quality of the tools that end users use to analyze the data being provided. Therefore, the question of which client tools are supported by which model is an important one.
Both the Tabular model and the Multidimensional model support MDX queries, so, in theory, most Analysis Services client tools should support both models. However, in practice, although some client tools such as Excel and SQL Server Reporting Services do work equally well on both, some third-party client tools might need to be updated to their latest versions to work, and some older tools that are still in use but are no longer supported might not work properly or at all.
At the time of writing, only the Tabular model supports DAX queries, although support for DAX queries in the Multidimensional model is promised at some point in the future. This means that, at least initially, Power View—the new, highly regarded Microsoft data visualization tool—will work only on Tabular models. Even when DAX support in Multidimensional models is released, it is likely that not all Power View functionality will work on it and, similarly, that not all Multidimensional functional-ity will work as expected when queried by using DAX.
Feature Comparison
One more thing to consider when choosing a model is the functionality present in the Multidimensional model that either has no equivalent or is only partially implemented in the Tabular model. Not all of this functionality is important for all projects, however, and it must be said that in many scenarios it is possible to approximate some of this Multidimensional functionality in Tabular by using some clever DAX in calculated columns and measures. In any case, if you do not have any previous experience using Multidimensional, you will not miss functionality you have never had.
Here is a list of the most important functionality missing in Tabular:
■ Writeback, the ability for an end user to write values back to a Multidimensional database. This can be very important for financial applications in which users enter budget figures, for example.
■ Translations, in which the metadata of a Multidimensional model can appear in different languages for users with different locales on their desktops. There is no way of implementing this in Tabular.
■ Dimension security on measures, in which access to a single measure can be granted or denied.
■ Ragged hierarchies, a commonly used technique for avoiding the use of a parent/child hierarchy. In a Multidimensional model, a user hierarchy can be made to look something like a parent/child hierarchy by hiding members if certain conditions are met; for example, if a mem -ber has the same name as its parent. This is known as creating a ragged hierarchy. Nothing equivalent is available in the Tabular model.
■ Role-playing dimensions, designed and processed once, then appear many times in the same model with different names and different relationships to measure groups; in the Multidimensional model, this is known as using role-playing dimensions. Something similar is possible in the Tabular model, by which multiple relationships can be created between two tables (see Chapter 3, “Loading Data Inside Tabular,” for more details on this), and although this is extremely useful functionality, it does not do exactly the same thing as a role-playing dimension. In Tabular, if you want to see the same table in two places in the model simultane-ously, you must load it twice, and this can increase processing times and make maintenance more difficult.
■ Scoped assignments and unary operators, advanced calculation functionality, is present in MDX in the Multidimensional model but is not possible or at least not easy to re-create in DAX in the Tabular model. These types of calculation are often used in financial applications, so this and the lack of writeback and true parent/child hierarchy support mean that the Tabular model is not suited for this class of application.
The following functionality can be said to be only partially supported in Tabular:
■ Parent/child hierarchy support in Multidimensional is a special type of hierarchy built from a dimension table with a self-join on it by which each row in the table represents one member in the hierarchy and has a link to another row that represents the member’s parent in the hier-archy. Parent/child hierarchies have many limitations in Multidimensional and can cause query performance problems. Nevertheless, they are very useful for modeling hierarchies such as company organization structures because the developer does not need to know the maximum depth of the hierarchy at design time. The Tabular model implements similar functionality by using DAX functions such as PATH (see Chapter 9 for details), but, crucially, the developer must decide what the maximum depth of the hierarchy will be at design time.
■ Support for many-to-many relationships in the Multidimensional model is one of its most important features, and it is frequently used. (For some applications, see the white paper at