60
Lampiran 1
Daftar Bank Umum Syariah yang Memenuhi Kriteria
No. Nama Perusahaan
61
Lampiran 2
Rasio Keuangan Bank Umum Syariah
63
Lampiran 3
Statistik Deskriptif
Descriptive Statistics
N Minimum Maximum Mean Std. Deviation
CAR 20 9.40 45.45 16.5705 8.69330
NPF 20 1.50 7.00 3.5430 1.31099
BOPO 20 5.01 215.58 88.3990 41.56790
FDR 20 68.92 184.37 92.4295 24.50588
NRM 20 5.00 15.49 7.8255 3.14302
ROA 20 -3.60 2.60 .9290 1.54628
64
Lampiran 4
65
Std. Deviation .67543
Most Extreme
Differences
Absolute .111
Positive .076
Negative -.111
Kolmogorov-Smirnov Z .496
Asymp. Sig. (2-tailed) .966
a. Test distribution is Normal.
66
Lampiran 5
67
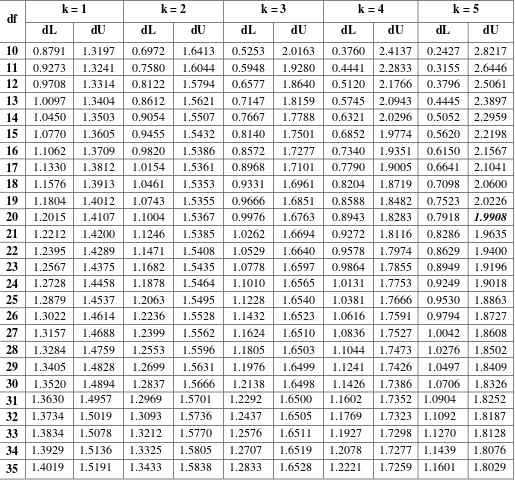
Lampiran 6
Hasil Uji Autokorelasi
Model Summaryb
Model R R Square
Adjusted R
Square
Std. Error of the
Estimate Durbin-Watson
1 .900a .809 .741 .78686 1.997
68
Lampiran 7
Hasil Uji Multikolinearitas
Coefficientsa
Model
Collinearity Statistics
Tolerance VIF
1 (Constant)
CAR .430 2.324
NPF .642 1.558
BOPO .366 2.732
FDR .456 2.191
NRM .910 1.099
69
Lampiran 8
Hasil Uji Koefisien Determinasi
Model Summaryb
Model R R Square
Adjusted R
Square
Std. Error of the
Estimate
1 .900a .809 .741 .78686
a. Predictors: (Constant), NRM, NPF, CAR, FDR, BOPO
70
Lampiran 9
Hasil Uji Parsial (Uji t)
Coefficientsa
71
Lampiran 10
Hasil Uji Simultan (Uji F)
ANOVAb
Model Sum of
Squares Df
Mean
Square F Sig.
1 Regression 36.761 5 7.352 11.875 .000a
Residual 8.668 14 .619
Total 45.429 19
a. Predictors: (Constant), NRM, NPF, CAR, FDR, BOPO
72
Lampiran 11
Titik Persentase Distribusi t
73
Lampiran 12
Titik Persentase Distribusi F
α = 0,05
df untuk penyebut
(N2)
df untuk pembilang (N1)