© Blackwell Publishing Ltd. , Garsington Road, Oxford OX DQ , UK and © Blackwell Publishing Ltd. August
Education and Social Policy in Central Asia:
The Next Stage of the Transition
Kathryn H. Anderson and Stephen P. Heyneman
Abstract
This paper discusses the challenges facing the education system of Central Asia and evaluates how these have been addressed in the market economy. We first review the evidence on the economic return to education and determine how the rewards to different levels of education changed during the transition. We then examine the trends in school enrolment and evaluate whether changes in supply or demand explain the enrolment trends we observe. Finally, we evaluate the efficiency of the delivery of education and whether market forces have improved the management of schools. We conclude with a summary of the economic and policy lessons derived thus far from the educational transition. The paper uses aggregate administrative data supplemented with survey data, primarily from the Kyrgyz Republic and Kazakhstan, on enrolment, completion, and expenditures.
Keywords
Education; Social policy; Market forces; Central Asia
Introduction
The five Central Asian nations were more isolated and impoverished than many of the other republics in the former Soviet Union, but in educational opportunity was parallel. There was full attendance in elementary and secondary education. As defined by UNESCO,1 adult literacy was
universal. Post-secondary female enrolment was greater than per cent (Heyneman : ).
The emergence of the five Central Asia nations as free and independent countries led to challenges of many kinds. Among the most underestimated were the challenges of reforming education. Education had suddenly to meet the new demands of ethnic nationalism, a globally competitive economy, and a labour market freed from administrative control. While education in Central Asia had once been effective and, with respect to science and mathematics, excellent, it had acquired this reputation in a highly constrained
© Blackwell Publishing Ltd. economic and political Soviet environment. As was true with health, social security, unemployment, agriculture and environmental policy, once that environment shifted, education in Central Asia had to adjust. What have been these adjustments in education policy? Where do the countries of Central Asia lie with respect to reforms in other parts of the former Soviet Union?
From the beginning of the transition, the education adjustments required were fairly clear. Elementary education had to learn to reinforce social stability in an environment where historical origins of ethnic nationalism required legitimacy, yet tolerance. The family’s freedom to choose educational philosophy and to invest in the educational process had to be balanced with new pressures on social equality. Curriculum content had to adjust to new subjects and to new teaching and learning emphases driven by pedagogical theories previously considered threatening.2 New textbooks and materials
needed to be authored. The state had to adjust to modern methods of competitive procurement from private providers. Examinations had to be modernized so that the public could monitor the quality of the system over time, and so that candidates for post-secondary educational institutions could be treated fairly and efficiently. Overly specialized teacher licensing standards which reinforced inefficient pupil/teacher ratios had to be reformed to accommodate newly certified, flexible teachers. Languages of instruction had to be changed, and in certain cases (Uzbekistan and Turkmenistan) both the language and the script had to change, requiring all new materials and a completely retrained professional cadre. Vocational education had to be shifted away from state-owned industries (which could no longer afford them) to Ministry of Education control; the vocational curriculum had to be based on labour market demand and to incorporate evidence of that demand from labour market studies of wages and salaries rather than the techniques of manpower forecasting (Heyneman , a, , ).
The challenges in higher education were similarly profound and might be divided into four basic categories (Heyneman ). First were the structural changes. Under the former Soviet Union higher education was treated as vocational in purpose. Fewer than per cent of the higher education institutions were universities with full curricular offerings. Some per cent of the institutions were situated within the sectoral ministries of agriculture, industry, health and the like. No industrialized democracy with a free labour market organizes higher education within sector ministries. Universities have to be able to shift disciplinary priorities in response to labour market demand, and these include priorities across the sectors. Thus the first challenge has been for countries in Central Asia to shift ministerial owner-ship of their universities away from sectoral ministries to the Ministry of Education, where they can respond to demand flexibly.
© Blackwell Publishing Ltd. uninformed by new research experience. There was a prohibition against private education. The mechanisms for promotion were in the hands of full professors and hence were highly personalized and intellectually biased.
The third challenge concerned the nature of what was taught. Religion, socio-logy, economics, political science, journalism and business management were either unknown, tolerated but with suspicion, or treated as political heresy. The last challenge had to do with finance, property and taxation. Under the Soviet Union, the sources of higher education finance were solely from the state. However, with the decline in expenditures, universities needed to seek their own sources of finance. They also had to solve two unique post-Soviet problems: the lack of clarity as to the ownership of their property and the ambiguity and inconsistency by which they were treated by tax authorities. All of these challenges were clear in .
In the remaining sections of this paper we evaluate how these changes and challenges to the education system of Central Asia were addressed in the market economy. We first review the evidence on the economic return to education and determine how the rewards to different levels of education changed during the transition. We then examine the trends in school enrolment and evaluate whether changes in supply or demand explain the enrolment trends we observe. Finally, we evaluate the efficiency of the delivery of education and whether market forces have improved the management of schools. We conclude with a summary of the economic and policy lessons derived thus far from the educational transition.
Returns to Education
As discussed by Falkingham (this volume), independence in the Central Asian economies brought a – year period of economic instability. Recently, growth has been positive in all five countries, but relative real GDP has only reached the level in Uzbekistan. From the most recent data, performance in Kyrgyzstan and Tajikistan significantly lags behind economic performance in Kazakhstan and Uzbekistan. The picture of regional development suggests widening cross-country inequality in economic development. The fall in output has also been accompanied by widening inequality within countries (see Falkingham, this volume), suggesting that an increasing number of households in the country are relatively poor and not benefiting from economic recovery. These economic changes along with changes in education policy over the s and into the twenty-first century affected public and private investment decisions and the payoff to education invest-ment. In this section, we examine how the return to education changed over the transition decade.3
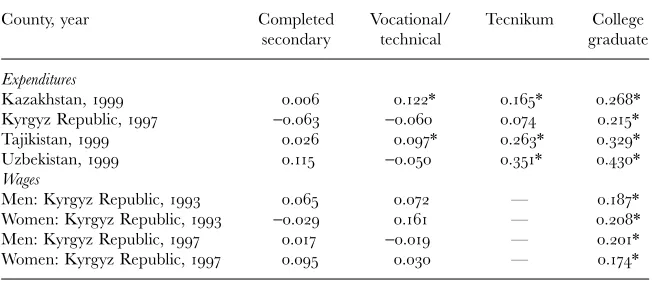
Anderson and Pomfret (, ) estimated the private rate of return to education in four of the five countries of Central Asia using survey data on household expenditures to approximate household income and on the wages of adult workers in the formal sector of the labour market.4 For Kazakhstan,
© Blackwell Publishing Ltd. monthly wages.5 The returns estimated from earnings functions assume that
the opportunity cost of education is the only cost of schooling. This assump-tion is credible when there are no tuiassump-tion charges, fees, or costs of textbooks and supplies, as in the pre-independence period. However, over time, the direct costs of education have become increasingly important. The return estimates for the post-independence period are upward biased because these costs are not taken into account. Given this caveat, the estimates in table give some information on which types of schooling were most valued in the labour market of the s. These returns are all relative to the earnings of persons with only incomplete secondary or primary education.
In all countries and years, completing secondary education did not produce higher expenditures or monthly earnings over incomplete secondary or primary education. Vocational/technical education increased expenditures in Kazakhstan () and Tajikistan () but had no impact on expenditures or wages in the Kyrgyz Republic or Uzbekistan. Skilled, general education did yield significant expenditure and wage returns in each country. Per capita expenditures were – per cent higher when the household head had completed Tecnikum (specialized technical post-secondary school) education and – per cent higher when the head was a university graduate, both in comparison to incomplete secondary education. The annual return to college education was – per cent. In the Kyrgyz Republic, only higher education paid off in higher wages, and the returns were similar for men and women in and . In comparison to incomplete secondary or primary schooling, wages were – per cent higher if the worker had a college degree. This represented a return to each year of higher education of – per cent.
The pattern of returns over time is explained by the changes in the labour market after independence. Many state enterprises could not operate at the same production level when they had to compete in the open market.
Table
© Blackwell Publishing Ltd. Vocational training was in less demand in these firms, and the return to vocational training collapsed. However, as state firms were replaced with private firms, market competition rewarded those workers who had general entrepreneurial and analytical skills. In addition, because knowledge of how to operate in a competitive economy was low in general, workers who acquired this knowledge were in demand. Persons with higher education were rewarded with higher wages, and returns to these education invest-ments were positive. The pattern of returns to different levels of education in the region is also consistent with changes in school enrolment rates. The enrolment trends are summarized in the next section.
Education Enrolment, –
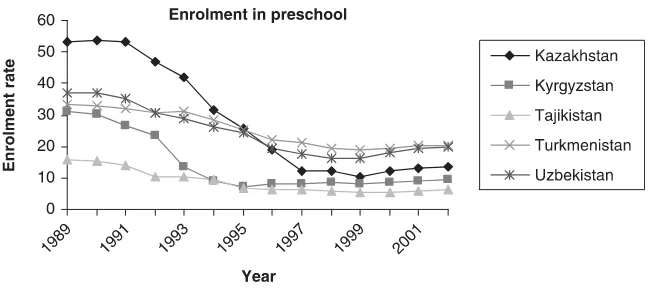
Enrolment in school was affected by economic change and education policy. In figure we present data on enrolment in preschool. For all countries, preschool enrolment dropped significantly from to and stabilized at this low rate. The largest change was in Kazakhstan where the rate dropped from per cent in to per cent in , and there has been no increase in preschool enrolment in recent years. The same enrolment pattern is found in the other four countries. Official statistics indicate that girls were disproportionately withdrawn from preschool relative to boys, especially in Tajikistan (Silova and Magno ). Preschool education was provided primarily by industry under the Soviet Union. After independence, many state-owned enterprises were privatized, and most of them closed their preschool facilities. Preschool became more expensive and less convenient to parents; enrolment declined because of the decline in supply and the increase in cost.
Figure
Trends in preschool enrolment, ‒
© Blackwell Publishing Ltd. Education is mandatory through grade or , and enrolment in basic education is high in each country. Official statistics indicate a decline in basic enrolment in Tajikistan and Turkmenistan but an increase in enrolment in the other countries. Changes in basic enrolment occurred equally for boys and girls (Silova and Magno ). At the upper secondary level, however, a significant drop in enrolment is indicated in official statistics. Girls dispropor-tionately withdrew from secondary school relative to boys in Tajikistan and Uzbekistan. In the other countries, the enrolment of girls was equal to or greater than that of boys (Silova and Magno ).
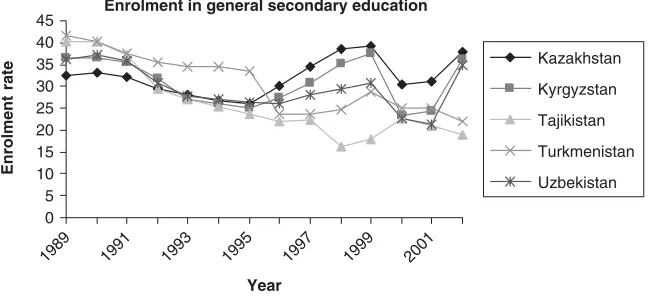
Upper secondary education is in the form of general secondary or vocational/technical training. Overall enrolment in post-compulsory educa-tion fell from – per cent in to – per cent in and there were declines in both general secondary and vocational education. Figure presents data on enrolment in general secondary education. In , before independence, enrolment at the general secondary level ranged from a low of per cent in Kazakhstan to a high of per cent in Tajikistan and Turkmenistan. Enrolment declined sharply in all countries following independence, bottomed out by in all countries except Tajikistan, and peaked in . After there was another sharp decline in general secondary enrolment, with Kazakhstan reporting per cent and the other countries reporting – per cent. Only in Kazakhstan was the general secondary enrolment rate in comparable to the pre-independence rate; in all other countries it was significantly lower.
Figure presents the enrolment pattern for vocational education. Enrol-ment dropped dramatically in all countries after independence. The decline continued through . Enrolment increased slightly in in Kazakhstan,
Figure
Trends in general secondary enrolment, ‒
© Blackwell Publishing Ltd. but the rate remained significantly below the level. No other country has recorded a recent increase in vocational enrolment.
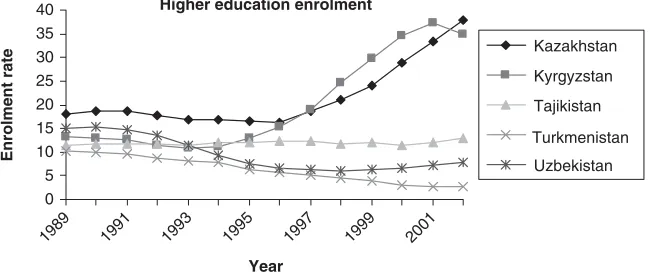
Finally, figure presents data on higher education enrolment. Enrolment initially declined in all countries except Tajikistan. In Kazakhstan and the Kyrgyz Republic, this trend was reversed, and since both countries have reported dramatic increases in higher education enrolment. There has been no change in enrolment in Tajikistan over time, and enrolment in Uzbekistan
Figure
Trends in enrolment in vocational education, ‒
Source: UNICEF-IRC, TransMonee, .
Source: UNICEF-IRC, TransMonee, . Figure
© Blackwell Publishing Ltd. increased slightly in . In Kyrgyzstan and Kazakhstan, girls enrol in higher education at a significantly higher rate than boys; in Tajikistan the enrolment of boys exceeds the enrolment of girls. There are no data on enrolment by gender for Uzbekistan and Turkmenistan (Silova and Magno ).
Supply of Schools
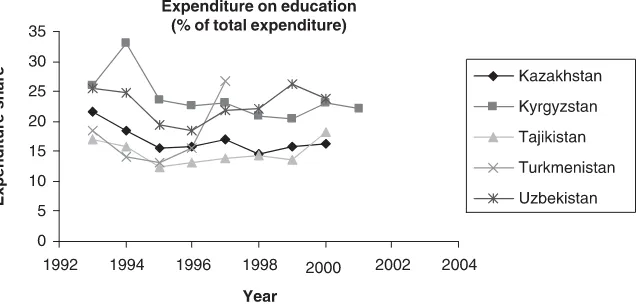
The changes in enrolment described above are associated with both demand and supply factors. On the supply side, enrolment is correlated with the change in public expenditure on education, availability of institutions at the preschool level, for Kazakhstan availability at the secondary school level, and availability at the higher education level. Figure presents data on public expenditures on education as a percentage of GDP and illustrates the recent decline in public commitment to education. In the Kyrgyz Republic, expenditure dropped from to per cent of GDP between and . In Kazakhstan, expenditure dropped slightly after . Turkmenistan and Uzbekistan show a U-shaped expenditure profile over time: falling expendi-ture until – and rising thereafter. Tajikistan recorded little change over the period after but had the lowest public commitment to education at about per cent of GDP. In contrast, expenditures on defence rose over the period in most countries (see the Appendix). A similar picture is seen from data on expenditures on education relative to total government expenditures in figure .
The decline in public expenditure on education led to a reallocation of resources within the education budget of local and republican governments.
Figure
Public expenditure on education ( percentage of GDP)
© Blackwell Publishing Ltd. In Kazakhstan, over per cent of the budget was allocated to teacher salaries and utilities in . Only per cent was allocated to equipment and furnishings and per cent to repairs and rehabilitation. School construction stopped, and space availability became a problem, particularly in urban centres. One-third of schools dealt with overcrowding by offering two or three shifts per day (World Bank ). In the Kyrgyz Republic, only per cent of primary schools had a single shift; per cent of urban schools operated triple shifts (World Bank ).
Education resources were also reallocated among different types of educa-tion. In Kazakhstan, the share of public expenditure on primary and secondary education increased from . per cent in to . per cent in . The share spent on higher education also increased, but the change was more modest—from . per cent in to . per cent in . These increases were at the expense of other levels of education. Preschool funding declined from . to . per cent; vocational school funding decreased from . to . per cent; funding for education at other institutions declined from . to . per cent. These changes were consistent with rate of return estimates suggesting higher payoff to general training and no return to vocational or technical training ( World Bank ).
Education expenditures were reallocated from the republican budget to the local budget.6 By , in Kazakhstan, all expenditure on preschool and
vocational education was determined at the local level, and over per cent of expenditure on primary and secondary education was managed locally. The share of local government expenditures in total public expenditures on education increased from per cent in to per cent in (World Bank ). In the Kyrgyz Republic, education accounted for almost half of
Figure
Public expenditure on education ( percentage of total expenditure)
© Blackwell Publishing Ltd. the local budget in and (World Bank ). In comparison, the percentage of education policy decisions made at the local level is in the
UK, in Germany, and in Hungary (OECD ).
The change in administration of education from the central government to the local government was the result of a change in policy towards decentralization of education financing. However, local expenditures depend on revenues transferred from the central government. Local government revenue is primarily distributed from republican government tax revenue; a small share of local revenue is generated from local sources such as fees and fines. Conditional grants for education, based on population size, are provided by the republican government to the local governments. This lack of “financial autonomy” at the local level impedes the successful administration of local services, including education. Since the share of government revenue going to the central government relative to local governments increased, while the management of local services such as education was transferred from the central government to the local areas (Meurs ).
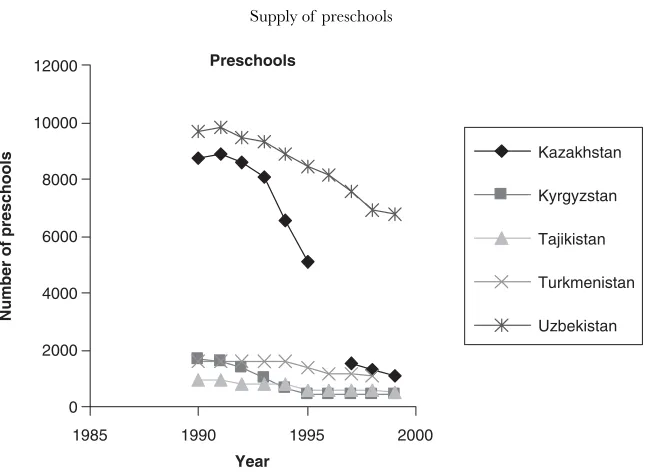
Figures , , and present data on the number of institutions at the preschool, comprehensive secondary, and higher education levels. The decline in preschools is the most dramatic. In Kazakhstan, the number of preschools fell by per cent from , in to , in ; this was the largest
Figure
Supply of preschools
© Blackwell Publishing Ltd. change reported in the region. The decline in preschool availability was per cent in the Kyrgyz Republic, per cent in Tajikistan, per cent in Turkmenistan, and per cent in Uzbekistan. Preschools in state-owned enterprises were closed when these industries were privatized, and the state did not compensate communities for the loss of preschools. In all countries, poor communities experienced the largest decline in preschool availability (Vandyke ).
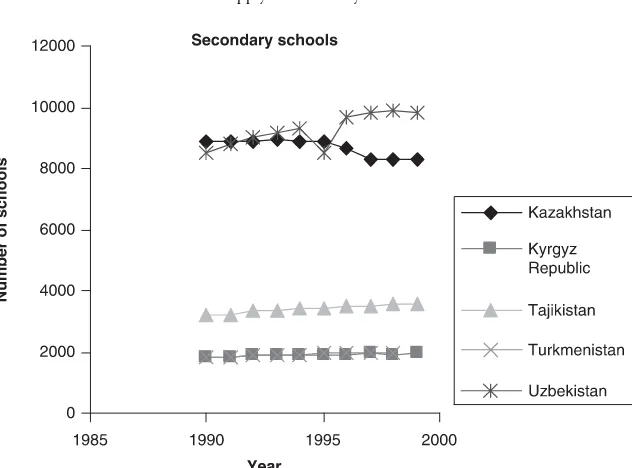
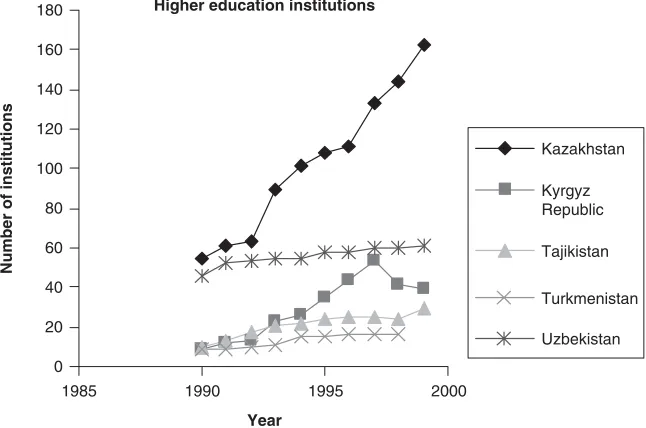
At the comprehensive secondary level, only Kazakhstan reported a drop in the number of schools between and —from , to ,, a decline of about per cent (figure ). In each of the other countries, the number of secondary schools increased and was higher in than in . The decline in secondary enrolment is not explained by decline in the supply of schools. At the higher education level, all countries reported large increases in educational institutions as private education expanded (figure ). Kazakhstan increased its supply of higher education institutions from in to in , a per cent increase. The slowest growth in supply was in Uzbekistan and Turkmenistan. These changes in supply are consistent with the increase in higher education enrolment in Kazakhstan and the Kyrgyz Republic and the small change in enrolment in Uzbekistan.
Figure
Supply of secondary schools
© Blackwell Publishing Ltd. We get a similar picture of access to education from survey data from the Kyrgyz Republic, –. The data are from three household surveys: the autumn Kyrgyzstan Poverty Monitoring Survey and the and Kyrgyzstan Living Standards Measurement Surveys. The surveys contain modules of questions at the community, household and individual levels.7 We examine the change in education access in the communities
represented in the surveys. Results for and are obtained from Anderson et al. (). In , per cent of communities reported a kindergarten or preschool. Access dropped to per cent in and per cent in . The largest decline occurred in poor, rural communities.
At the secondary level, we find no evidence of a decline in access to schools between and ; per cent of communities in and per cent in reported a secondary school near their community. We do find a significant drop in secondary schools in communities in , however, with only per cent reporting access to secondary schools. In both and , we find a large decline in availability of gymnasiums. In , some per cent of communities reported a gymnasium in the community; this fell to per cent in and per cent in .
Community representatives were asked whether the schools had improved; only – per cent thought that they had. While about per cent thought
Figure
Supply of higher education institutions
© Blackwell Publishing Ltd. that there were enough teachers in the local schools, there was a large decline in the percentage who thought that the quality of teaching was good; per cent were satisfied with teaching quality in , but only per cent in .
Community respondents were generally satisfied with school facilities: buildings, blackboards and furniture. About per cent in each year were satisfied with the heating systems in their schools. However, there were significant declines in satisfaction with books and other school supplies. Only per cent thought that the schools had adequate supplies of books
in , and this fell to per cent in . Some per cent were
satisfied with other supplies in and per cent in . The results on books, supplies and teaching quality suggest that the quality of education in local communities experienced significant decline over the decade of the s.
Demand for Schools
On the demand side, education decisions of households responded to price changes and income shocks. At all levels of education, fees increased, and costs of supplies were passed on to students. We do not have data for each country on education expenditures. We do have survey information from the Kyrgyz Republic and can measure the expenditure change at three points in time—, and .
Preschool
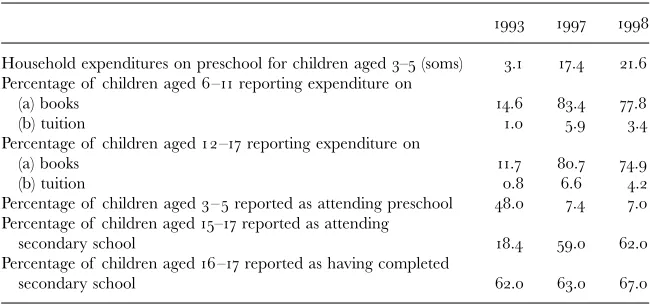
At the preschool level, expenditures by households on education among children aged – increased dramatically over the period from soms per child in to soms in and soms in for children enrolled in preschool (table ). Expenditures rose sixfold over the five-year period. Associated with this increase in private expenditures was the decline in preschool attendance. In , per cent of children aged – attended preschool; this dropped to per cent in and . The preschool provider also changed over the period. In , per cent of children attended preschool provided by a parent’s employer and per cent attended public preschool. By , only per cent of children in preschool attended at a parent’s employer while per cent attended public preschools. Over time, preschool facilities became less available through the private sector and were less convenient and more expensive.
General secondary school
© Blackwell Publishing Ltd. not as dramatic as for secondary school attendance. In , per cent of children in this age group completed secondary school; by the figure was per cent.
Expenditures on secondary education increased over the – period. Table shows the percentage of children who had tuition and book expenses during each year. Among children aged – and –, expenses on tuition and books increased dramatically. For children –, the percent-age reporting tuition expenses increased from per cent in to . per cent in , and the percentage reporting expenses on books increased from in to in . For children aged –, the same pattern emerges. The percentage reporting tuition expenses increased from in to in , and the percentage reporting book expenses increased from in to in . In urban areas of the country, parental contributions to education are often more than $ a year; contributions from parents in rural areas are smaller because of the lower income and higher incidence of poverty. This increasing reliance on parental contributions exacerbates already existing regional disparities in the quality of education (World Bank ).
Higher education
Because higher education was artificially constrained under state socialism,8
the demand for university training increased dramatically. In the Kyrgyz Republic, – per cent of those aged – were enrolled in higher
Table
Aspects of household demand for education, Kyrgyz Republic, –
Household expenditures on preschool for children aged – (soms) . . . Percentage of children aged – reporting expenditure on
(a) books . . .
(b) tuition . . .
Percentage of children aged – reporting expenditure on
(a) books . . .
(b) tuition . . .
Percentage of children aged – reported as attending preschool . . . Percentage of children aged – reported as attending
secondary school . . .
Percentage of children aged – reported as having completed
secondary school . . .
© Blackwell Publishing Ltd. education in and . The decline in public resources for education led to an increase in the share of higher education costs financed by students. In Kazakhstan, the share of students paying fees increased from per cent in to per cent in . The average fee in was $, at universities (World Bank ). In the Kyrgyz Republic, few students paid college tuition in the early s; by –, – per cent paid tuition, and the average yearly tuition payment rose from , soms in to , soms in .
Moreover, the demand for certain fields of study came to be based on an individual’s expected rates of return instead of the occupational quotas and state planning documents. Demand for outdated fields of engineering declined; demand to study sociology, business administration, English language, and journalism increased. Despite this active market, however, central ministries continued to attempt to control syllabi, accreditation, prices, faculty remunera-tion, the allocation of student places, and other important functions (Vandyke ; McLendon ).
Efficiency
The largest component of the education budget is spent on teacher salaries. However, these are low in comparison to the national average (see table ). In , teacher salary as a percentage of the average salary ranged from a low of per cent in Kazakhstan to a high of per cent in Turkmenistan. This ratio declined throughout the s in all countries except Kazakhstan. By , the salary ranged from per cent of the national average in Kazakhstan to per cent in Tajikistan. Low teacher salaries create morale problems in schools, encourage corruption, and force many teachers to take second jobs in order to support themselves, and so the quality of education is compromised (World Bank ).
Teachers are underpaid, but also underutilized. On two dimensions— student–teacher ratio and teacher hours per day—teachers are used less intensively than in OECD countries. Table presents data on student– teacher ratios in Central Asia from to at three levels of education.
Table
Teachers’ salaries as percentage of average wage
Kazakhstan Kyrgyzstan Tajikistan Turkmenistan Uzbekistan
© Blackwell Publishing Ltd. At each level the ratio is lower than the ratio in OECD countries. In , the average preschool class in OECD countries had . children per teacher. The ratio declined over time in most countries in Central Asia and ranged from a low of . in in Kazakhstan to a high of . in the Kyrgyz Republic.
At the secondary level, the disparity in the student–teacher ratio between OECD and Central Asian countries was smaller; in two countries—the Kyrgyz Republic and Tajikistan—the ratio is higher than in OECD countries. The OECD average in was . students per teacher. By the ratios in Kazakhstan (.), Turkmenistan (.) and Uzbekistan (.) were lower than that in the OECD.
At the higher education level, the same pattern is found. The OECD aver-age was . students per teacher in . By , Kazakhstan, Uzbekistan and Turkmenistan were significantly below the OECD level while the Kyrgyz Republic (.) and Tajikistan (.) reported a higher ratio.
Data on teaching hours per week indicate underutilization of teacher time in school. In OECD countries in , teachers were assigned from periods per week in Turkey to periods per week in the United States. In the Kyrgyz Republic in , teachers taught only periods per week.
Overall salaries paid to teachers are too low to encourage high-quality teaching. In addition, there are too many teachers relative to the number of students in preschool education in all countries and in secondary and higher education in Kazakhstan, Turkmenistan and Uzbekistan, and teachers are assigned too few hours of instruction. Expenditures on teachers comprise the largest share of public expenditures on education. These expenditures could be allocated more efficiently by raising salaries, reducing the number of teachers at all levels of education, and increasing the hours of work per teacher.
* data on secondary education, data on higher education.
© Blackwell Publishing Ltd. Conclusions
The adjustment of the education sector in Central Asia was close to the predictions of ten years ago (Heyneman , a, , ). The collapse in public expenditures in the early s placed fiscal pressures on the education system similar to those in sub-Saharan Africa and other parts of the developing world in the s. Construction stopped, new capital investment could not be considered, non-salary recurrent expenditures were reduced to a minimum, maintenance and repairs to buildings and equipment were post-poned. The value of teacher salaries slipped precipitously by comparison to professionals with equivalent qualifications, and the delivery of teacher salaries was frequently delayed. Teachers of English and other specializations in high demand abandoned the system for employment where they could maintain their families. The recovery of expenditures in the late s, however, did not lessen the educational challenges.
The most serious educational challenges in Central Asia are only loosely related to expenditures. They are those of adjustment in policy in response to changes in the wider economy and polity. Education systems under state socialism were effective but inefficient. Under an open democracy the old structures and standards became largely ineffective (Heyneman b). Under state socialism vocational training was largely provided through state-owned industries, and wage levels were artificially administered. As the state-owned industries became private, and wages became increasingly based on marginal productivity, the demand for vocational training declined in four out of five countries. By contrast, the demand for general training was associated with significant increases in household expenditures and wages in every country. One can find rapid increases in higher education enrolments across most of Central Asia in spite of the dramatic increase in private costs associated with higher education. Although tuition and other higher education fees increase annually, the private demand for higher education, and the ability to privately pay for it, is increasing just as rapidly.
Although predicted, changes in the education sectors in the Central Asian republics have been profound. New curricula, textbooks and pedagogies have appeared. New languages of instruction, sometimes accompanied by a change in script, have been implemented.9 Sources of finance have been
diversified; providers have included both private and public authorities. However profound, these changes constitute only the first stage of the educational transition.
© Blackwell Publishing Ltd.
Appendix
Expenditure on defence and education (% of GDP)
Notes
. There are two definitions of adult literacy in use. In the UNESCO definition
literacy consists of the answer in the census to the questions “have you finished the fourth grade?” or “can you read?” The OECD definition of adult literacy is performance-based, with data gathered from sample surveys of the adult popula-tion. The difference between the two definitions is profound. In essence, we have no knowledge of adult literacy in Central Asia based on OECD standards
(Heyneman ).
. Choice of emphases by families or local communities was subject to central
approval; “child-centered” orientations such as those based on Steiner, Montessori, Dewey, Schiller or Bloom were suspect because it was assumed that the Party
guide to childcaring was all that was necessary (Kerr ; Kaufman ; Kitaev
; Tomiak a, b).
. The economic return is a measure of the net benefits of education investment over
one’s expected lifetime. Benefits in each period t (Bt) include higher earnings and
productivity; costs in each period (Ct) include direct costs such as tuition and fees,
transportation expenditures, and opportunity costs or the earnings that one could
have without additional education. If the expected lifetime is T years and the
market rate of interest is r, then the total net benefits from additional education
over the lifetime are equal to: . If this sum is equal to zero, then the
lifetime benefits equal the lifetime costs and the investor breaks even. The internal rate of return to an individual or to society is equal to the interest rate that leads to this break-even point. If this return is greater than the market interest rate, the benefits exceed the costs, and education is a good investment.
Kazakhstan Kyrgyzstan* Tajikistan Turkmenistan** Uzbekistan***
**Defence and security; data are from the approved budget. ***Other expenditures, including defence.
Source: International Monetary Fund, Recent Economic Developments, various issues; Statistical Appendix, various issues; Selected Issues and Statistical Appendix, various issues.
© Blackwell Publishing Ltd.
. The data from Kazakhstan were obtained from the Living Standards
Measurement Survey. The data from the Kyrgyz Republic were from the
Kyrgyzstan Poverty Monitoring Survey and the Living Standards
Measure-ment Survey. The data from Tajikistan were from the Living Standards
Measurement Survey. The data from Uzbekistan were from a pilot study in
the Fergana oblast for the redesigned Household Budget Survey.
. To estimate the return to education from an earnings function, the log of earnings
or income (expenditures) is regressed on education, experience and other variables that may affect the productivity of labor. The regression coefficient on education is the return to education. If education is measured with a series of categorical variables, the coefficient on education measures the proportionate increase in earnings or income associated with that level of education relative to the omitted education category—incomplete secondary or primary education in our case.
. This shift was typical across the new republics of the Newly Independent States
(NIS). The shift in responsibility was in part tactical. Under extraordinary pressure because of the collapse of public revenues, the republican Ministry of Finance was either not able or did not want to balance demands from different sectors. Downloading the responsibility for social expenditures to the regions was a way to avoid direct confrontations. Although local authorities had acquired the respon-sibility for managing these expenditures, they did not acquire the authority to initiate new taxation. They were expected to finance social expenditures solely from the resources allocated to them from central authorities. Nor did the responsibility for local finance necessarily imply that regional authorities were to acquire authority in other administrative arenas. Curriculum standards, teacher salaries, pedagogical rules and regulations continue to originate from central authorities.
. The community is a census enumeration unit. A separate random sample of
communities was selected in each year.
. In the s, higher education enrolment rates under state socialism were about
half of those in Western Europe and a third of those in North America, and because wages were determined artificially, the private economic rates of return
to higher education were actually negative (Heyneman ).
. Decisions over language of instruction and choice of (Arabic, Cyrillic or Roman)
script are made on the basis of political priorities rather than on considerations of cost or pedagogical efficiency.
References
Anderson, K. H. and Pomfret, R. (), Relative living standards in new market
economies: evidence from Central Asian household surveys, Journal of Comparative
Economics, , : –.
Anderson, K. H. and Pomfret, R. (), Consequences of Creating a Market Economy:
Evidence for Household Surveys in Central Asia, Cheltenham: Edward Elgar Publishing.
Anderson, K. H., Pomfret R., and Usseinova, N. (), Education in Central Asia
during the transition to a market economy. In A. J. DeYoung and S. P. Heyneman
(eds), The Challenge of Education in Central Asia, Greenwich, CT: Information Age
Publishing, pp. –.
Berryman, S. E. (), Hidden Challenges to Education Systems in Transition Economies,
Washington, DC: World Bank.
Heyneman, S. P. (), Education in the Europe and Central Asia region: policies
of adjustment and excellence. In F. J. H. Mertons (ed.), Reflections on Education in
Russia, Amersfort: Acco Publishers, pp. –.
© Blackwell Publishing Ltd.
Heyneman, S. P. (b), Educational choice in Eastern Europe and the Former
Soviet Union: a review essay, Education Economics, , : –.
Heyneman, S. P. (), Transition from party/state to open democracy: the role of
education, International Journal of Educational Development, , : –.
Heyneman, S. P. (), The sad story of UNESCO’s education statistics, International
Journal of Education Development, : –.
Heyneman, S. P. (), From the party/state to multi-ethnic democracy: education
and social cohesion in the Europe and Central Asia region, Educational Evaluation
and Policy Analysis, , : –.
Kaufman, C. (), De-sovietizing educational systems: learning from past policy
and practice, International Review of Education, : –.
Kerr, S. T. (), Will Glasnost lead to Perestroika? Directions of education reform
in the USSR, Educational Researcher, , : –.
Kitaev, I. V. (), Current developments in the Former USSR labour market and
their interaction with the education system, Russian Education and Society (March):
–.
McLendon, M. (), Straddling market and state: higher education governance
and finance reform in Kazakhstan. In A. J. DeYoung and S. P. Heyneman (eds),
The Challenge of Education in Central Asia, Greenwich, CT: Information Age Publishing, pp. –.
Meurs, M. (), Government decentralization and development in transition
econ-omies: the case of the Kyrgyz Republic. Paper presented at the meeting of
the Central Eurasian Studies Society, Bloomington, IN.
Organization for Economic Cooperation and Development (OECD) (), Education
at a Glance: OECD Indicators, Edition, Paris: OECD.
Organization for Economic Cooperation and Development (OECD) (), Education
at a Glance: OECD indicators, Edition, Paris: OECD.
Silova, I. and Magno, C. (), Gender equity unmasked: democracy, gender, and
education in Central/Southeastern Europe and the Former Soviet Union,
Compar-ative Education Review, , : –.
Tomiac, J. (a), Education in the Baltic States, Ukraine, Belarus and Russia,
Comparative Education, , : –.
Tomiac, J. (b), Implications of political change in Europe for educational policy
development, Journal of Educational Finance, , : –.
Vandyke, N. (), Access to Education for the Poor in Europe and Central Asia, World Bank
Technical Paper no. , Washington, DC: World Bank.
World Bank (), Kazakhstan Public Expenditure Review, Report no. -KZ,
Washington, DC: World Bank.
World Bank (), Kyrgyz Republic Public Expenditure Review, Report no. -KG,