9 Vol. III │ No. 1 │ May 2017|
PERCEPTION OF CAPITAL, PROFIT AND DIVIDENDS AFFECT
THE STOCK PURCHASE INTENTION IN
INDONESIA PUBLIC COMPANY
Iskandar Muda Faculty Economics and Business – Universitas Sumatera Utara Jl. Prof. TM
Hanafiah No.12 USU Campus, Medan. North Sumatera, Indonesia - Postal Code 20155. Telephone +62618214545; +62618225464 Fax.+62618218532
Corresponding Author: [email protected]
We suggest you to cite this article as:
Muda, I., 2017. Perception of capital, profit and dividends affect the stock purchase intention in Indonesia public company. Junior Scientific Researcher, Vol III, No. 1, pp. 9-18.
ABSTRACT
This study aims to investigate the influence perception of Capital Gains and Dividends on Stock Purchase Intention in Indonesian companies. Variables used in this research are the capital, profit and dividends (independent variables) and Stock Purchase Intention (dependent variable) and to show their relationship, it was used multiple linear regression. This research included Manufacturing Companies listed on the Indonesia Stock Exchange and there were taken into account a number of 38 societies Data of this research are secondary data, obtained from the financial statements of the investigated companies published in the Indonesia Stock Exchange. The results showed that simultaneous independent variables have a significant influence on the capital structure, while partially effect on the Capital Shares Purchase Intentions. It was also shown that Profit and Dividends do not affect the Stock Purchase Intention.
Keywords: Capital, Earnings, Dividend, Share Purchase Intention and Indonesian companies. JEL Codes: D53
1. INTRODUCTION
In Indonesia, manufacturing industry include basic industry and chemical sectors, various industrial and consumer goods industries in the country has grown and developed quite rapidly and quickly. It is supported by the high level of consumption as rising middle class incomes and changes in their lifestyle. One of these is the change in investments. The new trend is to base on financial investments, such as stock investment, especially in companies listed on the stock exchange.
The manufacturing industry in Indonesia is one of the prime movers’ economy.
10 Vol. III │ No. 1 │ May 2017|
The stock exchange together with money market are the main sources of external capital for companies and governments
Investment is always associated with the risk, regardless of the form of the investment. Investing in the capital market has a certain risk, which is greater than investing in assets that have a low risk or close zero (risk-free), such as savings deposits and obligation Ferreir (2004); Talla, (2013) and Khodaparasti, (2014). Shares is a testament to the participation of an individual or business entity in a corporation or limited liability company.
The share price of each company is different. It will be determined by the performance of a company. Therefore, any society that issued the shares very attentive to the market price of its shares or stock equity (Almeida, 2007). The share price that is too low illustrates the company's performance is below the accepted limit. However, if the stock price is too high also causes unfavorable impact. In this situation, it tends to reduce the ability of investors to buy. Basically, there is no limit of the amount of funds (buying or selling stock).
In stock trading, the traded amount is exchanged in units called lots (Letter of transaction). Investors can put their money in the form of shares in other companies listed on the Indonesian stock exchange (Amihud, 2002; Bigelli, 2012). Shares purchased can be recorded as short-term investments and long-term investments, depending on the purpose of purchase. If the shares were purchased by the intended using of idle funds and proceeding to meet the funding needs, the purchase of shares will be recorded as short-term investments and are included in current assets group.
Some issues that affect the intention of an investor to buy shares can be determined by capital, profit and dividends obtained by investors of the company. Indonesia Stock Exchange requires a lot of 100 shares, which is the minimum limit of purchase of shares. Funds needed for the stock also varies due to variable price of shares listed on the Stock Exchange. It is closely related to the company's net profit (Khaldun & Muda, 2014). If the annual company's profit, which always increasing the attraction for investors. .
Gains from stock investments are called dividends. Yield flows of cash dividends
and rising stock prices. Every year, Stockholder’s a company must decide what
percentage of the company's net profit should be distributed to Stockholder’s. The rest is
invested back into the company as additional capital, and used to drive the company's growth.
According to legendary investor Warren Buffett, the stability of the dividend and the net profit are indicators that corporations managed well and have a competitive
advantage. Logically, when the business doesn’t register increases, yet, the company is
still able to distribute dividends (Lutfi et al, 2016). From the descriptions and explanations that have been outlined above, researchers interested in studying the perception of capital, profits, dividends disburse securities that may affect the Stock Purchase Intention. Sample of research is manufacturing companies listed in Indonesia Stock Exchange.
11 Vol. III │ No. 1 │ May 2017|
2.1 Effect of Stock Purchase Intention of Capital Against
Capital is the amount of deposits that is used to generate revenue Acharya, et al, 2007; Adrian and Shin, 2010). It is very important and represents a major requirement for entrepreneurs or investors to build a business or a business. An investor who has long struggled in the investment world certainly better understands the importance of capital in building a business. Surely, it is more profitable because investors can buy shares of several companies benefit listed on the stock exchange Indonesia.
Capital here represented with Net Profit Margin (Net Profit Margin) This ratio measures the net profit after tax to sales. The higher net profit margin the better operation of an enterprise (Vejzagic and Zarafat, 2013).
𝑁𝑃𝑀 = Net Income After Taxes Sales 𝑥 100
2.2. Effect of Stock Purchase Intention of Earnings
The use of a financial statement information in the financial statements would be very useful for investors in terms of taking a transaction decision to be committed capital markets and for the information of lenders before granting loans to the company. By looking at the financial statements it can be determined a company whose financial condition is better and stable then the credit application is accepted, and vice versa the company of the debtor whose financial condition is bad then the credit application is rejected. In addition, the bank in applying the analysis of financial statements has been adequate. (Lutfie et al., 2016). The financial statements used by the bank on lending decision making. Given this information easier for investors to capital markets transaction to change in stock prices and trading volume. For information purposes, the financial statements are designed to show net income. This illustrates the company's ability to pay at the beginning of the agreement (Bradley, et a.l., 1984).
The financial statements will be used by stakeholders, such as investors, shareholders, government and the public as a potential buyer of shares of the company. These financial statements will also be used to measure which company's ability can grow in order to build trust within investors' expectations. This is because invested shares in the company can generate high profit. The better a company's financial statements of the current period to the next period, it will affect investor’s confidence in buying interest in shares (Gunasekarage, et al., 2004).
Profit is measured by the current ratio:
𝑐𝑎𝑠ℎ 𝑟𝑎𝑡𝑖𝑜 = current liabilities 𝑥 100cash
2.3. Effect of Dividend Interests Against Buying Stocks
12 Vol. III │ No. 1 │ May 2017|
(Dimitrov, 2008 and D’Mello et al, 2008). Various considerations are accurate and
reliable analysis is needed in this business to obtain the expected rate of return. In this situation, the most important aspectis the feeling of security and the level of return or dividend to be gained from such investments (Fama, 1981; Gan et al, 2006; Greene, 2010 and Gul, 2013).
Dividends are distributions to shareholders. The dividend distribution will reduce retained earnings and cash available to the company, and it is considered a primary purpose of a business (Lutfi et al, 2016). Dividends are distributed on time to make stock buying interest of investors increasingly. Dividends measured by Return on Investment (ROI) has the following mathematical relationship>
𝑅𝑂𝐼 = Net Income After TaxTotal Assets 𝑥 100
Stock Purchase Intention (EPS) is a ratio used to indicate the ability to generate earnings per share (Sharma, 2002; Hussin et al.,2012). Here's how to calculate Earnings Per Share (EPS)>
𝐸𝑃𝑆 = Net Income After Tax − Dividend Common stock outstanding 𝑥 100
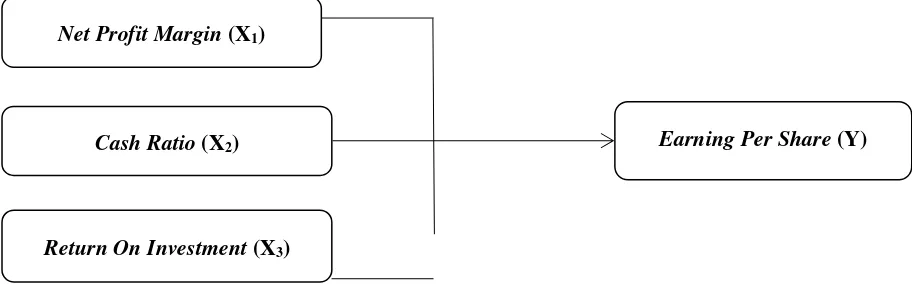
2.4. Conceptual Framework
The conceptual framework is a model that explains the relationship between different factors and the theory. Based on the description of the background, on thea review of previous studies, I have identified three (3) independent variable (X) and 1 (one) dependent variable (Y) which are exposed in Figure 1.
2
Figure 1. Conceptual Framework Source: D’Mello et al., 2008
3. RESEARCH METHODS
Methods of data analysis used in this study are based on descriptive analysis and hypothesis testing performed by Multiple Linear Regression analysis using SPSS software. Once all the data was documented and collected, the researcher conducted further data analysis methods. Multiple regression analysis is a regression that has one
Net Profit Margin (X1)
Earning Per Share (Y)
Cash Ratio (X2)
13 Vol. III │ No. 1 │ May 2017|
dependent variable and more than one independent variable (Lutfi, et al, 2016; Tarmizi et al., 2016; Muda et al., 2016; 2017 and Kumar, 2013) and it can be described as follows:
Y = 𝛼+ β1X1 + β2X2+ β3X3+ e
Explanation:
Y = Stock Purchase Intention (Earning Per Share)
a = Constanta
b1-b3 = Coefficient
X1 = Capital Gains (Net Profit Margin)
X2 = Profit (Cash Ratio)
X3 = Dividends (Return on Investment)
e = Error
The type of data included in this research (quantitative) is secondary data and it was obtained indirectly or through an intermediary medium: Indonesia Stock Exchange. The population in this study is composed by all manufacturing companies listed in Indonesia Stock Exchange during the period 2014-2015: 38 companies.
4. RESULTS AND DISCUSSION 4.1. Descriptive Research Samples
This study used a population of about 144 company listed on the Indonesia Stock Exchange. After the sample selection criteria, only38 companies could be included in the research.
4.2. Analysis Descriptive Statistics
Descriptive statistics was used to analyze the data: Table 1. Descriptive Statistics
N Minimum Maximum Mean Std. Deviation
X1 38 .14 32.81 8.2295 7.33166
X2 38 .40 352.43 58.7311 71.95415
X3 38 .18 41.50 12.7058 10.84708
Y 38 .00 3345.00 591.3222 898.99524
Valid N (listwise) 38
Sources: Data processed (2017).
Table 1 explains that Capital (X1) of manufacturing companies had a minimum
value of 0:14 and a maximum value of 32.81 with an average of 8.2295 (2014/2015). The
standard deviation is 7.33166 and the amount of data 38. Profit (X2) manufacturing
company in the 2014/2015 had a minimum value of 0.40 and a maximum value of 352.43 with an average of 58.7311. The standard deviation is 71.95415 and the amount of data
14 Vol. III │ No. 1 │ May 2017|
average of 12.7058. The standard deviation is 10.84708 and the amount of data 38. Stock Purchase Intention (Y) had a minimum value of 0:00 and a maximum value of 3345.00 with an average of 591.3222.
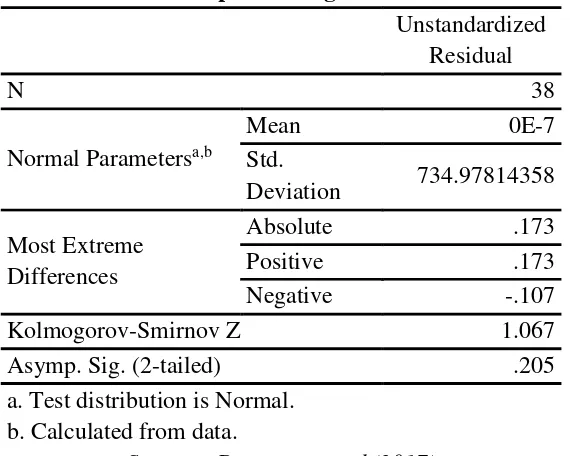
4.3 Data Analysis Research 4.3.1 Classical Assumption Test A. Normality Test
In this research, the author used normality test to determine the distribution of the
data. According to Kolmogogrov Smirnov test (Mahdaleta et al., 2016), the data is
normally distributed: α<0.205 (Table no. 2). research data, as explained in Table 2 is
significantly by 0.205 > α value of 0.05.
Table 2. One Sample Kolmogorov Smirnov Test
Unstandardized dependent variation. The coefficient of determination is zero and one. The hypothesis that
was tested is (h0) if Capital Gains and Dividend influence (simultaneously and partially)
to Stock Purchase Intentions.
15 Vol. III │ No. 1 │ May 2017| b. Dependent Variable: Y
Sources: Data processed (2017)
Adjusted R Square value in Table 3 (0.273) provides almost all the information needed to predict the variation of the dependent variable. It shows that 27.3% of Stock Purchase Intention can be explained by the variable capital, profit and dividends. Remaining 72.7% is influenced by other variables.
4.4.2. Test Results Statistics F
F statistical test performed to demonstrate interactions between capital, dividend income and Stock Purchase Intention. There can be seen from the results of the regression F test in Table 4 the following aspects:
Table 4. F Test Result
Regression 9915983.812 3 3305327.937 5.623 .003b
Residual 19987136.247 34 587856.948
Total 29903120.059 37
a. Dependent Variable: Y
b. Predictors: (Constant), X3, X2, X1
Sources: Data processed (2017)
Fcount values Table obtained at 5,623 while the Ftable at the 95% confidence level
(α = 0.05) was 3,267. This shows that the Fcount> Ftable (5,623> 3,276), which proves
thatcapital, profit and dividends simultaneously affect the Stock Purchase Intention.
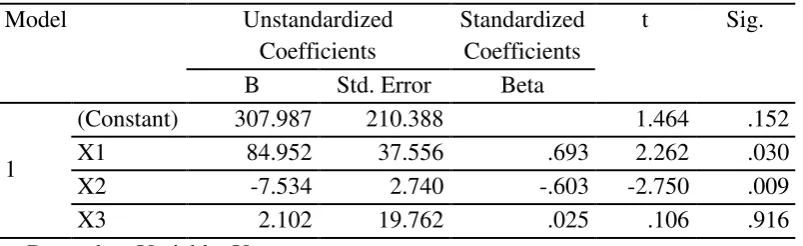
4.4.3. T Test Results
T Test shows how an independent variable (Capital/Profit/Dividend) individually or partially influences the dependent variable Stock Purchase Intention. If the value of
Fcount> Ftable, it can be concluded that a partially independent variable affects the dependent
variable. The results can be seen in Table 5.
16 Vol. III │ No. 1 │ May 2017|
Based on the above table, the partial effect of each independent variable on the dependent variable can be described as follows:
a. Capital (2262>2.0301) partially affects the Stock Purchase Intention from 2014 to
2015, where the value tcount> ttable . .
b. Profit (-2750>2.0301) partially affects the effect on Stock Purchase Intention from
2014 to 2015, where the value tcount> ttable.
c. Dividend (0.106 <2.0301) partially does not affect Stock Purchase Intention from 2014
to 2015. Because the value tcount> ttable.
In these situations, H0 was rejected and H1 accepted. From the description above, the
multiple regression equation can be written as:
Y = 307,987 + 84,952X1 - 7,534X2 + 2,102X3 + e
Variable X1 influences Stock Purchase Intention with a coefficient of 84.952. It
means that each increment of 1 Rupiahs to the X1 will raise Stock Purchase Intention of
84.952. X2 affects Stock Purchase Intention (negatively) and X3 does not affect the Stock
Purchase Intention as insignificant (0.859> 0.05).
5. CONCLUSIONS AND RECOMMENDATIONS
5.1 Conclusion
The results of this research provide conclusions about the effect of the simultaneous perception of Capital Gains and Dividends in the Indonesia Public Companies. Capital perception and Profit are partially affected by Stock Purchase Intention and dividend variable does not affect the Stock Purchase Intention.
5.2. Suggestions
Based on the results in this study, the author makes the following remarks:
1. For further research is expected to increase the number of independent issues and add
a suitable moderating variable to moderate the dependent and independent variables. In addition, further research is expected to increase the number of reference and the study period.
2. For companies – they should be more active in the use of internal funds as income.
3. For investors and creditors – it is necessary to pay more attention to the condition of
capital ratios, Earnings and Dividends company before investing and lending to companies.
REFERENCES
1. Acharya, V., Almeida, H. & Campello, M., 2007. Is cash negative debt? A hedging
perspective on corporate financial policies. Journal of Financial Intermediation,
17 Vol. III │ No. 1 │ May 2017|
2. Adrian, T., & Shin, H.S., 2010. Liquidity and leverage. Journal of Financial
Intermediation, 19(3), 418-437.
3. Almeida, H. & Campello, M., 2007. Financial constraints, asset tangibility, and
corporate investment. Review of Financial Studies, 20(5), 1429-1460.
4. Amihud, Y., 2002. Illiquidity and stock returns: Cross-section and time-series
effects. Journal of Financial Markets, 5(1), 31-56.
5. Bigelli, M. & Sánchez-Vidal, J., 2012. Cash holdings in private firms. Journal of
Banking and Finance, 36(1), 26-35.
6. Bradley, M., Jarrel, A.G. & Kim, E.H., 1984. On the existence of an optimal capital
structure: Theory and evidence. Journal of Finance, 39(3), 857-878.
7. Dimitrov, V., Jain & P., 2008. The value-relevance of changes in financial leverage
beyond growth in assets and GAAP earnings. Journal of Accounting, Auditing and Finance, 23(2), 191-222.
8. D’Mello, R., Krishnaswami, S. & Larkin, P., 2008. Determinants of corporate cash
holdings: Evidence from spin-offs. Journal of Banking and Finance, 32(7), 1209-1220.
9. Ferreira, M.A., Vilela & A.S., 2004. Why do firms hold cash? Evidence from EMU
countries. European Financial Management, 10(2), 295-319.
10. Fama, E., 1981. Stock returns, real activity, inflation, and money. The America
Economic Review, 71, 545-565.
11. Gan, C., Lee, M., Yong, H.H.A. & Zhang, J., 2006. Macroeconomic variables and
stock market interactions: New Zealand evidence. Investment Management and
Financial Innovations, 3(4), 89-101.
12. Greene, W.H. & Hensher, D.A., 2010. Modelling Ordered Choice: A Primer. United
Kingdom: Cambridge University Press.
13. Gul, A. & Khan, N., 2013. An application of arbitrage pricing theory on KSE-100
index; A study from Pakistan (2000-2005). IOSR Journal of Business and
Management (IOSR-JBM), 7(6), 78-84.
14. Gunasekarage, A., Pisedtasalasai, A. & Power, D.M., 2004. Macro-Economic
Influences on the Stock Market: Evidence from An Emerging Market in South Asia. 1-24.
15. Hussin, M.Y.M., Muhamad, F., Abu, M. & Awang, S., 2012. Macroeconomic
variables and Malaysian Islamic stock market: A time series analysis. Journal of
Business Studies Quarterly, 3, 1-13.
16. Khaldun, K.I. & Iskandar M., 2014. The Influence of Profitability And Liquidity
2010-18 Vol. III │ No. 1 │ May 2017|
2012). International Journal of Economics, Commerce and Management. 2(12). 1-17.
17. Khodaparasti, R., 2014. The role of macroeconomic variables in the stock market in
Iran. Polish Journal of Management Studies, 10(2), 54-64.
18. Kumar, R., 2013. The effect of mocroeconomic factor on Indian stock market
performance: A factor analysis approach. IOSR Journal of Economics and Finance (IOSR-JER), 1, 14-21.
19. Lutfi, M., Nazwar, C., & Muda, I., 2016. Effects of investment opportunity set,
company size and real activity manipulation of issuers in Indonesia Stock Exchange
on stock price in Indonesia. International Journal of Economic Research. 13(5),
2149-2161.
20. Mahdaleta, E., Iskandar M. & Gusnardi, M.N., 2016. Effects of Capital Structure and
Profitability on Corporate Value with Company Size as the Moderating Variable of Manufacturing Companies Listed on Indonesia Stock Exchange. Academic Journal of Economic Studies. 2(3), 30–43.
21. Muda, I., Dharsuky, A.,Sadalia, I., & Siregar, H.S., 2016. Impact of capital
investments and cash dividend policy on Regional Development Bank (BPD) PT. Bank Sumut to the district own source revenue and economic growth. International Journal of Applied Business and Economic Research. 14(11). 7863-7880.
22. Muda, I, Dharsuky. A., Siregar, H.S., & Sadalia, I., 2017. Combined Loading and
Cross-Dimensional Loadings Timeliness of Presentation of Financial Statements of Local Government. IOP Conference Series: Materials Science and Engineering. 180. doi: 10.1088/1757-899X/180/1/012099.
23. Sharma, S.C. & Wongbangpo, P., 2002. Long-term trends and cycles in ASEAN
stock markets. Review of Financial Economics, 11. 299-315.
24. Talla, J.T., 2013. Impact of Macroeconomic Variable on the Stock Market Prices of
the Stockholm Stock Exchange (OMXS30). Master’s Thesis of Jonkoping
University. 1-48.
25. Tarmizi, HB., Daulay, M., & Muda, I., 2017. Impact of The Economic Growth and
Acquisition of Land to Tthe Construction Cost Index in North Sumatera. IOP
Conference Series: Materials Science and Engineering. 180. doi: 10.1088/1757-899X/180/1/012004.
26. Vejzagic, M. & Zarafat, H., 2013. Relationship between macroeconomic variables