END MEMBERS CONTRIBUTING TO SNOWMELT AND
RAIN-ON-SNOW RUNOFF GENERATION IN KAWAKAMI
HEADWATER CATCHMENT, CENTRAL JAPAN
Kontribusi Sumber Aliran pada Pembentukan Air Limpasan dari
Lelehan dan Hujan Salju di Cekungan Hulu Kawakami, Jepang
Tengah
Kasdi Subagyono
ABSTRACT Determination of end members contributing to runoff generation is crucial for characterizing hydrological processes in temperate region. The study was conducted toward the snowmelt event on March 28, 2001 and rain-on-snow event on March 29, 2001 in Kawakami Experimental Basin (KEB), Nagano Prefecture, Central Japan. Hydrometric and hydrochemical measurements were conducted and EMMA using Ca2+ and SO42- was used to analyze end-member contributing to runoff generation. Three end member of near surface riparian, hill slope soil water and deep riparian groundwater had been identified as the major end members contributing to snowmelt runoff generation in this catchment with respectively 55%, 23% and 22% and 73%, 12%, and 15% respectively during snow melt and rain-on-snow event. Hydrometric analysis showed that subsurface runoff during snowmelt event and rain-on-snow is dominated by shallow subsurface flow especially within riparian zone, the reason why near surface riparian considerably contributed to total runoff. Peak snowmelt runoff occurred at around 14.00 during March 28, 2001 of snowmelt runoff event, which is in accordance
with peak air temperature. Meanwhile the peak of rain-on-snow runoff occurred at 16:00, at which the amount of the rainfall was observed to be the determinant factor.
Keywords: end members, End Member Mixing Analysis (EMMA), runoff generation, snow melt event; rain-on-snow event; forested headwater catchment.
ABSTRAK Penetapan sumber air yang berkontribusi dalam proses air larian sangat penting untuk mengkarakterisasi proses hidrologi di daerah beriklim sedang. Penelitian dilakukan terhadap pelelehan salju tanggal 28 Maret 2001 dan hujan pada salju tanggal 29 Maret 2001 di Kebun Penelitian Kawakami, Provinsi Nagano, Jepang bagian Tengah. Pengukuran parameter hidrometrik dan hidrokimia serta Analisis Percampuran Sumber Air (EMMA) menggunakan Ca2+ dan SO42-dilaksanakan untuk menentukan
sifat dinamis dari jalur aliran air dan untuk menganalisis sumber air yang berkontribusi terhadap proses larian. Tiga sumber air yang meliputi air bumi dangkal di zona Riparian, air tanah di zona pelerengan, dan air bumi dalam di zona Riparian teridentifikasi sebagai sumber air utama dalam menentukan proses larian di DAS hulu berhutan wilayah Kawakami, masing-masing 55%, 23% dan 22% serta 73%, 12%, dan 15%. Analisis hidrometrik menunjukkan bahwa air larian bawah permukaan selama kejadian pelelehan salju dan hujan pada salju didominasi oleh aliran air bawah permukaan khususnya pada zona Riparian. Hal ini merupakan alasan mengapa air bumi dangkal di zona Riparian memiliki kontribusi terbesar pada kejadian larian. ________________________________
Naskah masuk : 10 April 2012 Naskah selesai revisi : 20 Maret 2013 Naskah siap cetak : 23 Mei 2013 ___________________________________
Kasdi Subgyono
2
Puncak larian pada 28 Maret 2001 diidentifikasi saat pelelehan salju terjadi pada pukul 14.00 yang berkorelasi dengan suhu tertinggi. Sementara itu puncak larian pada kejadian hujan pada salju terjadi pukul 16.00 dimana jumlah hujan merupakan faktor penentu kejadian larian tersebut.
Kata Kunci: sumber air, analisis percampuran sumber air (EMMA), air larian, pelelehan salju, hujan pada salju, DAS hulu berhutan.
INTRODUCTION
It is important to initiate the time when the melt is started and ended to understand the mechanism of melting process and its contribution to the runoff generation. Unfortunately, there were lack detail measurements in the present study on the snowpack metamorphism because the attempt to do so involves some difficulties. Plot scale studies to identify runoff pathways associated with melt events are required (Evans et al., 1999). Jones and Stein (1990) have described the process of snow metamorphism in cold snow covers and may give insight into the process of which it contributes to the runoff. Nevertheless, by incorporating the time series hydrometric and climate data during the event, the relationship between the time dependent change in the melt and the runoff generation can be used for understanding the snowmelt process. The extent to which the hydrochemical variation is formed under the runoff process was examined.
Melting usually occurs at the surface of a snow capacity of frozen ground is the key to determine snowmelt runoff. Westertsrom and Singh (2000) reported that snowmelt runoff hydrograph peak is linearly related to the snowmelt amount.
Defining the hydrochemical changes of the catchment during the snowmelt event requires a knowledge of flowpaths dynamic on which the water flow governing the solutes transport passes through. In nature, solutes production through rock weathering and input from atmospheric deposition are in counterbalance with those
exported by water flow and those have been lost during chemical reaction. These processes lead to change chemical compositions of the soil as well as the hydrochemistry of the catchment with the magnitude varies from one soil to another and distinctly differ between the catchment depending upon the factors influencing their change. In a certain point of a hillslope segment, depletion in chemical concentration occurs when the input is less than the rate of transport process or of the chemical reaction. The process in which the chemical composition changes by flow during a snowmelt runoff is being the interest in this paper.
Since the water picks up the chemical signature and transports through the soil, spatial and temporal variations of water chemistry are controlled by the dynamic of flowpath, although the in-situ weathering process plays a deterministic role. The chemical composition of the near stream riparian may differ from that of the hillslope, due to different process governing solutes production and transport. Folster (2001) reported that the possible processes in the near stream riparian zone include cations exchange, leaching of organic matter and redox reactions of sulphur compounds. However, the redox reactions hardly occurred in hillslope side, except when perched water tables are present.
separate this zone into two different contributors to runoff generation and stream chemistry.
Determining the source component of runoff is also critical to validate the hydrological model of the catchment. Evans et al. (1999) suggested that a two component system of shallow and deep saturated subsurface flow, in which the two components respond simultaneously during hydrologic events, may be applicable to their study basin. However, end-member mixing analysis (EMMA) confirmed that stream chemistry may not be only made up of two sources of solute but three (Christophersen et al., 1990). Other studies have also used EMMA in study. This paper discusses end-members contributing to snowmelt and rain-on-snow runoff in a first order basin of forested headwater catchment.
MATERIALS AND METHODS
Site Description
The study was conducted from August 2000 to August 2001 in Kawakami Experimental Basin (KEB), Nagano Prefecture, Central Japan. Snow melt event on March 28, 2001 and rain-on-snow event on March 29, 2001 were recorded to elucidate three end members contributing to snow melt and rain-on-snow runoff generation. The KEB is a first order basin of 5.2 ha from the total area of 14 ha. The altitude of the catchment ranges from 1500 m to 1680 m above sea level with slightly steep slopes (about 20%) over the riparian zone and very steep slopes (>60%) over the hill slope area.
This catchment underlied by late Neogene of the Meshimoriyama volcanic rocks, which consists of lavas and pyroclass of olivine-hornblende-pyroxene andesites (Kawachi, 1977). The upper soil mantle primarily consists of inceptisols with very narrow area of the riparian zone covered by 20 cm to 30 cm of peat. The A-horizon is rich in
organic matter with rapid hydraulic conductivity (Ks = 21.6 - 93.6 cm/h), while the B-horizon which has more clay has a very slow hydraulic conductivity (Ks = 0.007 - 0.9 cm/h). Average snow cover of about 30 to 70 cm thick was standing over the hill slope and riparian zones for about three months winter season. During the March 28, 2001 snow melt and rain-on-snow events, the thickness of the snow cover was about 30 - 40 cm. Mean annual precipitation is about 1500 - 1600 mm, producing 853 mm of runoff (Matsutani et al., 1993). A natural deciduous forest of oak (Quercus mongolica Fisch), larch plantation (Larix leptolepis Gordon), and the bamboo grass (Sasa nipponica) are very common in this area.
Methods
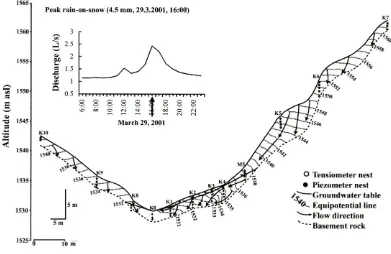
To determine end members contributing to snow melt and rain-on-snow runoff generation, hydrometric and hydrochemical parameters have been measured. A transect across hillslope and riparian zone approximately along the flow line was nested with piezometers, tensiometers and suction samplers with various depths (Figure 1).
Hydrometric measurements
Discharge was continuously recorded using 30°V-notch gauging weir installed at upstream tributary of the northern valley of the catchment. Water level at weir was automatically recorded using a data logger that was set for every 10 min interval recording. Air temperature was measured using thermometer placed at the climate station at near main weir (150m from thetransect). Relationship between temperature and snowmelt had been recorded.
4
with inner diameter of 1.5 cm and outer diameter of 1.7 cm and the porous cup at the bottom of the tube.
Flow line was determined across hillslope and riparian zone to define the spatial variation of sub-surface flow based on this equipotential line. The equipotential line was defined using piezometer and tensiometer data. Variation of vertical and lateral sub-surface flows were defined by determining vertical and lateral heads gradient of groundwater between two points at different depths in the riparian zone. The vertical head gradient (∂H/∂z) was determined as follows: ∂H/∂z = (H2-H1)/(z2-z1) (1)
Where H1 and H2 are hydraulic head at the
shallowest (0.2 m) and deepest (2 m) depths respectively, and z1 and z2 are the elevation of the
observation points. The lateral head gradient (∂H/∂z) was determined as follows:
∂H/∂z = (Hb-Ha)/(zb-za) (2)
Where Ha and Hb are hydraulic heads at the nest
4 and the nest 5 respectively, and za and zb are
elevation at the nest 4 and 5 respectively.
Chemical Measurements samples were collected monthly and during snowmelt event. Groundwater samples were taken from the piezometers (perforated at the bottom of 10 cm), whereas soil water samples were collected from suction samplers installed at the same site with piezometers and tensiometers nests at depths of 0,3; 0.4; 0.5; 0.6; 1.0; 1.1; 1.5; 2.0; 3.0; and 4.0 m. The stream water samples were taken at the upstream, middle, transect site, and at near the weir. Samples were collected using 100 ml polyethylene bottles. Before collecting the samples, the bottles were rinsed
Figure 1. The transect showing the nest of piezometers, tensiometers and suction samplers.
Bedr
Southern hillslope StreamRiparian Northern hillslope
with the groundwater, soil water, or stream water depending upon the sampling sites.
The water samples were filtered through 0.22 μm Millipore membrane filters to remove any suspended matters. Filtered solutions were, then, analyzed for chemical composition including chemical composition of groundwater, soil water, stream water, and rain water. The chemical composition were measured including Ca2+, Mg2+, K+, Na+, Al3+, Fe, Si, Cl- , SO42-, NO3-,
HCO3-. Concentrations of Ca2+, Mg2+, K+, Na+,
Al3+, Fe, SiO2 were determined using an
Inductive Couple Argon Atomic Emission Spectrophotometer (ICAP-757V, Nippon Jarrel-Ash) at the Chemical Analysis Center of University of Tsukuba, whereas Cl- , SO42-, NO3
-concentrations were measured using Ion Chromatographic Analyzer (Shimazu PIA-1000) at Laboratory of Hydrology, Institute of Geoscience, University of Tsukuba. Concentration of HCO3- was measured by
titration with H2SO4 using 645 Multi Dosimat
(Metrohn).
End-Member Mixing Analysis (EMMA)
End-member mixing analysis (EMMA) using Ca2+ and SO4 was performed to calculate the
proportion of stream water from three principal source components of snowmelt and rain-on-snow runoff respectively on March 28, 2001 and March 29, 2001. These were chosen because there were differences between the end members, as emphasized by Hooper et al. (1990), and often appeared in the stream. This approach was used with regard to the fact that all source components of runoff are assumed to mix conservatively signature from each source area.
EMMA was performed according to the procedure outline by Christophersen and Hooper (1992) as well as used by Burns et al. (2001) as follows: (1) data set of groundwater, soil water, and stream water was collected during a period of August 2000 to August 2001 for both events from 5.2 ha first order drainage basin, which consisted of six solutes concentrations including Na+, Ca2+, Mg2+, SiO2, and HCO3-, (2) data were
standardized by subtracting the mean concentration of each solute and divided by standard deviation of each solute, (3) multivariate statistical analysis was done by performing the orthogonal projection of the matrix of the standardized values into the mixing subspace (stream). Residuals between the projected and the original data were plotted against the observed concentration to see how fit the data is. Other useful scalar measures of fit i.e. relative bias (RB) and the relative root mean square error (RRMSE) were also used, (4) to examine the end-members bounding the measured stream water chemistry during snowmelt on March 28, 2001 and rain-on-snow on March 29, 2001 events, groundwater and soil water data were projected into mixing subspace (stream water), and (5) the goodness-of-fit of solute concentrations predicted by EMMA were compared with the concentrations measured during that snowmelt event through least squares linear regression.
Geochemical hydrograph separation was used to separate snowmelt runoff into its process-related components using the observed data of the March 28, 2001 snowmelt and of the March 29, 2001 rain-on-snow events. The contribution of each end-member to the snowmelt runoff generation that is predicted by EMMA was calculated based on the mass balance method for water and the
6 Si; and NSR, DRG, HS, and T refer respectively to the inflows of near surface riparian, deep riparian groundwater and hillslope soil water and the combined total outflow.
RESULTS AND DISCUSION
Snowmelt and Rain-on-Snow Runoff
The successive change in potential distribution and flow direction during snowmelt runoff on March 28, 2001 and rain-on-snow runoff on March 29, 2011 are depicted respectively in Figures 2 and 3. In all consecutive measurements, at both events, the potential distribution and the flow lines at the southern hillslope did not change considerably, except those at around K8 nest near the stream channel at which the flows successively changed from the considerably vertical downward at early on-set melt and early rain-on-snow to the lateral at peak melt and peak rain-on-snow and tend to return to almost vertical downward flow during recession time.
In the northern hillslope, at the early melt and early rain-on-snow, most of the flow was considerably vertical either at the riparian zone or at the hillslope except at very steep slope between M5 and K5 nests at which the flows were down slope. While the melt and rain-on-snow processes were progressed, the flow directions were changed. At late on-set melt and late rain-on-snow, the flow change to almost antecedent wetness of the soil profile causing the
flow to return to nearly vertical downward during the recession melt and recession rain-on-snow. The lack of moisture at the hillslope segment leads to a distribution of soil water after the melt water and rain-on-snow water released were infiltrating through the soil surface. This may allow soil water to contribute in the runoff generation through the displacement process. The increase of transient saturated zone extends the wetness front more up slope, this combined with the displacement process of the hillslope soil water by infiltrated melt water and rain-on-snow water control the mechanism of the delivering the hillslope soil water.
Figure 2. Successive change in the potential distribution and flow lines during snowmelt runoff on March 28, 2001.
8
In the northern hillslope segment, it was clearly identified that the soil water laterally moved at very steep and concave slopes between M5 and K5; K5 and K6 and K6 and K7 nests. At the convex slope site (see the upper part of K5 and of K6 nest), the flows were generally vertical downward. This finding was in accordance with that described by Baven and Kirkby, (1979) and more detail by Tsukamoto and Ohta (1988).
Chemical mixing
Unlike the data of the storm event on August 21-22, 2001 in which the stream chemistry data were bounded between three end-members using Ca2+ and SiO2 concentrations (Subagyono et al.,
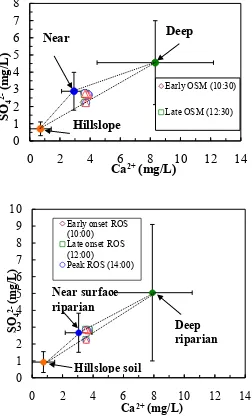
2005), the stream chemistry was fit well between three chosen end-members using Ca2+ and SO4
2-during the snowmelt events on March 28, 2001 and rain-on-snow events on March 29, 2001 (Figure 4). Using Ca2+ and SiO2 concentrations,
the stream water chemistry was more than 90%
Figure 4. Mixing diagram of Ca2+ and SO42- for (a) snowmelt event on March 28,
2001 and (b) rain-on-snow event on March 29, 2001 showing different end-members contributing to runoff process.
0
1
2
3
4
5
6
7
8
0
2
4
6
8
10
12
14
SO
4
2-(m
g
/L)
Ca
2+(mg/L)
Early OSM (10:30)
Late OSM (12:30)
Hillslope
Near
Deep
0
1
2
3
4
5
6
7
8
9
10
0
2
4
6
8
10
12
14
SO
4
2
-
(m
g
/L
)
Ca
2+(mg/L)
Early onset ROS (10:00)
Late onset ROS (12:00)
Peak ROS (14:00)
Near surface
riparian
Hillslope soil
and 50% out of bound during respectively snowmelt and rain-on-snow events. This suggests that SiO2 was becoming more important tracer
Unlike the storm event at which the stream water chemistry changed obviously across the hydrograph, during these events the stream water
chemistry did not change considerably. For both events, Ca2+ and SO42- concentrations of the reason why the deeper lateral flow was developed prominently in the riparian zone is because the increase of rainfall amount accelerates the metamorphism of the snowpack to release melt water to percolate into the deeper soil layer. As it
(a)
(a)
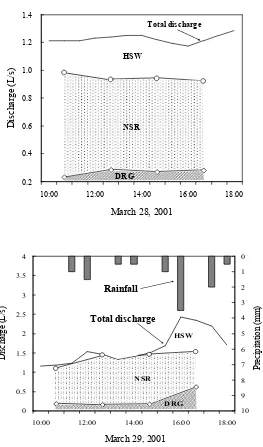
Figure 5. Hydrograph separation (a) during the snowmelt runoff on March 28, 2001 and (b) during rain-on-snow runoff on March 29, 2001.
10
has been reported that the accelerated metamorphism under saturated conditions and preferential flowpaths created owing to uneven snow surface caused by the impact of intense rain over the snow surface, are understood to be responsible for the high velocity of water flow. These solute concentrations did not linearly change toward the hillslope soil water, but tend to change toward the deep riparian groundwater.
Sources of runoff
Hydrograph separation predicted by end member mixing analysis (EMMA) using Ca2+ and SO4
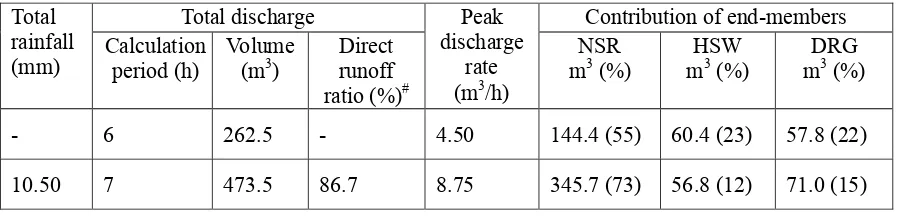
2-showed that the near surface riparian, the hillslope soil water and the deep riparian groundwater were identified to be the three major sources of runoff with contribution of 55%, 23%, and 22% respectively during the snowmelt event and 73%, 12%, and 15% respectively during the rain-on-snow event (Figure 5). During this event, the near surface riparian was the largest contributor. These hydrographs separation provided means to compare the response of the
catchment on the radiation induced snowmelt events.
It was observed in this catchment that riparian zone plays an important role in generating the stream water chemistry (Subagyono et al., 2005). The chemistry of the catchment is concentrated in the groundwater of this zone which due to different residence time between this zone and the hillslope soil water zone. The riparian groundwater and hillslope soil water seems to be
included in the choice of potential end-members. It has also been clearly observed that near surface riparian (60 cm depth) water chemistry differed with that of the deep riparian groundwater. This variation leads us to choose the near surface riparian water as the third component of potential end-member. Since the surface flow has been identified to have less contribution to stream flow compared with the subsurface flow, therefore it was not included as the most three potential end-members. During the snowmelt event there was no saturated overland flow observed in the hillslope segment due to high infiltration rate. The one that flows through the surface of riparian zone was very limit and can be neglected.
The peak of the radiation induced snowmelt was reached at around 14:00. The near surface riparian dominated the peak flow as high as 55% during the snowmelt runoff and 73% during rain-on-snow runoff. By considering the biggest contribution of the near surface riparian to runoff generation with the extent to compare with that during snow runoff events, the
rain-on-snow runoff is superior to the rain-on-snowmelt runoff (Subagyono, et al. 2005). This is in accordance with that reported by Evans et al. (1999) for the area of Moor House, eastern.
Cumbria, UK, where the evidence that the largest floods are associated with rain-on-snow events, although the direct rain runoff may be small (Sueker et al., 2000). From their study in the Rocky Mountain National Park, Colorado, USA, they reported that the direct rain runoff Table 1. The contribution of each end-member to total runoff during the snowmelt event on March
28, 2001 and the rain-on-snow event on March 29, 2001.
Total
contributed only 4 to 13% of the total runoff during the snowmelt event. In the present study, from the total rainfall of 10.5 mm, 86.7 % of it directly flows to the stream channel (Table 1). This means that the runoff generation was dominated by the subsurface flow in which the near surface riparian, the hillslope soil water and the deep riparian groundwater were the major components. In the same site, Hamada et al. (2001) have made a hypothetical model of flowpath in the hillslope segment during the snow event in which the present of a frozen layer near the surface was included. Due to this frozen layer the infiltrated melt water may not percolated deeper but it was rapidly flowing through the surface of frozen layer to reach the stream channel. During the snowmelt event on March, 2001 the frozen layer was absent (Hamada et al., 2001) leading to the deeper
downward flow of infiltrated melt water to recharge into the groundwater, which will be a delay response to the stream flow.
Radiation Induced Snowmelt
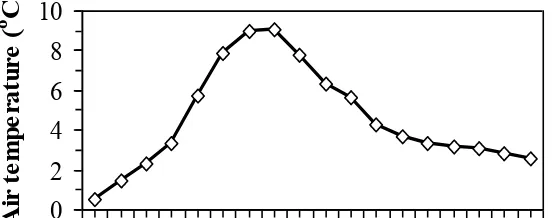
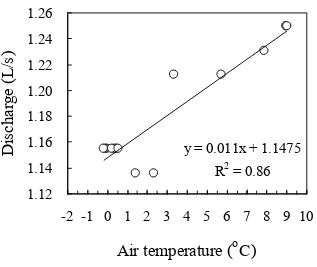
As air temperature affects the melting process (Dingman, 1994), the increase in air temperature will increase the amount of melting water and discharged to the stream channel (Figure 6). Figure 7 shows the relationship between air temperature and the runoff during the snowmelt event. The relationship between this parameter was found to be linear. This finding was similar with that reported by Westerstorm and Singh (2000). They related between the snowmelt runoff hydrograph and the amount of snowmelt for their experiment in Lulea, Sweden and found that the relationship was linear and suggested that by knowing the amount of snowmelt, it can obtain an approximate estimate of the resulting hydrograph peak. In the present study, the relationship between air temperature and runoff
explained more than 80% of the variability in the runoff. The heat transferred to the snow surface induced the snowpack to melt. This phenomenon usually termed as radiation induced snowmelt. Figure 6. The effect of air temperature on the runoff during the snowmelt event.
0
2
4
6
8
10
A
ir
t
e
m
p
e
rat
u
re
(
o
C)
1.10
1.15
1.20
1.25
1.30
7:00 10:00 12:00 14:00 16:00 18:00 21:00 0:00
March 28, 2001
D
is
ch
ar
ge
(
L
/s
)
12
This provides insight into a possible estimate of the amount of melt water that can be transferred into the runoff, when there is lack detail of the measurement of the melt water volume.
CONCLUSIONS
The EMMA using Ca2+ and SO42- proved that
near surface riparian, hillslope soil water and deep riparian groundwater are the three major end members contributing respectively as much as 55%, 23% and 22% to snowmelt runoff generation and 73%, 12%, and 15% to rain-on-snow event in Kawakami forested headwater catchment. Hydrometric data and analysis showed that subsurface runoff during snowmelt event is dominated by shallow subsurface flow especially within riparian zone, the reason why near surface riparian contributed much to total runoff. Peak snowmelt runoff occurred at around 14.00 during March 28, 2001 snowmelt runoff event which is in accordance with peak air temperature, while peak rain-on-snow runoff occurred at around 16.00. This is the radiation
induced snowmelt where the heat transferred to the snow surface induced the snowpack to melt.
REFERENCES
Baven, K. L. and Kirkby, M. J. 1979., A physical based variable contributing area model of basin hydrology. Hydrol.Sci. Bull., 24, 43-69.
Bazemore D. E., Eshelman, K. N. and Hollenbeck, K. J. 1994., The role of soil water in stormflow generation in a forested headwater catchment: synthesis of natural tracer and hydrometric evidence. J. Hydrol., 162, 47-75.
Burns, D. A., McDonnell, J. J., Hooper, R. P., Peters, N. E., Freer, J. E., Kendall, C. and Beven, K. ,2001. Quantifying contributions to storm runoff through end-member mixing analysis and hydrologic measurements at the Panola Mountain Research Watershed (Georgia, USA). Hydrol. Process., 15, 1903-1924.
Figure 7. Relation between the air temperature and the runoff during the snowmelt event.
y = 0.011x + 1.1475
R
2= 0.86
1.12
1.14
1.16
1.18
1.20
1.22
1.24
1.26
-2 -1 0 1 2 3 4 5 6 7 8 9 10
Air temperature (
oC)
D
is
c
h
ar
g
e
(L
/s
Christophersen, N., Neal, C., Hooper, R.P., Vogt, R. D. and Andersen, S., 1990. Modelling streamwater chemistry as a mixture of soilwater end-members-A step towards second-generation acidification models. J. Hydrol., 116, 307-320.
Christophersen, N. and Hooper, R. P., 1992. Multivariate analysis of stream water chemical data: The use of principal components analysis for the end-member mixing problem. Water Resour. Res., 28, 99-107.
DeWalle, D. R. and Pionke, H. B., 1994. Stream generation on a small agricultural catchment during autumn recharge, II, Stormflow periods. J. Hydrol., 163, 23-42.
Dingman, S. L., 1994. Physical Hydrology. Prentice Hall. New Jersey, 575p.
Evans, C., Davies, T. D. and Murdoch, P. S., 1999. Component flow processes at four streams in the Catskill Mountains, New York, analysed using episodic concen-tration/discharge relationships. Hydrol. Process., 13, 563-575.
Hamada, Y., Tanaka, T. and Kasdi Subagyono., 2001. Effect of the formation of frozen layer on the pattern and chemistry of snowmelt discharge in a forested headwater basin: Preconsideration. Proceeding of the Japan Society of hydrology and water resources. pp. 56-57 (in Japanese).
Hangen, E., Lindenlaub, M., Leibundgut, Ch. and von Wilpert, K., 2001. Investigating mechanisms of stormflow generation by natural tracers and hydrometric data: a small catchment study in the Black Forest, Germany. Hydrol. Process., 15, 183-199.
Hinton, M. J., Schiff, S. L. and English, M. C., 1994. Examining the contributions of glacial till water to storm runoff using two- and three component hydrograph separation. Water Resour. Res., 30, 983-993.
Hooper, R. P., Christophersen, N. and Peters, N. E. ,1990. Modelling streamwater chemistry as a mixture of soil water end-members-An application to the Panola Mountain Catchment, Georgia, U.S.A. J. Hydrol.,
116, 321-343.
Katsuyama, M., Ohte, N. and Kobashi, S., 2001. A three-component end-member analysis of streamwater hydrochemistry in a small Japanese forested headwater catchment. Hydrol. Process.,15, 249-260.
Kawachi, S., 1977. Geology of the Yatsugatake District. Regional Geological Report. Geological Survey of Japan, 89-91 (in Japanese with English abstract)
Matsutani, J., Tanaka, T. and Tsujimura, M., 1993. Residence times of soil, ground, and discharge waters in a mountaineous headwater basin, central Japan, traced by small headwater catchment. J. Hydrol., 222, 75-92.
Mulholland, P. J., Wilson, G. V. and Jardine, P. M., 1990. Hydrogeochemical response of a forested watershed to storms: Effect of preferential flow along shallow and deep pathways. Water Resour. Res., 26, 3021-3036.
Mulholland, P. J., 1993. Hydrometric and stream chemistry evidence of three storm flowpaths in Walker Branch Watershed. J. Hydrol., 151, 291-316.
O’Loughlin, E. M., 1986. Prediction of
subsurface saturation zones in natural catchments by topographic analysis. Water Resour. Res.,7, 425-448.
Scanlon, T. M., Raffensperger, J. P. and Hornberger, G. M., 2001. Modelling transport of dissolved silica in a forested headwater catchment: Implications for defining the hydrochemical response of observed flow pathways. Water Resour. Res., 37, 1071-1082.
14
Catchmnet, Central Japan. Hydrological Process, Vol. 19 No. 10 , 1939-1965.
Sueker, J. K., Joseph, N. R., Kendal, C. and Jarrett, R. D., 2000. Determination of hydrologic pathways during snowmelt for alpine/subalpine basins, Rocky Mountain National park, Colorado. Water Resour. Res., 36, 63-75.
Tsukamoto, Y. and Ohta, T., 1988. Runoff process on a steep forested slope. J. Hydrol., 102, 165-178.