Volume 25, Number 3, 2010, 353 – 368
THE IMPACT OF FX (FOREIGN CURRENCY EXCHANGE)
ON THE BOTTOM LINE OF TEXTILE/SHOES INDUSTRIES
LISTED IN INDONESIA STOCK EXCHANGE 2006-2008
Hendro Subekti1 Universitas Gadjah Mada ([email protected])
ABSTRACT
During 2006-2008, Indonesia has been experiencing depreciation of IDR against world currency US$. The situation was triggered by global crisis October 2008, and IDR currency plunged. Furthermore, 17 textile/shoes industries publicly listed in ISX have been severely hit by depreciation of IDR The “Huge Loss of Bottom Line” in 2008 was recorded (IDR 617 billions) more than half of trillion IDR. To be curious the most of industry are manufacturer-exporter.
Year 2007, national textile industry overwhelmingly reports the export sales of US$ 10.05 billion and the raw material import was US$ 2.04 billions. By these facts, Income contribution from textile/shoes industries sector was US$ 8.01 billion and became a mile stone of the achievement. Depreciation of IDR currency is an advantage to the exporter as product become cheaper for foreign buyer while import goods costly to foreign seller.
The aim of this research is to describe the impact of FX on the bottom line of the Textile/Shoes Industries listed in ISX during 2006-2008, a period when the profit performance has been fallen sharply in line with the depreciation of IDR currency. By using the mathematical regression equation is surprisingly proven that FX adversely impact to the “bottom line” of the industry. The equation model selected Net Income as dependent variable while Operating Profit, Financial Charges and FX (Forex) as the independent variable.
From the outcome of the research, the dilemma between operation and financial leverage is revealed. Depreciation IDR was negatively reduced the “bottom line” this was mainly due to higher FX loss. By the end of December 2008, 17 shoes/textile industries have been suffered a huge loss of FX, and recorded FX Loss (IDR 564 billions), in connection with “high financial leverage denominated in US$ currency”. The snapshot of balance sheet position is called “Net Short Asset to US $”. Only 5 Industries were making money among 17 industries during 2008. Only one company had already “hedged” their exposure to FX. Only one company who reported profit show “debt to equity ratio” is much lower than average industry (US Textile Manufacturing)
However, under the operational expectation, the depreciation of IDR currency encourage better performance of “export oriented company”. This is the dilemma that textile/shoes industries have been exposed to financial risk in one side and on the other side operational risk (competitiveness).
Keywords: net short asset to US$, financial leverage and financial risk, operational risk, foreign exchange loss, depreciation of IDR.
INTRODUCTION
Indonesian textile industry has been con-tributing to the country economic added value for the welfare of the people. Textile industry mainly is an export oriented company using imported raw materials and strategically supporting the 1,841,520 Formal Employment Sector. Which is the highest employment contributor in the manufacturing sector.
Raw material for textile industry is traded as a “world commodity”. Generally cotton fiber is the important main raw material of textile industries. The textile industry have been heavily depend on raw cotton from world cotton grower such as USA, China, India, Australia, Pakistan, South West Africa, Uzbekistan etc. Year 2007 textile industry sector have been reporting export sales of US$ 10.05 billion, in conjunction with the imported raw materials of US$ 2.01 billion. By this facts, therefore income for foreign currency were US 8.04 billion, recorded the country highest achievement, and contribute 2.4 % from GDP
Year 2006-2008 IDR currencies have been depreciated against major currency US$. IDR plunged in the 4th quarter of 2008 when Sub prime Mortgage Crisis triggered the deprecia-tion of world currencies. 17 textile industries have been hit by weakening of IDR against US$, and total 17 textile/shoes industries suffered the loss of (IDR 617 billions) more than half trillion IDR. Depreciation of IDR is supposed to be an advantage among the ex-porter as product from the home country is getting cheaper to “Foreign Buyer” and “im
-ported products” is getting expensive to “For
-eign Seller”. Therefore, the depreciation of IDR should benefit to manufacturer exporter consequently encourage the export industry to work with higher volume to achieve a highest utilization of plant.
The objectives of operational function and financial function in fact are not always in the same direction. Operational Manager would
like to have a lower exchange rate of IDR currency against US Dollar currency to encourage export, but on the other side the profitability result show the textile industry suffered the loss during 2006-2008.
Research question of this research is
“textile industry has been suffered loss, in connection with funding in foreign curren-cies”. This paper is described by 5 parts as follows:
Part 1 Theory and the development of hy-potheses;
Part 2 Research Method and Data Sam-pling;
Part 3 Results;
Part 4 Managerial Implication;
Part 5 Conclusion, Suggestion, and Future Research.
THEORY AND HYPHOTHESES
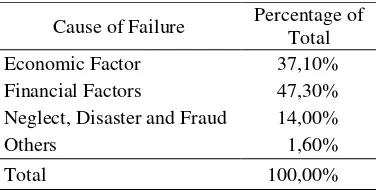
Economic Factor and Financial Factors are the main root cause of “Business Failure”. Table 1 D&B report shown the information how important both of factor to be carefully managed by corporation in order to survive in the global environment of business, like what has happened in the nation wide textile industry period 2006-2008.
Tabel 1. Causes of Business Failure
Cause of Failure Percentage of Total
Economic Factor 37,10%
Financial Factors 47,30% Neglect, Disaster and Fraud 14,00%
Others 1,60%
Total 100,00%
Source: Brigham and Erhardt (2005:814)
1. Probability of Default
debt, benefit to the return of the equity, but the higher ratio to debt posses the higher financial risk of the company. MM theory is having two propositions— (1) and (2).
Proposition I:
D T V
VL U C (1)
Where:
VL = is the value of a levered firm. VU = is the value of an unlevered firm. TCD = is the tax rate (TC) x the value of
debt (D)
The term TCD assumes debt is perpetual
The value of levered firm is equal to the value of unlevered firm in the same risk class (VU) plus the gain from leverage. The gain from leverage is the value of the tax savings found as the product of the corporate tax rate (TC). The important here is the corporate taxes are introduced the value of levered firm exceeds that the value of unlevered firm by the amount of TCD. This means that there are advantages for firms to be levered, since corporations can deduct interest payments. Therefore leverage lowers tax payments. Dividend payments are non-deductible.
Proposition II:
) T 1 )( r r ( E D r
rE 0 0D C (2)
Where:
rE = is the required rate of return on equity, or cost of levered equity = unlevered equity + financing
pre-mium
r0 = is the company cost of equity capital with no leverage (unlevered cost of equity, or return on assets with D/E = 0)
rD = is the required rate of return on borrowings, or cost of debt
D/E = are the debt-to-equity ratio TC = is the tax rate
The same relationship as earlier described is stating that the “cost of equity” rises with leverage, because the risk to equity rises, still holds. The formula however has implications for the difference with the WACC (Weighted Average Cost of Capital). Their second at-tempt on capital structure included taxes has identified that as the level of gearing increases by replacing equity with cheap debt the level of the WACC drops and an optimal capital structure does indeed exist at a point where debt is one hundred percents (100%).
The following assumptions are made in the propositions with taxes:
1. Corporations are taxed at the rate TC on
earnings after interest; 2. No transaction costs exist; and
3. Individuals and corporations borrow at the same rate.
Financial leverage theorem has brought the consequences for capital market. When misinterpreted in practice, that is can justify the increase of risk.
“The Probability of Default” as shown in figure 1, to which corporation need to control the optimum Debt To equity Ratio (DER). However, under the denomination of foreign currency of debt, economic “factors” such as exchange rate became main cause to the debt ratio. Debt to equity is becoming difficult to control and increasing the probability of default.
2. Foreign Exchange Rates and Foreign Exchange Risk
A foreign exchange rate is the price at which one currency (example: US$) can be exchanged for another currency (example IDR). Foreign exchange rates are listed on two ways: 1) US$ Received for one unit of the
foreign currency exchanged or a “Direct Quote” (US$ “Equivalent), and 2) foreign
an-nounced daily foreign exchange rate follow to
“indirect quote” version. See table 2.
Provitability of Default
100% D/E
Leverage (debt to equity ratio
FI-SAUNDERS AND CORNETT FIG 11-6, 2008:315
Source: Saunders and Cornet (2008: 315) Figure 1. Probability of Default
Table 2. US$ Equivalent and Currency per US$
Date : October 19, 2006, Thu
Direct Quote Indirect Quote Country US $ Equivalent Currency per US$
Argentina (peso) 0.3238 3.0883
Australia (Dollar) 0.7598 1.3161
China 0.1265 7.9082
Indonesia (Rupiah) 0.00010940 9,141
Source: Saunders and Cornet (2008:401)
Foreign exchange risk is the risk that exchange rate changes can adversely affect the value of asset and liabilities denominated in US$ currency but reported in local IDR currency.
0
0
FOREIGN LIABILITIESFOREIGN LIABILITIES
0
0
US$ 80 MILLIONS
US$ 100 MILLIONS
US$ 80 MILLIONS FOREIGN ASSETS
FOREIGN ASSETS
US$ 100 MILLIONS Net Short Asset Position
Net Long Asset Position
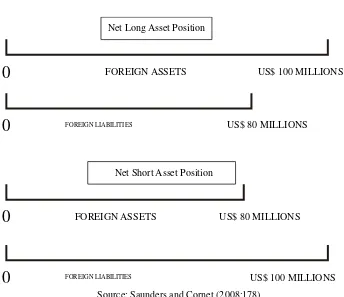
3. Net Long Asset Position and Net Short Asset Position
3.1. Net Long Asset Position
If we have foreign assets of US$ 100 millions, and in the same time we have foreign liabilities of US$ 80 millions, therefore we called this position as “Net Long Asset Position “ to US$ 20 millions. See figure 2.
3.2. Net Short Asset Position
If we have a foreign asset of US$ 80 mil-lions, and in the same time we have a foreign liabilities if US$ 100 millions, therefore we
called this position as “Net Short Asset
Position” to US$ 20 millions. See figure 2.
4. Appreciation and Depreciation of Home Currency to The Export Business
The appreciation of country currency (or rise in its relative value to other currencies) means that goods are more expensive for foreign buyer and that foreign goods are cheaper to foreign sellers. Thus domestic manufacturer find it harder to sell the goods abroad and foreign manufacturers find it easier to sell their goods to domestic purchaser. Conversely, depreciation of foreign currency (or fall in its value relative to other currencies) means that country goods become cheaper for
THE IMPACT OF FOREIGN EXCHANGE RATE IDR/$US TO THE BOTTOM LINE OF THE TEXTILE/ SHOES INDUSTRIES LISTED IN INDONESIA STOCK EXCHANGE 2006-2008
Net Profit Before Tax
Tax
Net Income
GAIN/LOSS FOREIGN EXCHANGE RATE
(UNREALIZED) Total Asset Equity+Liabilities
Asset US$ < Liabilities US$, Net Short or Long Balance Sheet 31 Dec IDR
Asset Liabilities Current Current Non Current Non Current
Total Liabilties Fixed
Equity
Administration & General Expense
Cost of Goods Sold
Revenue
Gross Profit
Operating Profit
Financial and other non operating expense Foreign
Exchange Rate IDR/$US
GAIN/LOSS FOREIGN EXCHANGE RATE
(REALIZED)
Source: Compiled and rearranged from Brigham and Erhardt (2005), Govindarajan and Anthony (2007)
foreign buyer and foreign goods become more expensive to foreign sellers (Saunders A., Cornett M, Financial Institution Management)
4.1. Hypotheses
From the reference and study of the above materials, topics relevant to the issue, 3 (three) hypotheses statements have been constructed as follows:
1. Hypothesis one:
Ho; μ=0 Operating profits do not impact to the net income.
H1; μ≠1 Operating profits do impact to the net income.
2. Hypothesis two:
Ho; μ=0 Financial charges do not impact to the net income.
H1; μ≠1 Financial charges do impact to the net income.
3. Hypothesis three:
Ho; μ=0 Foreign exchange rates do not impact to the net income.
H1; μ≠1
Foreign exchange rates
do impact to the net income.RESEARCH METHOD AND DATA SAMPLING
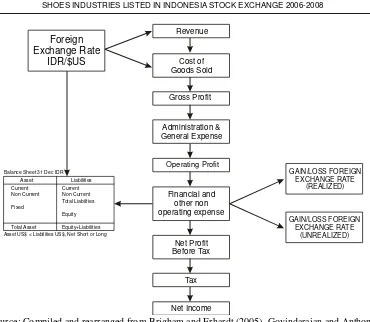
1. The Impact of Foreign Exchange (FX) to The Bottom Line
“Income Statement” of the company reflects the performance of company operation
for certain period hence “Balance Sheet” is the company position at a snapshot date. The flow
of “Foreign Exchange Rate” shall impact to the Income Statement and Balance Sheet of the corporations as figure 3 which shows the impact of foreign exchange to income state-ment and balance sheet.
The understanding of the flow diagram in figure 31 is how the manufacturer-exporter exposed to the impact of the foreign currency exchange, from the top to the bottom of flow:
1. Revenue from export income denominated in US$, Reflect to Account Receivables denominated US$ as well as a cash; 2. COGS (Cost of Goods Sold), imported of
raw material denominated in US$ reflect to account payable denominated US$ as well as inventory stocks, trade payable and cash;
3. Financial Leverage applied to short and long term loan, denominated in US$. Fi-nancial charges will reflect to the interest cost, gain/loss of foreign exchange rate realized and unrealized at the snapshot date;
4. “Balance Sheet” consists of both asset and liabilities. Asset is part of it denominated in US$ and liabilities is part of it denomi-nated in US$. Balance sheet is to be reported in IDR denomination currency at a snapshot date using the official foreign exchange rate published by BI (Bank Indonesia).
2. Research Method
1. Data analysis of income statement from revenue, cogs, gross profit, and operating profit/earnings before interest tax, net income, and data has been published by ISX;
2. Data analysis of balance sheet published by ISX;
3. “Statistical Analysis” and interpretation of the mathematical regression multi variable and model as an outcome of the research; 4. Basic and relevant theory:
1. Modigliani and Miller (MM Theory) on Debt Leverage;
2. Financial Management for Financial Institution;
3. Foreign Exchange Risk and Financial Risk Management;
3. Data Sampling
Textile industry configures from fiber to readymade garment for general “consumers” and others is used for specific purposes such
as “air bag” for automotive Industry, “geo textile” for construction road etc. The raw ma-terial fiber is converted to intermediate prod-ucts and then process to finished prodprod-ucts. The flow from “upstream” to “downstream” of
textile Industry in Indonesia are shown the figure 4 (volume in thousands tons /annum).
3.1 Archives Observation
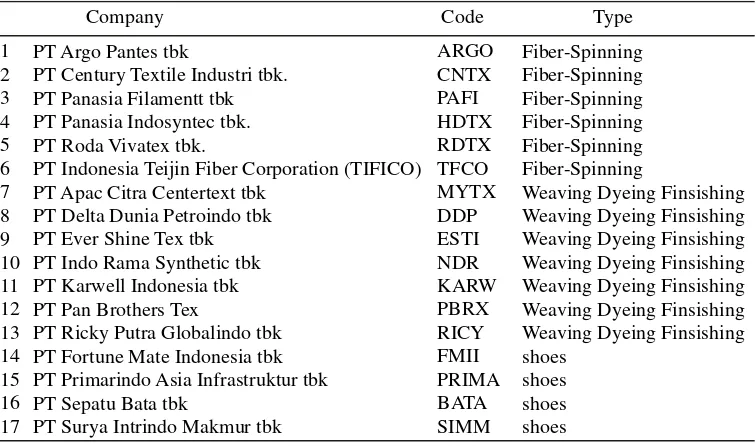
17 leading textile manufacturers and exporters in Indonesia until the date of the research as table 3.
This research aim to describe the impact of foreign exchange currencies to the bottom
IMPORT 705 PRODUCTION 800FIBER EXPORT 220 (27.50%)
IMPORT 90 YARN PRODUCTION 1680
EXPORT 800 (47.60%)
IMPORT 110 PRODUCTION 970FABRIC EXPORT 320 (32.90%)
IMPORT 20 GARMENT PRODUCTION 410
EXPORT 380 (92.7%)
SME GARMENT PRODUCTION 230 IMPORT 68
OTHERS PRODUCT PRODUCTION 120
EXPORT 110 (91.60%)
Source: Indonesiatextile (2010)
Figure 4. Research Object
Table 3. Compilation “Textile and Shoes listed BEI”
PT Argo Pantes tbk
PT Century Textile Industri tbk. PT Panasia Filamentt tbk PT Panasia Indosyntec tbk. PT Roda Vivatex tbk.
PT Indonesia Teijin Fiber Corporation (TIFICO) PT Apac Citra Centertext tbk
PT Delta Dunia Petroindo tbk PT Ever Shine Tex tbk PT Indo Rama Synthetic tbk PT Karwell Indonesia tbk PT Pan Brothers Tex
PT Ricky Putra Globalindo tbk PT Fortune Mate Indonesia tbk PT Primarindo Asia Infrastruktur tbk PT Sepatu Bata tbk
PT Surya Intrindo Makmur tbk 1
2 3 4 5 6 7 8 9 10 11 12 13 14 15 16 17
ARGO CNTX PAFI HDTX RDTX TFCO MYTX DDP ESTI NDR KARW PBRX RICY FMII PRIMA BATA SIMM
Fiber-Spinning Fiber-Spinning Fiber-Spinning Fiber-Spinning Fiber-Spinning Fiber-Spinning
Weaving Dyeing Finsishing Weaving Dyeing Finsishing Weaving Dyeing Finsishing Weaving Dyeing Finsishing Weaving Dyeing Finsishing Weaving Dyeing Finsishing Weaving Dyeing Finsishing shoes
shoes shoes shoes
Company Code Type
line of textile/shoes industry listed in Indone-sia Stock Exchange-ISX during the period 2006-2008. This research is expected to the benefit of the industry and to get the root cause of the problem on how to support textile industries and others business in order to maximize profit during the volatility of the FX.
RESULT
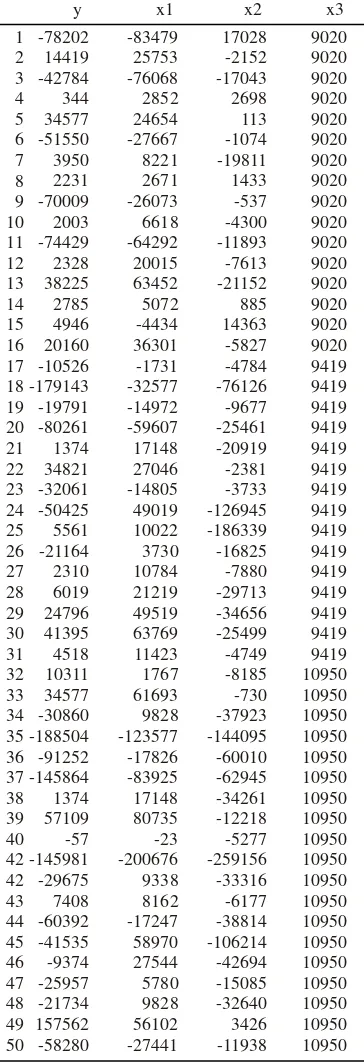
1. Dependent and independent variable The variable for the research has been selected; Y= Net Income as the dependent variable, three independent variables are Laba Bersih (Operating profit) =X1, Financial Costs =X2, and Rp/US$ Exchange Rate at a snapshot=X3.
Y = α + β1.X1 + β2.X2+ β3.X3+ε (3) Where:
Constanta = α
Coefficient of Operating Profit = + β1 Coefficient of Financial Charges = + β2
Coefficient of Foreign Exchange Rate= + β3
2. Classical Test 2.1. Autocorrelation Test
Durbin Watson (DW) test by SPSS pack-age. DW test number has been obtained as the model summary in table 6.
DW test score 2.057 concludes of no autocorrelation. DW test score -2, 4 indicate that the data is auto-correlated.
2.2. Multicolinearity Test
In table 7., the data result gives VIF (Variable Inflation Factor) score below 10, indicates of no multicolinearity.
2.3. Heteroscedasticity Test
Heteroscedasticity test is done by scatter plot and shown table 8 and figure 5 show no regularity pattern, all plots scattered above 0 levels and below zero level.
Table 4. Net Income, Operating Profit, Finan-cial Charges, Foreign Exchange Rate
Table 5. Data Variables Selected
Model R R Square Adjusted RSquare Std. Error of
the Estimate Durbin-Watson
a. Predictors: (Constant), Exchange Rate US$/IDR, Operatting Profit, Financial Charge b. Dependent Variable: Net Income
Model Summaryb
Table 7. VIF (Variable Inflation Factors)
Operating Profit Financial Charge Exchange Rate US$/IDR 1
Model
a. Dependent Variable: Net Income
Correlations
Zero-order Partial Part Tolerance VIF
Collinearity Statistics
a. Dependent Variable: Net Income
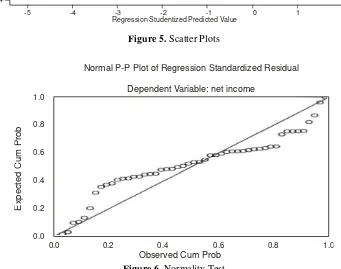
2.4. Normality Test
Dependent variable and independent vari-able need to be tested for normal distribution of data. The test has been done for the net income figures 6.
3. Regression Model
It is selected three independent variables, Operating Profit, Financial Charges and Ex-change rate US$/IDR (FX) by SPSS package , showed result R2 (R2adj=0.627) meaning 62.7%
is explained by mathematical model while 37.3% by others factor outside the model.
Regression and equation model, signifi-cant test and R2adj are shown in equation (4).
Y= 10100+0.835X1+0.225X2-2.318X3+ε(4)
F=28.6 t=7.176 t=1.903 t=0.353 R2adj=0.627
Thus, regression model confirms the relationship within variables and the degree of correlation is 0.627.
Scatterplot Dependent Variable: Net income
R
e
g
re
s
s
io
n
S
tu
d
e
n
ti
z
e
d
R
e
s
id
u
a
l
Regression Studentized Predicted Value
-5 -4 -3 -2 -1 0 1 2 4
2
0
-2
-4
Figure 5. Scatter Plots
Normal P-P Plot of Regression Standardized Residual
Dependent Variable: net income
E
x
p
e
c
te
d
C
u
m
P
ro
b
Observed Cum Prob
1.0
0.8
0.6
0.4
0.2
0.0
0.0 0.2 0.4 0.6 0.8 1.0
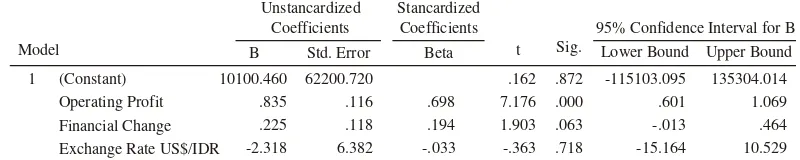
Table 9. Coefficient
Model (Constant) Operating Profit Financial Change Exchange Rate US$/IDR 1
B Std. Error Beta
Unstancardized Coefficients
Stancardized Coefficients
Coefficientsa
a. Dependent Variable: Net Income 10100.460
.835 .225 -2.318
62200.720 .116 .118 6.382
.698 .194 -.033
.162 7.176 1.903 -.363
.872 .000 .063 .718
-115103.095 .601 -.013 -15.164
135304.014 1.069 .464 10.529 t Sig.
95% Confidence Interval for B Lower Bound Upper Bound
4. Interpretation
Net Income =10100 + 0.835 Operating Profit + 0.225 Financial Charges – 2.318 Exchange Rate IDR/US$ + Disturbance Factor (5) By the regression model interpreted as follows:
1. Net income will be constant at 10.10 billion IDR it is not influenced by any changes in operating profits, financial charges and FX rates, but to be influenced by factors outside the model.
2. By the changes of operating profits shown the same up and downward trend, if operating profits increase by 1 billion IDR, net income increases to 0.835 billion IDR and the opposite.
3. By the changes of financial charges, shown the same up and downward trend, if financial charges increase by 1 billion IDR, net income increases to 225 million IDR and the opposite.
4. FX Rate stated with MINUS SIGN coefficient, means any increase of the FX
rate (depreciation) will impact and reduce net income. If FX rate increases 1000 points, net income reduces by 2.3 billions IDR, if FX rate decreases 1000 points, net income increases by 2.3 billions IDR.
4.1. Hypotheses Test
α
=5%, n=50 and independent variable, k=3 df=n-(k+1)= 46 Ftable=2.81
From Table 10. Fcalculation=28.42 therefore Fcalculation> Ftable, Significant value is 0.00.
Ha acceptance
Ho rejection Ho rejection
-2.81 +2.81
F=+28.42
Figure 7. Hypothetic Test;
Constructed from Ftabel=2.81, two tail,Normal Distribution Curve.
Table 10. ANOVA
Model
Regression Residual Total 1
Sum of Squares 1E+011 6E+010 2E+011
df 3 46 49
38319472680 1348064694
Mean Square F Sig.
28.426 .000a
a. Predictors: (Constant), Exchange Rate US$/IDR, Operating Profitl, Financial Change b. Dependent Variable: Net Income
1. Hypothesis one: operating profits do not impact to the net income in the Ho rejection area.
Decision: operating profits do impact positively (+) to the net income.
2. Hypothesis two: financial charges do not impact to the net income in the Ho rejection area.
Decision: financial charges do impact positively (+) to the net income.
3. Hypothesis three: FX does not impact to the net income is in the Ho rejection area. Decision: FX rates do impact negatively (-) to the net income.
5. Depreciation of IDR Adversely Impact The Bottom Line
From the equation model the significant correlation among operating profit, financial charges and FX rate, all together are showing the wide impact of external factors foreign currency to the bottom line of the textile industry during 2006-2008. It is obvious there
are “unique” outcome of the equation mathe -matical model as Net Income are in line with the movement of operating profit and financial charges but foreign exchange is moving in the opposite direction of net income. It is proven that depreciation of IDR currency during 2006-2008 is adversely affected to the bottom line. This negative effect of the depreciation of
IDR to the bottom line is revealing the “loss factor” is caused by funding or debt. The
unique position of foreign exchange to the net income describes two important situations as follows:
1. Under situation of IDR depreciation, the bottom line (net income) will be reduced; 2. Under situation of IDR appreciation, the
bottom Line (net income) will be increased.
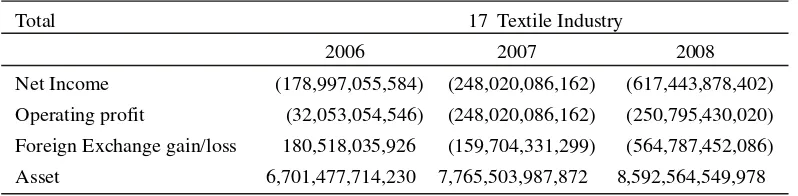
6. Why Depreciation of IDR (FX) Nega-tively Impacts to The Net Income? Analysis of the mathematical model is assisted by data in table 11.
See in particular a “foreign exchange gain/ loss”. It is concluded “loss factor” is caused by balance sheet at a “snapshot” end year closing book thus 17 textile industries are in “Net Short Asset Position to US$”.
MANAGERIAL IMPLICATIONS
1. The dilemma “Operational Leverage” and “Financial Leverage”
Research outcome has been sighting the dilemma between operational leverage and financial leverage. By Financial leverage, it is proven in the research outcome that the depreciation of IDR can adversely affect the net income, therefore this situation should not benefit to the net income and in the opposite, the appreciation of IDR should add to the net income thus is an advantage to the net income.
Table 11. Net Income, Operating profit, Foreign Exchange Gain/Loss
Total 17 Textile Industry
2007 2008
Net Income Operating profit
Foreign Exchange gain/loss Asset
2006 (178,997,055,584)
(32,053,054,546) 180,518,035,926 6,701,477,714,230
(248,020,086,162) (248,020,086,162) (159,704,331,299) 7,765,503,987,872
(617,443,878,402) (250,795,430,020) (564,787,452,086) 8,592,564,549,978
Operational leverage; textile industry as manufacturer – exporter in favorance with the depreciation of IDR, this situation shall in-crease the potential sales and country product become competitive and cheaper to the foreign buyer. Seventeen textile/shoes industries commonly operates with high operational leverage therefore the slowing down of sales lead to lower utilization of capacity and face
the “operational risk”, during the appreciation of IDR.
2. Global Business and Economic Environ-ment 2006-2008
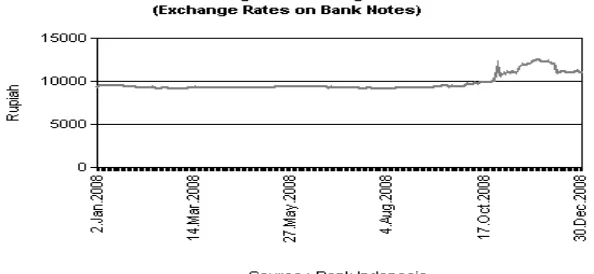
Indonesia Central Bank (BI) as the
mone-tary authority has been implementing “Man
-aged Floating” policy in FX trading. Triggered by Mortgage Crisis USA, IDR was plunged in the lowest level in 4th quarter 2008 see figure 8c.
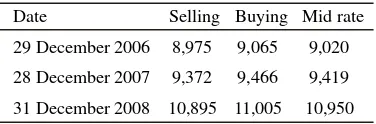
Table 12. Middle Rate IDR/US$; Summarized BI data
Indonesia Central Bank - BI
Date Selling Buying Mid rate
29 December 2006 8,975 9,065 9,020
28 December 2007 9,372 9,466 9,419
31 December 2008 10,895 11,005 10,950
Source: http://www.bi.go.id/biweb/Templates/
Moneter/Default_Kurs_ID.aspx
Figure 8a. Year 2006 Rate Fluctuation;
Figure 8c. Year 2008 Rate Fluctuation The FX rates fluctuation as the above
forced industry to face financial risk in the global business environment. Financial Risks can be caused by the funding requirements and the nature of the export-import business.
3. Textile Industry Environment
Seventeen textile/shoes industry performances were hurt by depreciation of IDR during 2006-2008. A several companies recorded extremely a huge loss. Most of 17 textile/shoes industries recorded total loss of (617 billion IDR). In the 2008, a number of profitable companies are getting less and a looser are increasing as shown in table 13.
CONCLUSIONS, SUGGESTIONS, AND FUTURE RESEARCH
1. Conclusions
1. Depreciation of IDR is proven to be adversely impact to the bottom line of the textile/shoes industries 2006-2008, listed in ISX. Industry has been faced the financial risk from exchange rate.
2. “Financial leverage” of 17 textile indus -tries are not appropriate and it is not done by ideal funding to the nature of the manufacturer-exporter businesses, this excessive US$ funding cause to higher
foreign exchange risk and other financial risk.
3. Textile Industry faced the dilemma be-tween operational leverage and financial leverage:
a. During depreciation of IDR, Financial Leverage has caused the massive foreign exchange loss (564 billions IDR) resulted from Net Short Asset Position to US$ currency inside the balance sheet;
b. During depreciation of IDR, product become cheaper and high plant utilization is in favor to operational cost. Operation risk is a common to manufacturer. Manufacturer should relay on high utilization of plant and demanded higher sales volume to achieve the best of economical cost. 4. Excessive US$ funding to textile
indus-tries cause to the asset and liabilities to
“Net Short Asset position” to US$. Both
US$ asset and liabilities position are not
matched. Due to “Net Short Asset Position to US$” textile industry is reporting the
massive loss of (564 billions IDR) during depreciation of IDR.
5. Financial leverage has been causing textile industries unable to optimize profit during
textile/shoes industries, 1 (one) profit com-pany from 5 (five) profit companies in 2008 using hedging facilities to protect their foreign exchange risk (PT Indorama tbk). One profit company from 5 profit companies has shown ideal capital
struc-ture (PT Sepatu Bata) with “Debt to Equity Ratio” 47.5% below the “US average textile manufacturing 51%”.
2. Suggestions
1. FX Funding Limit must be set in order to get allowable risks. Short term control and monitoring strictly to the asset and liabilities denominated in US$. If we are in
the “Net Asset Position to US$”, then the
corporation shall “Hedge”, and it can be done “partially” or “full hedge”. "Hedging"
can take to the period of 3 month at the due date of payment in US$. This aim to secure the incoming and outgoing cash flow of the company. For the hedging example of BDF AG Germany, Financial
Manager reported “75% of annual net cash flow are hedged. “Hedging Line” should be established operationally to enable using SWAP, Forward Selling/Buying available in the money market. The hedging or insurance participation shall increase financial cost therefore must be accounted properly.
2. In the long term, to restructure the capital structure of the company, corporation must limit and implementing discipline funding on US$ loan to finance the operation of the company. The aim of restructuring to Minimize the Net Short Asset Position to
US$ or if it is possible to take “Net Long Asset Position” to US$. The lesser the asset and liability gap in US$, the lesser risks to foreign exchange rate volatility. 3. Net Short Asset Position must be managed
to a certain level that company can afford to pay the foreign exchange risk resulted
from “volatility of foreign exchange”
which may happen in shortcoming future. Monitoring of the balance sheet position in particular “Net Short Asset Position to US$”. This is can be useful to:
a. To enable the creditor (bankers) to estimate the financial risk exposure of the companies;
b. Central Bank: to control the abuse of the foreign exchange speculation motives.
3. Future Research
This study has some limitations, which can be improved in the future. Therefore, a several list below may be considered by future research.
1. To extend the data for research— particu-larly with 2009-2010 data, the post “Global
Crisis” 2008 for obtaining 5-year research. 2. It is best to separate the “industry type”
from upstream to downstream, from fiber to readymade garment.
3. To find the industry sector who contribute to the strategic business of the country such as: Mines, Agriculture etc and iden-tify the impact on FX.
Table 13. Number of Losers and Winners
No of Companies 17
Year 2006 2007 2008
No of Losser (Loss) 6 7 12
Net of Winner (Profit) 11 10 5
Exchange Rate IDR/$US middle rate 9,020 9,419 10,950
Total 17 17 17
REFERENCES
Bank Indonesia, 2010. Available at http://www.bi.go.id/biweb/TimeSeries/tsK ursValuta_ID.aspx?series=select&ka, accessed June 21, 2010.
Baumohl, B., 2005, The Secret of Economic Indicators, Hidden Clues to Future Eco-nomic Trends. Wharton School Publishing, Pearson Education.
Beirrsdof AG, 2010. Available at www.beiersdorf.com/Investor.../Financial _Reports.html, accessed August 9, 2010. Brealy, R. and Myers, S., 1991, Principles of
Corporate Finance. 3rd Edition, McGraw Hill.
Brigham EF and Erhardt M, 2005, Financial Management Theory and Practice. 11th edition. International Student Editions. Brigham, E.F. and Gapenski, L.C., 1991,
Financial Management Theory and Practice. 12th Edition. New York: The Dryden Press International Edition. Danang S, 2009, Analisa Regressi dan Uji
Hipothesis. Yogyakarta: Media Pressindo. David J. Cummin, Richard D. Phillips, and Stephen D. Smith, First Quarter 1998.
‘The Rise of Risk Management’, ABI/NFORM research: 30 Economic Review-Federal Reserve Bank of Atlanta, 83 (1).
Govindarajan V., Anthony R.N, 2007, Man-agement Control System. 12th Edition. McGraw Hill.
Indonesiatextile, 2010. Available at http://indonesiatextile.com/index2.php?op tion=com_docman&task=doc_view&gid= 3&Itemid=54, accessed June 21, 2010.
Indonesia Stock Exchange, 2010. Available at http://www.idx.co.id/Home/ListedCompa nies/CompanyProfile/tabid/89/language/id -ID/Default.aspx, accessed March 15, 2010.
Indonesia Stock Exchange, 2010. Available at http://www.idx.co.id/Home/AboutUs/Ann
ualReport/tabid/75/language/en-US/Default.aspx, accessed on June 25, 2010.
Jones, C.P., 1994, Fifth Edition, Investment Analysis and Management, John Wiley and Sons. Inc., North Carolina.
Klemskosky, R. and Martin J, 1975, “The Effect of Market Risk and Portfolio
Diversification”, Journal of Finance. Pearce II, John A dan Robinson Jr, Richard B.,
2008, Strategic Management, Formulation, Implementation. Jakarta: Salemba Empat. Saunders. A, Cornett MM, 2008, “Financial
Institution” Management a Risk Manage -ment Approach, 6th edition. New York: Mc Graw Hill International Edition. Tamara Bekefy, Mark J. Epstein, Kristi
Yuthas, 2009. ‘Creating Growth from effective Risk Management’, CMA Management.
Teguh Wahyono, 2005, Model Analisis Statistik dengan SPSS 17, memahami teknik analisis statistik secara sistematik dan praktis [Statistic Analysis Model Using SPSS 17, Understanding Statistic Analysis Sistematically and Practically], Jakarta: PT Elex Media Komputindo. Thompson/Strcikland/Gamble, 2008, Crafting
and Executing Strategy. 17th edition. New York: McGraw Hill.