Volume 27, Number 1, 2012, 19 – 28
EXPLORING THE INDONESIAN ECONOMIC LANDSCAPE AND
STRUCTURAL CHANGE
1Muhammad Firdaus
Faculty of Economics and Management IPB
Budi Kurniawan
Faculty of Economics and Management IPB ([email protected])
Sri Mulatsih
Faculty of Economics and Management IPB ([email protected])
ABSTRACT
In assessing the economic impact of a sector or a group of sectors on a single or multiregional economy, input-output analysis has been proven to be a popular method. This paper explores the degree of structural change of the Indonesian economy using the input-output frame work. It examines how linkages among economic sectors have evolved from 1971-2008 and identifies which economic sectors exhibited the highest inter-sectoral linkages. The study finds that manufacturing consistently becomes the key sector in the Indonesian economy. Indonesian cannot afford to leapfrog the industrialization stage and largely depend on a service-oriented economy when the potential for growth still lies primarily in manufacturing. The graphical presentation of inter-industry relationship through the “Multiplier Product Matrix” (MPM) and its associated “economic landscape” provides a visualization of the Indonesian economic landscape for selected years and how it has changed over time.
Keywords: economic landscape, structural change, input output model, key sector
INTRODUCTION
The1 more serious and well-planned eco-nomic development in Indonesia started at the beginning of the implementation of The First Five Year Development Plan (Pelita I) in 1969, and the process had gone smoothly from then until the economic crisis occurred in 1997-1998. Economic growth becomes one of
1 This paper has been awarded as the first runner up
winner of JIEB Best Paper Award 2011.
growth trigger factor. Structural transforma-tion is a scientific phenomenon that has to be experienced by every growing economy.
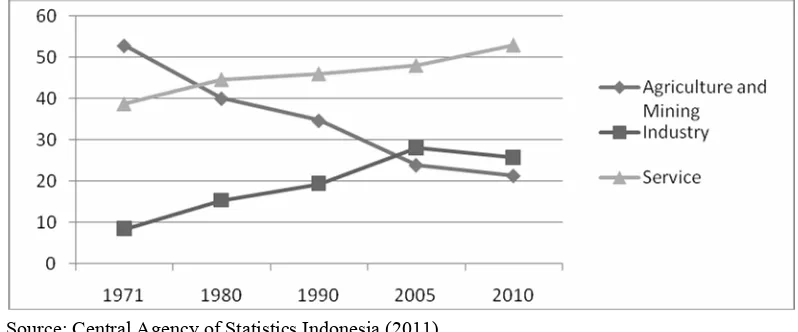
The data of the Central Agency of Statis-tics Indonesia (BPS-Badan Pusat Statistik) shows changes in the economic landscape in Indonesia, which is in accordance with the development rate of economic growth. Eco-nomic growth measured from GDP (Gross Domestic Product) growth is assumed to be the cause of structural transformation in Indonesia’s economy during a given time period (Kurniawan, 2011). GDP structural change as illustrated in Figure 1 is the result of industrialization in Indonesia (Kuncoro, 2007).
The industrialization process in Indonesia has begun since the end of 1980 (Dasril, 1993; Firdaus, 1998) and, based on the criteria of United Nation Industrial Development Organi-zation, became part of the semi-industrial country category until 2008. The regional growth theory stated by Kaldor in Dasgupta and Singh (2006) remarks that the manufactur-ing sector is the engine of growth for a country or region. This theory has prompted many countries to perform industrialization to obtain rapid economic growth.
However, the phenomenon that has
oc-curred in Indonesia’s economy since 2002 clearly shows signs of the de-industrialization process (Ruky, 2008). The data from BPS shows that in 2004 the contribution of the industry sector to Indonesia’s GDP reached the highest level of 28.37 percent, while agriculture contributed only 14.9 percent. However, the contribution of industry de-creased until 2010, becoming only 25.76 per-cent of Indonesia’s GDP and its growth was lower than the total GDP growth (BPS, 2011).
Based on the Kaldorian approach analysis conducted by Dewi (2010), it can be con-cluded that the manufacturing sector has become the engine of economic growth during the industrialization stage and spurred the development of sectors other than manufactur-ing. However, the de-industrialization process has been moving towards negative direction since 2002, marked by, among others, the low trade balance. De-industrialization that has occurred is not the natural impact of a highly advanced development process, but it is more due to the shock in Indonesia’s economy.
Factors that cause structural change are very different for each region. Structural change can be caused by the impact of a pol-icy, changes in resources, population, and so-cial conditions that have permanent
charac-Source: Central Agency of Statistics Indonesia (2011)
teristics. Many agree that one of the necessary conditions to achieve structural transformation from agriculture (primary) to industry (secon-dary) is the strong linkage of agriculture and industrial sectors (Kuncoro, 1996). The impor-tant implication from the structural change of Gollin et al. (2002) developed from the neo-classical growth model is that the productivity growth of the agriculture sector is the signifi-cant key of the growth process. Various theo-ries have explained how the linkage between sectors affects the economy of a country; some of them are deduction from Mellor and Lele (1973), Mellor (1976; 1986; 1989) that is fa-mous for the rural led strategy of growth model, and Johnston and Kilby (1975) that developed the concept of agricultural and structural transformation model.
The question is whether fundamental structural changes in Indonesia’s economy have occurred in line with the economic growth. What is the role of sectors in the struc-tural transformation process in Indonesian economy? Which economic sectors have high inter-sectors linkage and become the keys in Indonesian economy? This study aims to con-duct an empirical study on the changes of the economic landscape in Indonesia using the input output (IO) model framework during the period of 1971 to 2008. In particular, this study aims to identify and analyze the dynam-ics of the key sectors in the structural transfor-mation process of Indonesia’s economy.
Research Method
The study was conducted by reviewing Indonesian IO tables from BPS, covering data 1971, 1975, 1980, 1985, 1990, 1995, 2000, 2005 and 2008.
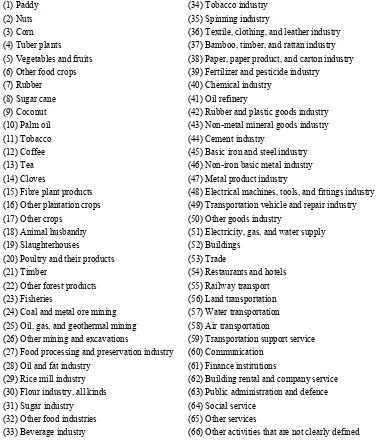
The sectors in the IO data series are uni-formly aggregated (common set) into 66 sec-tors referring to the classification in the IO Table Year 2008 to see the comparison be-tween observation years and support the purpose of analysis. The main data used in this study originates from total transaction based
on the producer’s price table. The list of sec-tors’ name and code can be seen in Table 1.
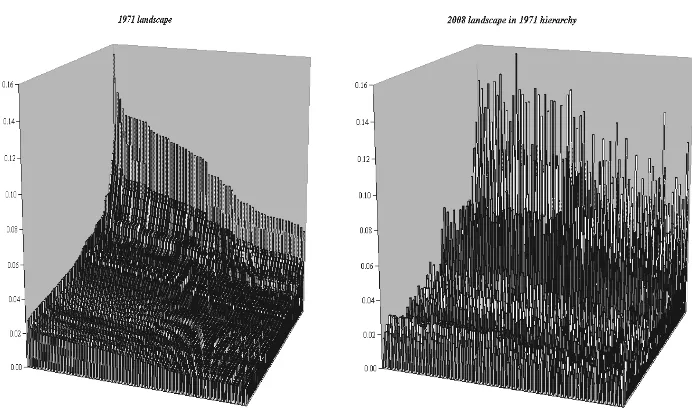
The analysis method used in this study will describe the linkages between sectors in the economic structural transformation process in Indonesia. The result of the Multiplier Prod-uct Matrix is presented in a three-dimensional graph to visualize economic landscape. The Multiplier Product Matrix (MPM) is a matrix that shows the value of first order-intensity and field of influence of the whole cells, which explains the first occurring reaction in the field of influence of each cell, if there is a change in a cell of the Leontief Inverse Matrix due to external shock (Jiem In and Planting, 2000). The MPM values illustrate the role of a sector in the economy. The MPM of each pe-riod that is arranged in a series according to the 1971 hierarchy shows the economic struc-tural change process during the analysis pe-riod. The MPM of each period that is arranged according to the hierarchy of the previous period describes the final change that shapes the afore-mentioned economic landscape.
RESULTS AND DISCUSSION
Key Sector Dynamics
2008. Other industrial sectors that had become the key sectors are “fertilizer and pesticide industry (39)” from 1980 to 2008; “chemical industry (40)” in 1971, 1975, and from
2000-2008; “oil refinery (41)” in 1971-1990; and “rubber and good products (42)” in 1975, 1985, and from 1995-2008.
Table 1. Sector Classification in the Input Output Table of Indonesia 1971-2008
(1) Paddy (34) Tobacco industry
(2) Nuts (35) Spinning industry
(3) Corn (36) Textile, clothing, and leather industry
(4) Tuber plants (37) Bamboo, timber, and rattan industry
(5) Vegetables and fruits (38) Paper, paper product, and carton industry
(6) Other food crops (39) Fertilizer and pesticide industry
(7) Rubber (40) Chemical industry
(8) Sugar cane (41) Oil refinery
(9) Coconut (42) Rubber and plastic goods industry
(10) Palm oil (43) Non-metal mineral goods industry
(11) Tobacco (44) Cement industry
(12) Coffee (45) Basic iron and steel industry
(13) Tea (46) Non-iron basic metal industry
(14) Cloves (47) Metal product industry
(15) Fibre plant products (48) Electrical machines, tools, and fittings industry
(16) Other plantation crops (49) Transportation vehicle and repair industry
(17) Other crops (50) Other goods industry
(18) Animal husbandry (51) Electricity, gas, and water supply
(19) Slaughterhouses (52) Buildings
(20) Poultry and their products (53) Trade
(21) Timber (54) Restaurants and hotels
(22) Other forest products (55) Railway transport
(23) Fisheries (56) Land transportation
(24) Coal and metal ore mining (57) Water transportation
(25) Oil, gas, and geothermal mining (58) Air transportation
(26) Other mining and excavations (59) Transportation support service
(27) Food processing and preservation industry (60) Communication
(28) Oil and fat industry (61) Finance institutions
(29) Rice mill industry (62) Building rental and company service
(30) Flour industry, all kinds (63) Public administration and defence
(31) Sugar industry (64) Social service
(32) Other food industries (65) Other services
(33) Beverage industry (66) Other activities that are not clearly defined
Besides those, there are also several heavy industries that become the key sectors which are “basic iron and steel industry (45)” in almost throughout the observation period except in 1975; “non-iron basic metal industry (46)” in 1971, 1990, and 1995; “metal pro-ducts industry (47)” from 1971-1985; “elec-trical machines, tools, and fittings industry (48)” in 1971, 1975 and from 2000-2008; and “transportation vehicles and repairs industry (49)” sector in 1971, 1975, 1985 and 1990.
“Trade (53)” sector was a tertiary sector that only became a key sector in 2008, and is different from “other services (65)” sector that had become a key sector from 1975 to 2008; while “restaurants and hotels (54)” only became a key sector in 1971. Another tertiary sector that became a key sector is the “land transportation (56)” sector in 1980, 1985 and from 2000-2008.
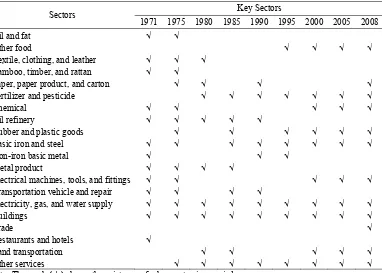
Table 2 shows 20 (twenty) sectors that have become the key sectors during the analysis period. Key sectors that survived the crisis (after 2000) maintained their position in the next period. Industrial sectors that process agriculture products were unable to survive as key sectors, except for “rubber and plastic goods industry (42)” sector.
Multiplier Product Matrix
The Multiplier Product Matrix (MPM) that is graphically illustrated shows the economic landscape change in Indonesia from 1971 to 2008. Quantitative measurement variation on inter-sector relations derived from MPM can be arranged based on a certain hierarchy, where FL values are ranked from the smallest value and BL values are graded from the biggest value.
Table 2. The Key Sectors of Indonesia’s Economy
Key Sectors Sectors
1971 1975 1980 1985 1990 1995 2000 2005 2008
Oil and fat √ √
Other food √ √ √ √
Textile, clothing, and leather √ √ √
Bamboo, timber, and rattan √ √
Paper, paper product, and carton √ √ √ √
Fertilizer and pesticide √ √ √ √ √ √ √
Chemical √ √ √ √ √
Oil refinery √ √ √ √ √
Rubber and plastic goods √ √ √ √ √ √
Basic iron and steel √ √ √ √ √ √ √ √
Non-iron basic metal √ √ √
Metal product √ √ √ √
Electrical machines, tools, and fittings √ √ √ √ √
Transportation vehicle and repair √ √ √ √
Electricity, gas, and water supply √ √ √ √ √ √ √ √ √
Buildings √ √ √ √ √ √ √ √ √
Trade √
Restaurants and hotels √
Land transportation √ √ √ √ √
Other services √ √ √ √ √ √ √ √
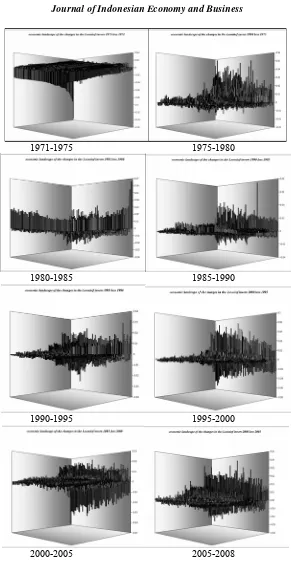
Figure 2 provides the visualization of Indonesia’s economic landscape in the years 1971 and 2008 based on the 1971 hierarchy2. The highest cell in 1971 hierarchy is (53;66) and the lowest is (63;63). “Trade (53)” sector has the highest IFL and “others (66)” sector has the highest IBL. In the early period of the study, “public administration and defense (63)” sector has the lowest linkage index. The graph shows that there are changes in the eco-nomic landscape of Indonesia from 1971 to the year 2008, where the economic landscape visualization is not as smooth as in 1971, even though there is no drastic change. The height differences of the bar graphs in each cell for both periods show the existence of linkage
2 Sector sequence:
FL (sort ascending)
63;16;3;5;17;6;13;4;19;64;33;55;50;44;57;29;22;11;12; 60;20;27;58;30;43;10;31;32;14;2;26;34;8;59;35;15;42;3 9;62;9;21;37;46;18;23;47;7;28;54;66;48;52;49;36;61;24 ;38;45;51;40;65;1;56;25;41;53.
BL (sort descending)
66;45;36;47;55;40;42;33;54;39;52;48;35;28;46;29;34;49 ;30;51;31;37;57;32;41;27;60;58;38;19;43;56;65;61;24;6 4;13;8;10;62;59;21;11;7;26;53;17;2;12;6;23;15;18;16;1; 3;20;25;4;14;9;22;5;63.
changes between inter-sectors with other sec-tors or structural changes in the economy. Structural changes can be seen in more detail in the discrepancy of MPM rate for each cell. Cells with fairly big discrepancy value indicate a relatively large change in the inter-action between those sectors in the economy.
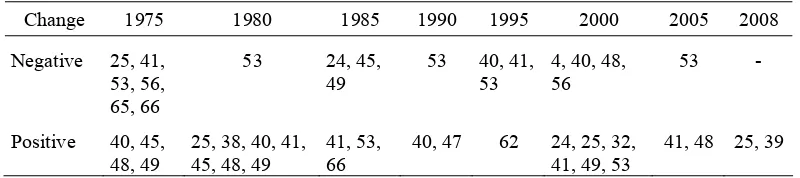
Occurring changes, among others, are linked to the sectors as seen in Table 3. Rela-tively significant negative changes almost always take place on MPM cells related to “trade (53)” sector. This shows that the trade sector’s role tends to decrease in the economy. Meanwhile, significant positive changes occur in several cells that, among others, are linked with “oil, gas, and geothermal mining (25)” sector; “oil refinery (41)”; “electrical tools and fittings industry (48)”; and “transportation vehicle and repair industry (49)”. Figure 3 shows the changes that occur in the economic landscape of Indonesia from 1971 to 2008.
The decrease of roles can be seen, among others, in several cells related to ”paddy (1)”, ”trade (53)”, ”land transportation (56)”, and ”other activities that are not clearly defined (66)” sectors. The increase of roles during the
time period of 1971 to 2008, among others, is related to two primary sectors, which are ”coal and metal ore mining (24)” and ”oil, gas, and geothermal mining (25)”. This increase is also connected with ”fertilizer and pesticide indus-try (39)”, ”chemical indusindus-try (40)”, ”oil refin-ery (41)”, and ”electrical tools and fittings industry (48)” sectors. Tertiary sectors that are linked to the increase of role are “finance insti-tutions (61)” and “building rental and com-pany service (62)” sectors.
The role of “oil, gas, and geothermal min-ing (25)” and “oil refinery (41)” sectors declined in 1975, but their role rose again in 1980 and it never indicates any decrease in roles until the end of observation period. The role of “coal and metal ore mining (24)” sector increased in 2000, in line with the increase of newly found mineral resources’ exploration. “Chemical industry (40)” sector had a signifi-cant increase in role during 1975 to 1990 period, but it was declining during the period after 1995.
CONCLUSION
From the historical input output data, in-ter-sectoral linkages did not appear among the primary sectors. Thus, they never became the key sectors in Indonesia’s economy, and even some sub-sectors have relatively high foreign trade dependence. Most secondary sectors don’t have high linkages with primary sectors. Sectors that survived the economic crisis have the tendency to stay as key sectors. Based on the visualization of the economic landscape
change, the increase in role occurs, among others, related with two primary sectors, which are ”coal and metal ore mining (24)” and ”oil, gas, and geothermal mining (25)”. This in-crease is also associated to the ”fertilizer and pesticide industry (39)”, “chemical industry (40)”, “oil refinery (41)”, and “electrical tools and fittings industry (48)” sectors. Tertiary sectors that are linked with the increase of role are “finance institutions (61)” and “building rental and company service (62)” sectors.
The high distribution capacity of secon-dary sectors that is not ensued by high sen-sitivity degree of the primary sectors indicates that there is no link and match between devel-oped industry and available raw material resources. The not-so-precise industrialization strategy causes the de-industrialization process in Indonesia to move unnaturally and tend to be negative. It is better for the industrialization policy to consider the link and match between developed industries and available raw mate-rial resources.
POLICY IMPLICATION
The results of this study show that the role of industry had decreased in Indonesia’s GDP, and only a few industry sectors had an increased role during the observation period. Pertaining to de-industrialization, it can be concluded from several authors (Rowthorn and Ramaswamy, 1997; Pitelis and Antonakis, 2003), that de-industrialization could be seen in a positive light if it is a part of economic maturity.
Table 3. The (Significant) Changes of the Sectoral Role between Periods
1971-1975 1975-1980
1980-1985 1985-1990
1990-1995 1995-2000
2000-2005 2005-2008
In Indonesia’s condition, where the growth rate of the non-oil and gas industry was merely 4.4 percent during the period of 2006-2010 while the national economic growth was 5.5 percent, it could be said that de-industrialization, which may be seen a negative phenomenon, has happened. Related to the analysis in this paper, it is apparent that there is still an opportunity to increase the industries’ productivity, for example by strengthening linkages with primary sectors, especially agriculture. The value added of agricultural export, especially in the primary form, could be augmented through the development of domestic processing indus-tries. For example, in the oil palm industry alone, Indonesia has been exporting Crude Palm Oil only, which is processed further and re-exported by the destination countries such as Malaysia. It is obvious that the sectors cluded in this industry do not show an in-creased role during the observation period.
REFERENCES
Badan Pusat Statistik. 2007. Table Input Out-put Indonesia Year 2005. Jakarta: Badan Pusat Statistik.
Dasgupta, S., Singh A. 2006. “Manufacturing, Service, and Premature Deindustrializa-tion in Developing Countries: A Kaldorian Analysis”. Research Paper United Nation University, 49, 1-18.
Dasril, A.S.N., 1993. Pertumbuhan dan Pe-rubahan Struktur Produksi Sektor Perta-nian dalam Industrialisasi di Indonesia, 1971-1990 [Growth and Changes in Pro-duction Sector of Agriculture in Indone-sian Industrialization 1971-1990]. Bogor: Bogor Agricultural University Doctoral Thesis.
Dewi, D.A., 2010. Deindustrialization in Indo-nesia 1983-2008: Kaldorian Approach. Bogor: Bogor Agricultural University Master Thesis.
Felipe, J., 1998. “The Role of Manufacturing Sector in Southeast Asian Development:
A Test of Kaldor’s First Law”. Journal Post Keynessian Economics, 20(3), 463-485.
Firdaus, M., 1998. Peran Sektoral dalam Pem-bangunan Nasional: 1975-1995 [Sectoral Role in National Development of Indone-sia: 1975-1995]. Bogor: Bogor Agricul-tural University Master Thesis.
Gollin, D., Parente S., and Rogersen R., 2002. “The Role of Agriculture in Devel-opment”. American Economic Review, 92 (2), 160-164.
Jiemin, G. and M.A. Planting, 2000. “Using Input-Output Analysis to Measure U.S. Economic Structural Change Over a 24 Year Period”. Paper Presented at the 13th Inter-national Conference on IO Tech-nique. Macerata, Italy.
Johnston, B.F. and P. Kilby, 1975. Agriculture and Structural Transformation: Economic Strategies in Late Developing Countries. New York: Oxford University Press. Kuncoro, M., 1996. “Analisis
Struktur-Peri-laku-Kinerja Agroindustri di Indonesia: Suatu Catatan Empiris [Structure-Con-duct-Performance Analysis of Agroindus-try in Indonesia: an Empirical Note]”. Kelola Gadjah Mada University Business Review, 6 (11), 17-28.
Kuncoro, M., 2007. Ekonomika Industri Indonesia, Menuju Negara Industri Baru 2030? [Economics of Indonesian Industry, toward New-Industrial Nation 2030?]. Yogyakarta: Andi.
Mellor, J.W., 1976. The New Economies of Growth: A Strategy for India and the De-veloping Countries. Cornell: Cornell University Press.
Mellor, J.W., 1986. Agriculture on the Road to Industrialization in John P. Lewis and Valeriana Kallab: Development Strategies Reconsidered. Washington: Overseas Development Council.
Mellor, J.W., Lele U., 1973. “Growth Link-ages of the New Foodgrain Technolo-gies”. Indian Journal of Agricultural Eco-nomics, 28(1),19-37.
Pitels, C., Antonakis, N., 2002. “Manufactur-ing and Competitiveness: the Case of Greece”. Journal of Economic Studies, 30(5), 535-547.
Rowthorn, R.E., R.Ramaswamy, 1997. “Dein-dustrialization: Its Causes and
Implica-tions”. IMF Working Paper, No. 97/WP/ 42.