RADIOMETRIC CORRECTION OF MULTITEMPORAL HYPERSPECTRAL UAS
IMAGE MOSAICS OF SEEDLING STANDS
L. Markelin a, *, E. Honkavaara a, R. Näsi a, N. Viljanen a, T. Rosnell a, T. Hakala a, M. Vastaranta b, T. Koivisto b, M. Holopainen b
a Finnish Geospatial Research Insitute, Geodeetinrinne 2, 02430 Masala, Finland - (lauri.markelin, eija.honkavaara, roope.nasi, niko.viljanen, tomi.rosnell, teemu.hakala)@nls.fi
b Department of Forest Sciences, University of Helsinki, FI-00014 Helsinki, Finland (mikko.vastaranta, tomi.koivisto,
markus.holopainen)@helsinki.fi
Commission ΙΙI, WG III/4
KEY WORDS: Hyperspectral, radiometric correction, calibration, reflectance, seedling stands, unmanned aerial systems, remote sensing, automation
ABSTRACT:
Novel miniaturized multi- and hyperspectral imaging sensors on board of unmanned aerial vehicles have recently shown great potential in various environmental monitoring and measuring tasks such as precision agriculture and forest management. These systems can be used to collect dense 3D point clouds and spectral information over small areas such as single forest stands or sample plots. Accurate radiometric processing and atmospheric correction is required when data sets from different dates and sensors, collected in varying illumination conditions, are combined. Performance of novel radiometric block adjustment method, developed at Finnish Geospatial Research Institute, is evaluated with multitemporal hyperspectral data set of seedling stands collected during spring and summer 2016. Illumination conditions during campaigns varied from bright to overcast. We use two different methods to produce homogenous image mosaics and hyperspectral point clouds: image-wise relative correction and image-wise relative correction with BRDF. Radiometric datasets are converted to reflectance using reference panels and changes in reflectance spectra is analysed. Tested methods improved image mosaic homogeneity by 5% to 25%. Results show that the evaluated method can produce consistent reflectance mosaics and reflectance spectra shape between different areas and dates.
* Corresponding author
1. INTRODUCTION
Drones equipped with various sensors can be used for collecting dense point clouds and spectral information over small forested areas, such as single stands or sample plots. If this data could be processed and interpreted automatically, drones could be used for supporting large-area inventories or stand-wise assessments by replacing part of the required field work. Stands early development is crucial for future growth and yield and thus information on seedling stands is required to allocate management actions. In seedling stands, the mean tree height is < 7 m in Scots pine and Norway spruce stands and < 9 m in birch stands as the optimal stem number should be between 1500-1800 trees per hectare (TPI). However, there is usually large variation in TPI as well as in tree species within stand. Remote sensing methods traditionally used in forest inventories, such as aerial imaging or airborne laser scanning (White et al. 2016) have not been able to characterize seedling stands with sufficient accuracy for operational forest management. In addition, seedling stands are laborious to assess in the field. The fundamental research question in our project is to study what is the potential of high-resolution hyperspectral and photogrammetric datasets collected using low-cost drones in automatic determination of the tree species, TPI and mean tree height of seedling stands that are the key attributes for determining the management actions, such as precommercial thinnings or re-plantings.
2. METHODOLOGY
2.1 Test site
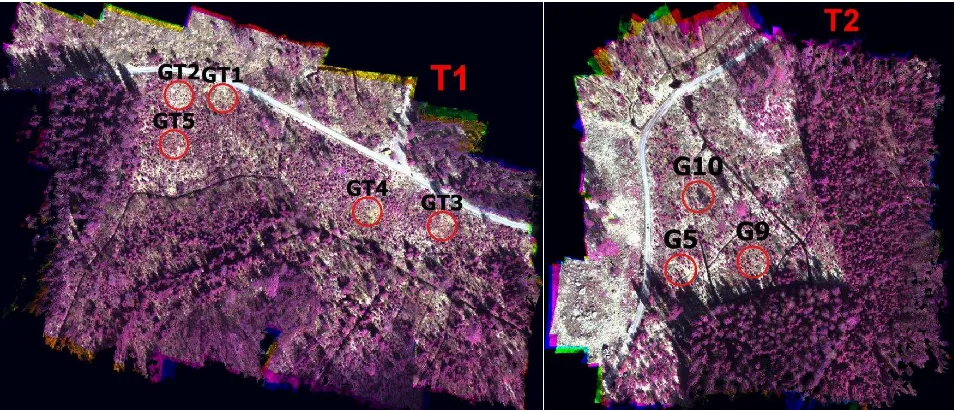
The study area is located in Evo, southern Finland (61.19°N, 25.11°E) and belongs to the southern Boreal Forest Zone. For this study, two seedling stand areas were used (named T1 and T2, Error! Reference source not found.). Their sizes are approximately 250 m x 200 m (T1) and 200 m x 200 m (T2). For target reflectance analysis, fixed-radius (8 m for T1 and 10 m for T2) circular sample plots were used. Additionally, individual pixels of vegetated locations were analysed.
.
2.2 Remote sensing data sets
Remote sensing data captures were carried out with a professional drone equipped with a hyperspectral camera based on Fabry-Pérot interferometer (FPI) (Saari et al., 2013) and a good quality RGB camera. The FPI technology provides spectral data cubes with a rectangular image format, but each band in the data cube has a slightly different position and orientation. Sensor provides an image size of 1,024 × 648 pixels with a pixel size of 11 μm. The field of view (FOV) is ±18° in the flight direction, ±27° in the cross-flight direction and ±31° at the format corner. In this study, filter with wavelength range of 500–900 nm was used resulting 36 separate bands. The spectral resolution range is 10–40 nm at the full width at half maximum (FWHM), and it is dependent on the FPI air gap value, as well as the filter selection. More details of the imaging sensor and UAV system are given in Honkavaara et al. 2013 and 2016.
The UAV flights were carried out in two epochs in 11 May (spring) and 29 July (summer), 2016. In all cases the flight height was 100 m from the ground level which provided ground sampling distance (GSD) of 10 cm for the FPI. The flight speed was 3 m/s thus the movement during single data cube was 4.3 m. The data sets are described in Table 1. Illumination conditions over area T1 were bright on both campaigns. At area T2, illumination conditions were bright on
spring campaign and cloudy/overcast on summer campaign (Figure 2).
Area T1 T2
Season Spring Summer Spring Summer
Date 11.5. 29.6. 9.5. 29.6.
Time (UTC+3) 11:41 15:11 11:31 13:12
SunZen 46° 42° 47° 38°
SunAz 148° 218° 145° 176°
No. Images 124 188 151 95
Conditions Bright Bright Bright Overcast
Processing BRDF BRDF BRDF RELA
Table 1. 2016 UAS Campaign data used in this study. SunZen = sun zenith angle, SunAz = sun azimuth angle. No. Images = number of images used in image mosaic. Processing = final
method used in radiometric processing.
image number from the beginning of each campaign. Irradiance values over 10000 indicate clear sunny conditions, values
below 6000 cloudy conditions.
For the reflectance transformation purposes reflectance panels of size of 1 m x 1 m and nominal reflectance of 0.03, 0.10 and 0.50 were positioned near the drone take off place. An ASD FieldSpec Pro with a cosine collector optics was installed near to take off place to make irradiance measurements during the flights. Irradiance plots for each data set are shown in Figure 2. Georeferencing was carried out using Agisoft Photoscan and Pix4D software and supported by ground control points (GCP) and GNSS trajectory data collected on-board UAS. RGB house developed RadBA-software (Honkavaara et al. 2012, 2013, 2014a). The objective of the radiometric correction was to create calibrated reflectance mosaics. The radiometric correction approach is based on modelling different factors impacting the image DNs. The current model includes the sensor corrections, the atmospheric correction, correction for the illumination changes and other nonuniformities, and the normalization of illumination and viewing direction related nonuniformities. When available, parameters determined in laboratory are used.
Before any radiometric processing, individual images with drastically different irradiance values compared other images were manually removed. For example, images recorded at bright conditions at the beginning and end of T2 summer campaign were removed, and only images taken in full overcast conditions were used. This step eases the automatic radiometric block adjustment phase as average image DNs of one block are closer to each other.
First step in radiometric processing is to choose reference image that includes the reflectance panels located at the image centre. Illumination conditions and subsequently the DN values on the reference image should present the desired conditions on final mosaic, as the reference image will keep its original DN values during the radiometric processing. In the radiometric block adjustment phase, image DNs or radiance values of radiometric tie points between images are used as observations, and unknown parameters are solved using weighted least squares method. Prior to processing, relative parameter a, describing illumination level differences between images, and its expected standard deviation is set for each image and band. It stays 1 for reference image during the processing, but is adjusted for other images according to radiometric block adjustment. If the illumination conditions varied significantly during the imaging campaign, irradiance data measured on ground or abroad UAS can be used as initial values for parameter a (Hakala et al. 2013). Results of this relative processing, called RELA in this paper, are band-wise image mosaics with the following statistics: adjusted parameter a for each image, standard deviation of image mosaic DNs before and after processing, and homogenization factor describing the lowering of the image mosaic DN standard deviation in percentage.
Additional processing option is to use BRDF-correction. It uses solar zenith and azimuth angles during the campaign to calculate sun position and assumes directional illumination from the sun. Three parameter BRDF-model is fitted to the data based on imaging and illumination geometry to compensate differences in DNs caused by the BRDF-effects. Detailed description of the BRDF-model is given in Honkavaara et al. 2013. As the used BRDF-correction model assumes directional illumination and viewing geometry, it does not work under overcast conditions with only diffuse light.
All data sets were processed using two different radiometric correction options: relative correction based on a reference image (RELA), and relative correction with additional BRDF-correction (BRDF). Best option was then chosen based on homogenization factors per mosaic (Error! Reference source not found., Figure 3).
Final step of the processing is atmospheric correction. In this study, empirical line -method was used to convert image mosaic DNs to ground reflectance. Currently, reflectance conversion can be performed using either two or three reflectance panels. Using three panels gives accuracy statistics for the linear fit between image DNs and reflectance values, such as r2 and standard error of the estimate. Based on these statistics it can be seen if the brightest panel has been saturated or not. In this study, the brightest reflectance panel was saturated on most of the visible bands, so two panels were used in reflectance conversion for all data sets. Conversion parameters were calculated independently for each band.
3. RESULTS AND CONCLUSIONS
Figure 3. Image mosaic DN homogenization improvement per band of each data set after radiometric correction. FPI band
centre wavelengths are marked with circles and triangles.
The variability of relative parameter a after radiometric processing gives an idea on how much DN variability there was between images of one block. Relative parameter a from each data processing is shown in Figure 4. As illumination conditions were relatively stable during image collection of each campaign (Figure 2), and images collected at drastically different illumination conditions were manually removed beforehand, there were no need for big adjustments for any image. Largest variations from unity were 0.5 for T1 summer data set. The bowl-shaped effect for a in T2 summer data set is because the illumination conditions were bright just before and after the campaign and fully overcast during it. Still the illumination levels were slightly different at the beginning and end of the campaign compared to middle of the campaign.
Figure 4. Image-wise relative parameter a, all processing versions. Plots for T2 spring, T1 summer and T1 spring are sifted by 0.4, 0.8 and 1.2 respectively. X-axis is image number
for each block.
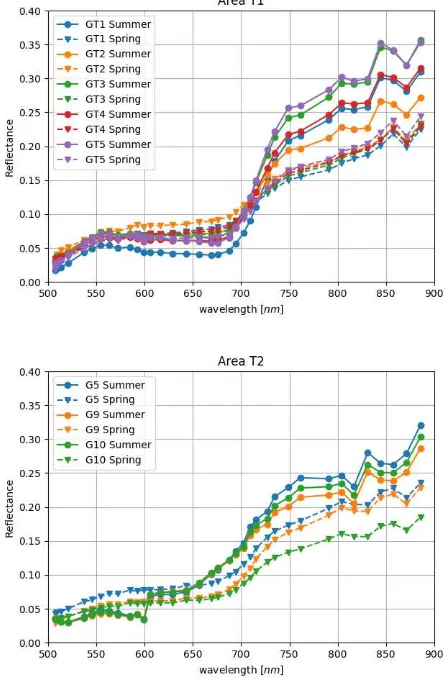
Each circular test plot consists of young seedlings and varying amount of low understory and bare ground. Average reflectance of the whole circular plot was calculated for each test plot (Figure 5). Shapes of the reflectance spectra are typical for vegetation with rapid change in reflectance values on the red edge region between 680 nm and 730 nm in the near infrared range. Amount of green vegetation has clearly risen between spring and summer data sets as the reflectance values of summer data are higher in the near-infrared area (wavelengths over 700 nm) compared to spring reflectance spectra values.
Unnatural spikes in reflectance spectra shape around 820 nm and 870 nm are either due to sensor instability, inaccuracy of sensor calibration or inaccuracies in radiometric processing. Spike at 600 nm for T2 summer data set is related to challenges in radiometric processing in overcast conditions, as it is not visible on other data sets.
Sample reflectance spectra of individual trees measured from all four data sets are shown in Figure 6. It can be seen that the spectra from spring data from both areas are almost identical. This indicates that the radiometric processing is able to produce consistent results between different data sets.
Figure 6. Reflectance spectra of individual trees, 3x3 pixel area.
First results from radiometric processing of multitemporal hyperspectral UAS data sets show that the used methodology with in-house developed RadBA-software is able to reduce between-image DN differences on image mosaics, and it can produce consistent reflectance mosaics between different areas and dates. Further studies are needed to analyse the performance of the methodology in cloudy overcast conditions as well as in varying illumination conditions, and when supporting irradiance measurements are used to assist radiometric block adjustment. The use of reflectance panels is not feasible in some campaigns. Method to use on-board irradiance measurements and radiometrically calibrated radiance data from hyperspectral sensor to calculate target reflectance without any ground reference is currently under development. In the further study the usability of these hyperspectral datasets, individually and together with 3D RGB point clouds, in characterizing seedling stands will be evaluated.
Accurate radiometric block adjustment should improve the usability of hyperspectral drone images in various applications such as individual tree detection and recognition (Nevalainen et al. 2017), forest health and pest insect detection (Näsi et al. 2015), precision agriculture and water quality monitoring (Honkavaara et al. 2014b).
ACKNOWLEDGEMENTS
The research carried out in this study was financially supported by the Academy of Finland (Project No. 273806) and the MMM project “Taimikoiden tiedonkeruun kehittäminen”
REFERENCES
Chandelier, R., Martinoty, G., 2009. Radiometric aerial triangulation for the equalization of digital aerial images and orthoimages. Photogrammetric Engineering & Remote Sensing, 75(2): 193-200; doi: 10.14358/PERS.75.2.193
Collings, S., Cacetta, P., Campbell, N., Wu, X. 2011. Empirical models for radiometric calibration of digital aerial frame mosaics. IEEE Transactions on Geoscience and Remote Sensing, 49(7): 2573-2588; doi: 10.1109/TGRS.2011.2108301
Hakala, T., Honkavaara, E., Saari, H., Mäkynen, J., Kaivosoja, J., Pesonen, L., Pölönen, I., 2013: Spectral imaging from UAVs under varying illumination conditions. The International Archives of Photogrammetry, Remote Sensing and Spatial
Information Sciences, XL-1/W2, 189-194, doi:
10.5194/isprsarchives-XL-1-W2-189-2013
Honkavara, E., Hakala, T., Saari, H., Markelin, L., Mäkynen, J., Rosnell, T., 2012. A process for radiometric correction of UAV image blocks. Photogrammetrie - Fernerkundung - Geoinformation (PFG), vol. 2012, no. 2.
Honkavaara, E., Saari, H., Kaivosoja, J., Pölönen, I., Hakala, T., Litkey, P., Mäkynen, J., Pesonen, L., 2013. Processing and Assessment of Spectrometric, Stereoscopic Imagery Collected Using a Lightweight UAV Spectral Camera for Precision Agriculture. Remote Sensing, 2013, 5, pp. 5006-5039, doi: 10.3390/rs5105006
Honkavaara, E., Markelin, L., Hakala, T., Peltoniemi, J., 2014a. The Metrology of Directional, Spectral Reflectance Factor Measurements Based on Area Format Imaging by UAVs. Photogrammetrie - Fernerkundung - Geoinformation (PFG), vol. 2014, no. 3, pp. 175–188, June, 2014.
Honkavaara, E., Hakala, T., Markelin, L., Jaakkola, A., Saari, H., Ojanen, H., Pölönen, I., Tuominen, S., Näsi, R., Rosnell, T., and Viljanen, N., 2014b. Autonomous hyperspectral UAS photogrammetry for environmental monitoring applications. The International Archives of Photogrammetry, Remote Sensing and Spatial Information Sciences, XL-1, 155-159, doi: 10.5194/isprsarchives-XL-1-155-2014
Honkavaara, E., Hakala, T., Nevalainen, O., Viljanen, N., Rosnell, T., Khoramshahi, E., Näsi, R., Oliveira, R., and Tommaselli, A., 2016. Geometric and reflectance signature characterization of complex canopies using hyperspectral stereoscopic images from UAV and terrestrial platforms. The International Archives of Photogrammetry, Remote Sensing and Spatial Information Sciences, XLI-B7, 77-82, doi: 10.5194/isprs-archives-XLI-B7-77-2016
Nevalainen, O., Honkavaara, E., Tuominen, S., Viljanen, N., Hakala, T., Yu, X., Hyyppä, J., Saari, H., Pölönen, I., Imai, N.N., Tommaselli, A.M.G., 2017. Individual Tree Detection and Classification with UAV-Based Photogrammetric Point Clouds and Hyperspectral Imaging. Remote Sensing, 9, 185; doi: 10.3390/rs9030185
Näsi, R., Honkavaara, E., Lyytikäinen-Saarenmaa, P., Blomqvist, M., Litkey, P., Hakala, T., Viljanen, N., Kantola, T., Tanhuanpää, T., Holopainen, M., 2015. Using UAV-Based Photogrammetry and Hyperspectral Imaging for Mapping Bark Beetle Damage at Tree-Level. Remote Sensing, 7, 15467-15493; doi: 10.3390/rs71115467
Saari, H., Pölönen, I., Salo, H., Honkavaara, E., Hakala, T., Holmlund, C., Mäkynen, J., Mannila, R., Anttila, T., Akujärvi, A., 2013. Miniaturized hyperspectral imager calibration and UAV flight campaigns. Proc. SPIE 8889, Sensors, Systems,
and Next-Generation Satellites XVII, 88891O; doi:
10.1117/12.2028972
for Enhancing Forest Inventories: A Review. Canadian Journal
of Remote Sensing, Vol. 42, Iss. 5, 2016; doi: