LAND COVER CHANGES DETECTION IN POLARIMETRIC SAR DATA USING
ALGEBRA, SIMILARITY AND DISTANCE BASED METHODS
Amir Najafia, Mahdi Hasanloua* and Vahid Akbarib
a School of Surveying and Geospatial Engineering, College of Engineering, University of Tehran, Tehran, Iran – (amir.najafi, hasanlou)@ut.ac.ir
b Department of Physics and Technology, UiT-The Arctic University of Norway - [email protected]
KEY WORDS:Change detection, Polarimetry, synthetic aperture radar (SAR), algebra-based, distance-based, similarity-based.
ABSTRACT:
Monitoring and surveillance changes around the world need powerful methods, so detection, visualization, and assessment of significant changes are essential for planning and management. Incorporating polarimetric SAR images due to interactions between electromagnetic waves and target and because of the high spatial resolution almost one meter can be used to study changes in the Earth's surface. Full polarized radar images comparing to single polarized radar images use amplitude and phase information of the surface in different available polarization (HH, HV, VH, and VV). This study is based on the decomposition of full polarized airborne UAVSAR images and integration of these features with algebra method involves Image Differencing (ID) and Image Ratio (IR) algorithms with the mathematical nature and distance-based method involves Canberra (CA) and Euclidean (ED) algorithms with measuring distance between corresponding vector and similarity-based method involves Taminoto (TA) and Kulczynski (KU) algorithms with dependence corresponding vector for change detecting purposes on two real PolSAR datasets. Assessment of incorporated methods is implemented using ground truth data and different criteria for evaluating such as overall accuracy (OA), area under ROC curve (AUC) and false alarms rate (FAR). The output results show that ID, IR, and CA have superiority to detect changes comparing to other implemented algorithms. Also, numerical results show that the highest performance in two datasets has OA more than 90%. In other assessment criteria, mention algorithms have low FAR and high AUC value indices to detect changes in PolSAR images.
1.INTRODUCTION
In recent years with the continuous development of technology and resolution on SAR images have been expansively makes to use this system is more practical (Liu et al., 2012b). Developing SAR imaging system, make it possible to use this system in various remote sensing applications such as land use/cover classification, monitoring of urban growth, forest monitoring, and disaster management (Zhong et al., 2015). Change detection in remote sensing aimed to analyze and identify changes in the same geographic area at the different time (Hussain et al., 2013; Seydi and Hasanlou, 2015). PolSARń images due to the interaction
between electromagnetic waves and objects and having the phase and amplitude due to a different scattering mechanisms (surface, double-bounce, and volume scattering) have extra different information from the ground in different polarization (HH, HV, VH, and VV). However, these images because of the interaction of electromagnetic waves and objects at ground level include an inherent speckle noise (Lê et al., 2015). Radar imagery independent from weather condition and can penetrate in clouds and snow and can be operated day and night and these advantage covers the weaknesses of optical images (Lee and Pottier, 2009). In theory, change detection has three important step that the first step is image processing which includes co-registration and reduction speckle noise, the second step is producing change map between multi-temporal images based on different extracted features and implemented different change detection methods and the third
* Corresponding author ńPolarimetric SAR 2Kittler and Illingworth
step is segmenting the change map based on apply decision threshold to the histogram of the change map and preparing change and no-change classes (Gong et al., 2012b).
Change detection methods are classified into supervised and unsupervised methods. Supervised methods collect ground reference information that is expensive and time consuming procedure (Lu et al., 2004). On the other hand, the unsupervised methods without any a priori knowledge information used for change detection applications (Bruzzone and Prieto, 2000). These unsupervised change detection methods includes match-based methods that these methods divided to algebra-based, distance-based, similarity-based algorithms, transformed-based, classification-based, machine learning-based and hybrid of change detection methods (Hussain et al., 2013). This paper presents match-base methods for land cover change detection using PolSAR images.
Magiu Gong et al in 2012 fused mean-ratio and log-ratio images by wavelet networks and used fuzzy clustering algorithm for generating detected change map (Gong et al., 2012b). Meng Liu et al in 2012 used distance measurement and segmentation of images with minimum error method (K&I)2(Kittler and Illingworth, 1986) for measuring distance
log-ratio image for extracting the SIFT key points then incorporated segmentation around the key points in the SAR images and finally, by comparison, the segmented images, generate change detection map (Wang et al., 2016).
As it clears from previous studies, they tried to use some extracted features specifically on the study areas to detect changes. In this study, all features produced based on different decomposition methods using the PolSAR images for two real datasets. In addition, different change detection methods are implemented for comparing results of these methods in different scenarios. This study utilized full polarized radar image of airborne UAVSAR3. Also, as part of this study,
Refined Lee filter applied to reduce speckle noise as well as applied target decomposition on the PolSAR image to provide features. These features include decomposition based on coherency matrix (Huynen, Barnesand etc.) (Lee and Pottier, 2009), eigenvectors of covariance matrix (Holm, Cloude and etc.) (Lee and Pottier, 2009), matrix distribution or coherent theories (Pauli, Touzi and etc) (Lee and Pottier, 2009) and model or incoherent theories(Freeman, Entropy and etc) (Lee and Pottier, 2009). After preparing cube of features, change detection methods implemented on these features. By incorporating the Otsu segmentation algorithm (Otsu, 1979) on final change map, two change and no-changes classes are separated. Finally, for assessing output results overall accuracy (OA), area under the ROC4 curve (AUC) and false alarms rate (FAR) are used. To confirm obtained output results, four different scenarios designed and implemented including the process of normalizing and filtering of feature sets to detect changes. This article includes the following sections. The second section describes study area and datasets. The third section investigates change detection algorithms. The fourth section shows the experimental result and finally section is the conclusion.
2. STUDY AREA AND DATASETS
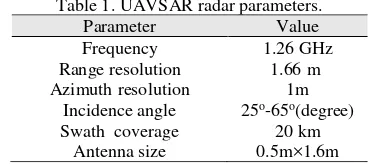
Two pairs of multi-look quad-polarimetric UAVSAR airborne sensor in L-band with ground projection in WGS-84 and number of azimuth and range look is 12×3 that acquired over an urban area in San Francisco city (Figure 1) on 18-September-2009, and 11-May-2015, are used for the experiments. The dataset one have 200200 pixels and the dataset two have 100100 pixels. Table 1 summarizes the characteristics of the UAVSAR instrument and imaging geometry (Fore et al., 2015).
a b c
d e f
3Uninhabited Aerial Vehicle SAR
Figure1. Pauli images of datasets, (a)data1 in 2009, (b) data1 in 2015, (c)ground truth of data1, (d) data2 in 2009,
(e) data2 in 2015, and (f)ground truth of data2.
3. CHANGE DETECTION ALGORITHMS
Change detection algorithms based on the relationship between the vectors or bands corresponding to the data used are divided into the following types.
3.1 Algebra algorithms
These methods are pixel-based and used mathematical operations on images taken at different times and generate change map output (Table 2) (İlsever and Unsalan, 2012).ID and IR based on the subtraction and ratio of features cubes (bandto band) in different times and formation cube of change maps, then selective the best bands as the final change map based on high OA/AUC and low FAR.
3.2 Distance algorithms
These methods by measuring the distance between the spectral vectors in correspond pixels at different times and considering the threshold value make change map output. So that greater distances than the threshold value as a change class and less distance than the threshold value as a no-change class (Table3) (Choi et al., 2010). Here X and Y is corresponding vectors, xi
and yi the numerical values of the pixels, |.| symbole of
absoulate value and n is number of features. For classifying a distance between two X and Y vectors, we must consider the
following rules (Akbari, 2013) (1) distance must be non-negative, i.e , the distance is between the range [0, ∞]. (2) distance between two vectors is symmetric, so that distance between the X and Y is equal the distance between the Y and
X. (3) If X = Y thus a distance equal to zero.
Table 3. Distance-based algorithm.
Distance methods Formula reference
Canberra (CA) �� . = ∑ |�−�|
3.3 Similarity algorithms
Similarity measure is a function which computes the degree of similarity between a pair of objects.all similarity measure should map to the range [-1,1] or [0,1], 0 or -1 shows
minimum similarity (incomatible similarity) and 1 shows maximum similarity (absolute similarity).
These methods by measuring the dependency between the spectral vectors in different times images make change map (Table 4) (Choi et al., 2010). In these algorithms (X.Y)
represent the dot product or scalar product between the corresponding vectors and n is number of features. Also, xi and
yi the numerical values of the pixels in the vectors.
Table 4. Similarity-based algorithm.
Similarity methods Formula reference Kulczynski
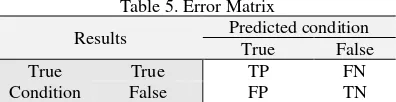
The most important parameters to assess and evaluate results of classification that one of this is overall accuracy (OA) criteria, but change detection used the other assessment criteria to evaluate the results, including the area under the curve (AUC) and false alarms rate (FAR). Accuracy assessment results are presented in the form of error matrix (Table 5). class of interest, TN (True Negative) is correctly classified as not the class of interest, FP (False Positive) is incorrectly classified as the class of interest, and FN (False Negative) is incorrectly classified as not the class of interest (Gong et al., 2012a).Based on the number of pixels specified in the error matrix, the OA, and false alarms rate is defined by the following relationships:
� = � + � + � + �� + � (1)
� � = � + �� (2)
� � =� + �� (3)
The ROC graph shows detection efficiency by plotting vertical axis as TPR (the proportion of true positives) and the horizontal axis as FPR (false positives ratio). This graph classifies two classes of change and no-change based on the ratio between TPR and FPR values (Fawcett, 2006).
4. EXPERIMENT AND RESULTS
For evaluating results of this study four scenarios are designed. The first scenario (S#1) utilized CD methods without pre-processing operation. The second scenario (S#2) utilized CD methods by considering the only normalization of datasets as pre-processing (Ajadi et al., 2016). The third scenario (S#3) utilized CD methods only filtering (Refined Lee filters) (Lee and Pottier, 2009) datasets as pre-processing. Finally, the fourth scenario (S#4) utilized CD methods by
considering both normalization and filtering as pre-processing (Table 6).
The change detection algorithm consists of several steps (Figure 2) which include (a)pre-processing: in this step, the coherency matrix (T3) for multi-date PolSAR datasets registered to each other using ENVI software. Also, as part of this step to reduce speckle noise, the Refined Lee filter is applied to these multi-date PolSAR datasets. (b) Decomposition: by using PolSARpro software(Lee and Pottier, 2009) all features (target decompositions) extracted from filtered and non-filtered PolSAR datasets. Then in this step cube of feature sets is created. (c) Applying change detection algorithms on feature set cubes by incorporating three different approaches (algebra, distance, and similarity-based methods). noise, these methods have weak results. According to Table 7, Figures 3 and 4, the KU and TA algorithms have low OA percentage with low AUC in four scenarios and thus have high FPR. Therefore, these methods (KU and TA) are not suitable for PolSAR changes detection.
a b c d
e f g h
Figure 3. Output change map in KU algorithm for Data1 (a)S#1, (b)S#2, (c)S#3, (d)S#4, and for Data2 (e)S#1, (f)S#2,
(g)S#3, and (h)S#4.
4.2 Distance-base results
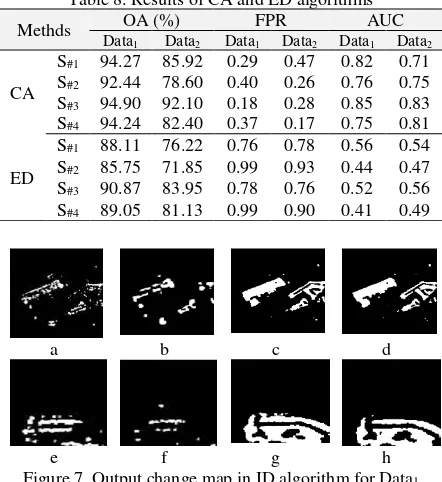
These methods by measuring the distance between corresponding spectral vectors in multi-date images, produce change map. Based on results illustrated in Table 8 and Figures 5 in both datasets, the CA algorithm in scenario S#3 have high OA, high AUC and a low percentage of FPR. Also, due to the meaningless difference of OA for other scenarios, scenario S#3 is the best scenario for detecting changes in PolSAR images. On the other hands, the ED algorithm according to Table 8 and Figure 6 have high OA in S#3 scenario, but high the percentage of FPR and low AUC in this algorithm makes this algorithm unsuitable for the changes detection by investigating all scenarios.
a b c d
e f g h
Figure 5. Output change map in CA algorithm for Data1 (a)S#1, (b)S#2, (c)S#3, (d)S#4, and for Data2 (e)S#1, (f)S#2,
(g)S#3, and (h)S#4.
4.3 Algebra-base results
According to Table 9 and Figure 7, the ID algorithm due to its mathematical nature in both datasets especially in scenario S#3 have high OA, high AUC, and low FPR. Therefore, this algorithm is suitable for detecting changes in PolSAR images. The second algorithm in this category is IR algorithm. According to Table 8 and Figure 8, the IR algorithm in scenario S#4 for both datasets have high AUC, and low FPR. So, this scenario suitable for change detection in PolSAR images.
a b c d
e f g h
Figure 6. Output change map in ED algorithm for Data1 (a)S#1, (b)S#2, (c)S#3, (d)S#4, and for Data2 (e)S#1, (f)S#2,
(g)S#3, and (h)S#4.
Table 8. Results of CA and ED algorithms
Methds DataOA (%) FPR AUC
1 Data2 Data1 Data2 Data1 Data2
CA
S#1 94.27 85.92 0.29 0.47 0.82 0.71 S#2 92.44 78.60 0.40 0.26 0.76 0.75 S#3 94.90 92.10 0.18 0.28 0.85 0.83 S#4 94.24 82.40 0.37 0.17 0.75 0.81
ED
S#1 88.11 76.22 0.76 0.78 0.56 0.54 S#2 85.75 71.85 0.99 0.93 0.44 0.47 S#3 90.87 83.95 0.78 0.76 0.52 0.56 S#4 89.05 81.13 0.99 0.90 0.41 0.49
a b c d
e f g h
Figure 7. Output change map in ID algorithm for Data1 (a)S#1, (b)S#2, (c)S#3, (d)S#4, and for Data2 (e)S#1, (f)S#2,
(g)S#3, and (h)S#4.
Table 9. Results of ID and IR algorithms
Methds DataOA (%) FPR AUC
1 Data2 Data1 Data2 Data1 Data2
ID
S#1 93.73 86.90 0.33 0.40 0.80 0.75 S#2 93.44 84.98 0.41 0.44 0.74 0.74 S#3 95.78 92.12 0.22 0.27 0.82 0.84 S#4 96.12 91.48 0.20 0.33 0.81 0.82
IR
S#1 69.46 81.79 0.72 0.12 0.42 0.81 S#2 90.07 91.19 0.26 0.23 0.82 0.85 S#3 79.22 88.05 0.71 0.03 0.47 0.88 S#4 88.87 92.49 0.06 0.18 0.91 0.89
a b c d
e f g h
Figure 4. Output change map in TA algorithm for Data1 (a)S#1, (b) S#2, (c)S#3, (d)S#4, and for Data2 (e)S#1, (f)S#2,
(g)S#3, and (h)S#4.
Methds DataOA (%) FPR AUC
1 Data2 Data1 Data2 Data1 Data2
KU
S#1 73.41 57.23 0.79 0.85 0.44 0.39 S#2 76.02 51.96 0.83 0.75 0.44 0.40 S#3 75.70 63.11 082 0.89 0.41 0.39 S#4 78.18 58.18 0.85 0.86 0.41 0.38
TA
S#1 67.96 56.27 0.75 0.83 0.44 0.39 S#2 66.78 51.50 0.73 0.74 0.45 0.40 S#3 73.13 63.28 0.77 0.89 0.43 0.39 S#4 72.40 54.92 0.75 0.89 0.43 0.38
a b c d
e f g h
Figure 8. Output change map in IR algorithm for Data1 (a)S#1, (b)S#2, (c)S#3, (d)S#4, and for Data2 (e)S#1, (f)S#2,
6. CONCLUSIONS
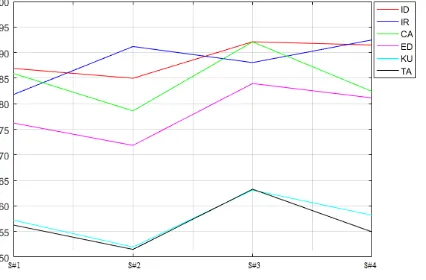
This paper reviews and evaluates different change detection methods using PolSAR UAVSAR images based on producing target decomposition features from two multi-date datasets. In this regards, three different CD categories including algebra, similarity, and distance based methods are implemented. Algebra-based algorithms include the ID and IR methods. Due to mathematical nature, these methods, systematic speckle noise is eliminated. Also, based on Figure 9, 10 for both datasets, the algebra methods provide the same trend in OA, especially in scenarios S#3 ID algorithm and scenarios S#4 for IR algorithm. So this category is suitable for change detection using PolSAR images. The distance-based algorithm involves CA and ED. According to Figures 9 and 10, these methods show the same trend in OA in both datasets in scenario S#3. Also, the ED algorithm has high FPR with low AUC, therefore this method is not suitable for PolSAR change detection purposes. In this category, CA algorithm is an efficient method in all scenarios with high OA, high AUC, and low FPR. The similarity-based methods calculate dependency of corresponding vectors and existence of speckle noise cause decrease in efficiency. Therefore, make low OA, low AUC, and high FPR. This fact is shown in Figures 9 and 10 for all scenarios and in both datasets. Therefore, this category is not suitable for change detection of PolSAR images.
Figure 9 .Trend of OA for CD methods in Data1
Figure 10. Trend of OA for CD methods in Data2
REFERENCES
AJADI, O. A., MEYER, F. J. & WEBLEY, P. W. 2016. Change Detection in Synthetic Aperture Radar Images Using a Multiscale-Driven Approach. Remote Sensing, 8, 482.
V. Akbari, Multitemporal analysis of multipolarization synthetic aperture radar images for robust surface change detection, Ph.D. dissertation, Univ. Tromsø, Tromsø, Norway, 2013.
BRUZZONE, L. & PRIETO, D. F. 2000. Automatic analysis of the difference image for unsupervised change detection.
IEEE Transactions on Geoscience and Remote sensing, 38,
1171-1182.
CHOI, S.-S., CHA, S.-H. & TAPPERT, C. C. 2010. A survey of binary similarity and distance measures. Journal of
Systemics, Cybernetics and Informatics, 8, 43-48.
FAWCETT, T. 2006. An introduction to ROC analysis.
Pattern recognition letters, 27, 861-874.
FORE, A. G., CHAPMAN, B. D., HAWKINS, B. P., HENSLEY, S., JONES, C. E., MICHEL, T. R. & MUELLERSCHOEN, R. J. 2015. UAVSAR polarimetric calibration. IEEE Transactions on Geoscience and Remote
Sensing, 53, 3481-3491.
GONG, M., CAO, Y. & WU, Q. 2012a. A neighborhood-based ratio approach for change detection in SAR images.
IEEE Geoscience and Remote Sensing Letters, 9, 307-311.
GONG, M., ZHOU, Z. & MA, J. 2012b. Change detection in synthetic aperture radar images based on image fusion and fuzzy clustering. IEEE Transactions on Image Processing, 21, 2141-2151.
HUSSAIN, M., CHEN, D., CHENG, A., WEI, H. & STANLEY, D. 2013. Change detection from remotely sensed images: From pixel-based to object-based approaches. ISPRS
Journal of Photogrammetry and Remote Sensing, 80, 91-106.
İLSEVER, M. & UNSALAN, C. 2Ńń2. Two-dimensional
change detection methods: remote sensing applications,
Springer Science & Business Media.ssss
KITTLER, J. & ILLINGWORTH, J. 1986. Minimum error thresholding. Pattern recognition, 19, 41-47.
KULCZY SKI, S. ń928. Die pflanzenassoziationen der
pieninen, Imprimerie de l'Université.
LANCE, G. N. & WILLIAMS, W. T. 1966. Computer programs for hierarchical polythetic classification (“similarity analyses”). The Computer Journal, 9, 60-64.
LÊ, T. T., ATTO, A. M., TROUVÉ, E., SOLIKHIN, A. & PINEL, V. 2015. Change detection matrix for multitemporal filtering and change analysis of SAR and PolSAR image time series. ISPRS Journal of Photogrammetry and Remote
Sensing, 107, 64-76.
LEE, J.-S. & POTTIER, E. 2009. Polarimetric radar imaging:
from basics to applications, CRC press.
LIU, M., ZHANG, H., WANG, C. & TANG, Y. PolSAR change detection for specific land cover type by testing equality of two PolInSAR coherency matrixes. Computer Vision in Remote Sensing (CVRS), 2012 International Conference on, 2012b. Ieee, 371-376.
LU, D., MAUSEL, P., BRONDIZIO, E. & MORAN, E. 2004. Change detection techniques. International journal of remote
sensing, 25, 2365-2401.
OTSU, N. 1979. A threshold selection method from gray-level histograms. IEEE transactions on systems, man, and
cybernetics, 9, 62-66.
QUAN, S., XIONG, B., ZHAO, L., KUANG, G. & ZHANG, S. Polarimetric SAR image change detection based on three-component decomposition. Radar Conference 2015, IET International, 2015. IET, 1-5.
SEYDI, S.T., HASANLOU, M., 2015. Land Cover Change Detection Based on Genetically Feature Aelection and Image Algebra Using Hyperion Hyperspectral Imagery. ISPRS - International Archives of the Photogrammetry, Remote Sensing and Spatial Information Sciences 15, 669–673. doi:10.5194/isprsarchives-XL-1-W5-669-2015
WANG, Y., DU, L. & DAI, H. 2016. Unsupervised SAR Image Change Detection Based on SIFT Keypoints and Region Information. IEEE Geoscience and Remote Sensing
Letters, 13, 931-935.
ZHONG, Y., LIU, W., ZHAO, J. & ZHANG, L. 2015. Change detection based on pulse-coupled neural networks and the NMI feature for high spatial resolution remote sensing imagery. IEEE Geoscience and Remote Sensing Letters, 12,