* Corresponding author: [email protected]
Making Sense for Society
J.J. van der Heide* Msc a, M. M. Grus Msc b, J.C.A.J.. Nouwensc
a The Netherlands’ Cadastre, Land Registry and Mapping Agency (in short Kadaster), Strategy and policy advisor, Hofstraat, Apeldoorn, the Netherlands,
b The Netherlands’ Cadastre, Land Registry and Mapping Agency, Consultant and innovator, Hofstraat, Apeldoorn, the Netherlands,
cGeonovum, Barchman Wuytierslaan, Amersfoort, the Netherlands
KEY WORDS: Sensors, smart city, data platform, public space, open data, privacy, legal certainty.
ABSTRACT:
The Netherlands is a densely populated country. Cities in the metropolitan area (Randstad) will be growing at a fast pace in the coming decades1. Cities like Amsterdam and Rotterdam are being overrun by tourists. Climate change effects are noticed in cities (heavy rains for instance). Call for circular economy rises. Traffic increases. People are more self-reliant. Public space is shared by many functions. These challenges call for smart answers, more specific and directly than ever before. Sensor data is a cornerstone of these answers. In this paper we’ll discuss the approaches of Dutch initiatives using sensor data as the new language to live a happy life in our cities. Those initiatives have been bundled in a knowledge platform called “Making sense for society”
1 https://www.cbs.nl/nl-nl/nieuws/2016/37/pbl-cbs-prognose-groei-steden-zet-door (in dutch)
1. WHY
1.1 A happy life
We all strive for a happy live. Or like Aristotle states we all strive for the good life. Which is a life full of activity. And where there is an activity there is a (spatial) interaction. From this point of view you can describe cities like a system. You can see the city as an economic-, political-, social- and a technological system that mirrors these three.
In this paper we focus on improving our (un-)happy city lives from the technological system point of view. And as you will notice we focus on location, because “everything that happens, happens somewhere” (UN-GGIM, 2016).
1.2 Making Sense for Society
Geonovum, the Dutch governmental executive body for the Geo-information domain, hosts the knowledge platform ‘Making Sense for Society’. Everybody can become a member of this open platform. Kadaster is a member of this platform and embraces development on sensor (meta-)data and a sensor registry. Through this platform we develop and share knowledge and experience about collecting, saving, distributing and using sensor data and develop standards for doing so. The platform formulates questions about strategy and policy. For example; who owns sensor data collected in public space? Should all sensors situated in public space be registered by a non-commercial organisation like Kadaster?
The mission of Geonovum is to make public geo-information accessible, by developing standards and helping parties to use geo-information.
The Dutch Kadaster collects and registers administrative and spatial data on property and the rights involved. This also goes for ships, aircraft and telecom networks. Doing so, Kadaster protects legal certainty. Kadaster is also responsible for national mapping and maintenance of the national reference coordinate system. Furthermore, we are an advisory body for land-use issues and national spatial data infrastructures.
1.3 The virtual metabolism of a city
Data is everywhere. We all generate data in all kinds of processes. Structured and non-structured, aware and unaware. Governments, companies and research institutes are well underway making data from different sources and from different processes available (open data) and linkable (standards). So we can make informed decisions based on data. Data becomes available for developers to create apps. Data can provide insights that help us make informed choices for solving problems. We call this data driven decision making. To solve these real life problems we should mirror real life in systems (in analogy to the digital twin concept). We should build the virtual metabolism of a city.
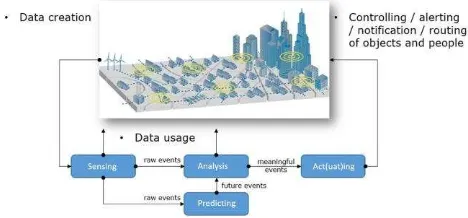
But at what scale, speed, detail and quality do we need to collect data to make real life decisions for a better life? The majority of our data are collected on different scales, at different intervals, different methods, different qualities, et cetera. How to optimise the digital value chain (see figure 1)? Can sensors help bridging this gap?
The International Archives of the Photogrammetry, Remote Sensing and Spatial Information Sciences, Volume XLII-4/W3, 2017 2nd International Conference on Smart Data and Smart Cities, 4–6 October 2017, Puebla, Mexico
This contribution has been peer-reviewed.
1.4 Sensors and the Internet of everything
Sensors are already everywhere. From your smartphone to CCTV, from satellites to thermometers. But more and new generations of sensors are entering our lives. These sensors are also owned by (smart) citizens and situated in public and private space and are mobile, like sensors in cars and in drones. Sensors are now connected or part of an actuator and use micro-processors to directly actuate if certain observations or measurements are achieved.
What if we have all city objects in public spaces connected, mobile and static? We sense air quality, movement, sound, smell, et cetera. Including us, the people. For some a scary perspective. Technological this Internet of Everything is becoming reality. What can and should we do to make this development in favour of our lives?
2. LEARNING BY DOING
2.1 Living labs
To make this development in favour of our lives, we learn the possibilities and limits to sensing the Dutch cities by experiments.
Different Dutch cities host living labs. The living lab of the city of Nijmegen is a good example of exploring the technological, social and governmental possibilities for a happy life2. The living lab focusses on: “(1) innovative sensing method: new, low-cost sensors are being designed and built in the project and tested in practice, using small sensing-modules that measure air quality indicators, amongst others NO2, CO2, ozone,
temperature and noise load. (2) big data: the measured data forms a refined data-flow from sensing points at places where people live and work: thus forming a ‘big picture’ to build a real-time, in-depth understanding of the local distribution of urban air quality (3) empowering citizens by making visible the ‘externality’ of urban air quality and feeding this into a bottom
2 http://smartemission.ruhosting.nl/
up planning process: the community in the target area get the co-decision-making control over where the sensors are placed, co-interpret the mapped feedback data, discuss and collectively explore possible options for improvement (supported by a Maptable instrument) to get a fair and ‘better’ distribution of air pollution in the city, balanced against other spatial qualities” (Linda Carton et al, 2015).
The most striking result is the use of many small and cheap sensors by citizens instead of the use of some big and expensive sensors by the government not close to the locations of interaction (interpolation is used). This results in more detailed and live data feeds for more effective decision making regarding to increasing air quality (without interpolation). Which make people more happy. Research has to be done how to integrate high-end sensors with low-end sensors (see figure 3).
Another living lab in this perspective is ‘Stratumseind’ in the city of Eindhoven. The street called ’’Stratumseind’’ is a 400 meters long concentration of about 50 pubs in the centre of Eindhoven with many (young) visitors and a kind of “weekly event” with 20.000 people. “This living lab is an’instrument’ to measure influences of interactions (light, smell, design).” (T. Kanters, 2016).
The most striking result is the use of smart lighting. By connecting observations and measurements of (possible) escalations, the public lighting can be adjusted in a way that it has a de-escalating effect on the public.3.
Many more experiments are being organized by cities. By doing so questions about upscaling, standards, data modelling and governance arise. One of the objects of the Making Sense for Society community.
2.2 National Smart City Strategy
Therefore government, companies, research institutes and (smart) citizens should work together in the quadruple helix4. The Dutch Standardisation Advise group Smart Cities (NLSAG-SG) is a nationwide partnership of stakeholders dedicated to support and initiate smart city initiatives in connection with international playing field. Geonovum and Kadaster are associated partners of the NLSAG-SG. In the National Smart City Strategy, developed bottom up by a broad group of representatives of the quadruple helix and presented to
3
http://www.lighting.philips.com/main/cases/cases/parks-and-plazas/catharinaplein
4 http://www.leydesdorff.net/ntuple/ Figure 1. Digital Value Chain (Cobb, 2013)
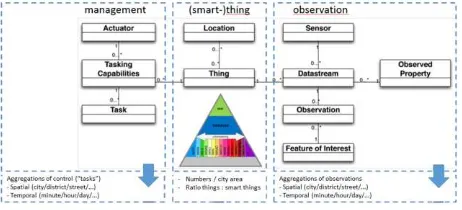
Figure 2. Smart City Processing; E. van der Zee, Geonovum, 2015
Figure 3. A gradient in Measurement systems (Carton and Ache, 2015)
The International Archives of the Photogrammetry, Remote Sensing and Spatial Information Sciences, Volume XLII-4/W3, 2017 2nd International Conference on Smart Data and Smart Cities, 4–6 October 2017, Puebla, Mexico
This contribution has been peer-reviewed.
the prime minister early 2017, five conditions are defined we collectively should realize:
1. A safe and standardised digital infrastructure; 2. Public-private cooperation with room for experiments; 3. New governance models, integral and inclusive citizens; 4. Education and employability;
5. Regional cooperation where cities function as a network.
The safe and standardised infrastructure (ad.1) consists of five layers:
Layer 1: Access points; hardware to receive and adapt data for personal use, like smartphones and wearables. And sensors in public space to generate this data (input).
Layer 2: Apps; applications for public and private goals,with which data are being transferred to ready-to-use information for city users (tourists for instance).
Layer 3: Platforms for apps and data; An open developers platform and a data platform for algorithms and models as base for apps, including data analytic tools and enabling services, like quality control and data standards.
Layer 4: Data, open and closed; open data, for everybody accessible and user-ready data. Closed data, owned by an individual or organisation, only useable by third parties if explicit permission is given by the owner.
Layer 5: Networks; fixed and wireless networks, like fiberglass, WiFi, LoRa and 4G/5G. As said, a growing number of sensors in public space need to be connected; for instance smart lighting, city beacons and traffic control systems.
2.3 Standards
To make the digital infrastructure work, existing standards should be adjusted and new standards should be developed and fit in the digital infrastructure. From the spatial data point of view five existing standards are being used in the Netherlands regarding sensoring.
1. Information model measurements for soil and water; this information model is based on the OpenGIS® Observations and Measurements (see 3). 2. OGC SensorThings API Part 1: Sensing. The
OGC standard SensorThings API is a standard developed for applications of the Internet of Things. It’s a lightweight, simple, interface specification based on REST and JSON. App developers can use this standard to communicate (web based) with smart objects, like objects with sensors. With this Part 1: Sensing Standard, you can extract observations and meta data from sensors.
3. OpenGIS® Observations and Measurements; with this standard you can describes observations and measurements. These observations and measurements are linked to a location. This standard makes international modelling and exchange possible of observations and measurements.
4. Sensor Observation Service (SOS); the SOS standard is applicable to use cases in which sensor data needs to be managed in an interoperable way. 5. Sensor Planning Service (SPS); The OpenGIS®
Sensor Planning Service Interface Standard (SPS) defines interfaces for queries that provide information about the capabilities of a sensor and how to task the sensor.
Besides this more geo-based standards, the NEN (The Dutch Normalization Institute) also develops and maintain technical
standards of sensors, like for semiconductor sensors and thermoelectric sensors5.
Work has to be done in the Netherlands to fit in or link these standards to NEN3610 (see figure 4). The NEN3610 is the basic geo-information model. This geo-information model facilitates the meaningful exchange and use of geo-information between parties and information systems, unambiguously. NEN3610 forms the common core of the different sectoral underlying information models. For instance the information model ‘spatial planning’ and the information model ‘water’. It includes terms, definitions, relationships and general rules for the exchange of information at the surface related spatial objects.
These objects now can have sensors as an attribute.
2.4 Register, registry or portal of sensors?
The amount of newspaper headlines of cities investing in sensors are increasing. Therefor the Kadaster advocates creating a sensor register or registry and made available through a portal.
In example of the city of Rotterdam a sign has been placed to inform users of the public space (cyclists), but it’s impossible to place signs with every sensor. Nevertheless it’s important, from a legal point of view, to inform individuals that they are ‘sensed’ by an object in public space. By creating an open sensor registration where all sensors in public space are being registered, the local government can inform their citizens. Furthermore the registration can contain meta data and links to data platforms where the data can be extracted (open data) to be useful in other contexts. Also the legal aspects of sensor data commercial and non-commercial use. A privacy and safety risk assessment should be part of the consideration.
b. Data can contain personal data. The rules of the Data Protection Act are applicable here. These data can only be made available for the public after they are aggregated or anonymised. c. Saving and processing personal data should be done according to applicable laws and regulations.
d. Other data should be made available equivalent for anybody, for example by creating an open data portal. No technical or legal barriers should be raised that make access to these data impossible, limited or discriminated.
e. Data are accessible for free and without necessary processing conform technical and functional specifications (yet to be defined).
5 https://www.nen.nl/About-NEN.htm
Figure 4. Information model; E. van der Zee, Geonovum, 2015
The International Archives of the Photogrammetry, Remote Sensing and Spatial Information Sciences, Volume XLII-4/W3, 2017 2nd International Conference on Smart Data and Smart Cities, 4–6 October 2017, Puebla, Mexico
This contribution has been peer-reviewed.
f. A distinction is made with personal data (such as an email address or payment details) which get collected with conscious knowledge and after an explicit consent of individuals. Use of this data is determined by agreement between the parties concerned within the framework of the privacy laws.
g. The municipality has always insight in what data is being collected in public space, whether or not the data is open or closed.
h. The municipality continues its dialogue with the parties contributing to the data infrastructure in the city and seeks earning potential and create a productive economic climate” (gemeente Eindhoven, raadsnummer 15R6494, 2015)
3. CONCLUSIONS
At the same time cities are growing, climate change effects our lives, technology is making progress with data collection with sensors and actuators directly intervene in situations that arise. This gives us - government, companies, research institutions and citizens – more insight and understanding of city processes. Even predictions of (outcomes of) city processes are possible nowadays.
Although the technical possibilities of sensors, micro-processors and actuators are enormous, even the sky is no limit anymore, the embedding of this technology in our lives is a major challenge.
Do we trust technology? Do we know what data is collected, by whom and where? How do we now the quality of the data? How do we know for what purpose data is being collected? How do we make data, collected in public space accessible for everybody, but also guard privacy? How do we prevent data-illiteracy?
The quadruple helix and living labs are in 2017 the way to keep this dialogue going. But after this year we should move to the next phase and have standards ready, platforms running, infrastructures nationwide operational and legislation in place.
All for a happy life!
REFERENCES / URL’S
Carton, L. J., and Ache, P.M., 2015. “Filling the Feedback Gap of Place-Related ‘Externalities’ in Smart Cities: Empowering citizen-sensor-networks for participatory monitoring and planning for a responsible distribution of urban air quality”, In Aesop 2015,
http://repository.ubn.ru.nl/bitstream/handle/2066/156344/15634 4.pdf?sequence=1 (11 August 2017)
Cobb, J. 2013. “Data Tip #1 – Your Digital Value Chain”, http://captricity.com/blog/data-tip-1-your-digital-value-chain/ (11 August 2017)
https://plato.stanford.edu/entries/aristotle/
https://www.forbes.com/sites/bernardmarr/2016/06/14/data-
driven-decision-making-10-simple-steps-for-any-business/#5665d4df5e1e
http://ioeassessment.cisco.com/
http://www.geonovum.nl/wegwijzer/standaarden/opengis%C2% AE-observations-and-measurements
https://www.geonovum.nl/onderwerpen/sensor-data-en-smart-cities?tab=multimedia
http://www.rvo.nl/actueel/nieuws/rutte-neemt-smart-city-strategie-nl-ontvangst
http://un-ggim-europe.org/content/everything-happens-happens-somewhere
https://www.eindhoven.nl/
http://www.opengeospatial.org/domain/swe
http://www.volkskrant.nl/
http://www.webopedia.com/TERM/D/digital-twin.html
All references last checked on 11-08-2017
The International Archives of the Photogrammetry, Remote Sensing and Spatial Information Sciences, Volume XLII-4/W3, 2017 2nd International Conference on Smart Data and Smart Cities, 4–6 October 2017, Puebla, Mexico
This contribution has been peer-reviewed.