Vol. 17, No. 4, 2002, 440 - 459
THE EFFECT OF PROFITABILITY OF MOMENTUM
STRATEGIES AND VOLUME ON FUTURE RETURNS:
AN EMPIRICAL EVIDENCE FROM
JAKARTA STOCK EXCHANGE AND KUALALUMPUR
STOCK EXCHANGE
Aida Ainul Mardiyah
STIE Malangkuçeçwara Malang
ABSTRAK
Tujuan penelitian ini untuk melihat pengaruh strategi momentum dan volume terhadap return yang akan datang. Unit analisis penelitian sebanyak 30 perusahaan yang terdaftar di Bursa Efek Jakarta dan Bursa Efek Kualalumpur dari tahun 1996-1997. Seleksi data dengan menggunakan purposive sampling. Koleksi data dengan metoda archaival. Alat statistik untuk menguji hipotesis dengan regresi.
Hasil penelitian ini adalah:1) Hipotesis satu tidak didukung artinya tidak ada pengaruh return yang lalu terhadap return yang akan datang; 2) Hipotesis dua didukung artinya ada pengaruh volume terhadap strategi momentum; dan 3) Hipotesis tiga didukung artinya ada pengaruh volume dan strategi momentum terhadap return yang akan datang.
Keywords: Future Returns, Winner-loser Stock, Profitability of Momentum Strategies, and Volume
INTRODUCTION
1. Research Background
This article is to trace the source of the predictability of future stock returns based on past returns. It is natural to look to earnings to try to understand movements in stock prices, so we explore this avenue to rationalize the existence of momentum. Chan et al. (1996) relates the evidence on momentum in stock
prices to the evidence on the market‟s
underreaction to earnings-related information. For instance, Latane and Jones (1979), Bernard and Thomas (1989), and Bernads et al. (1995), among others, find that firms reporting unexpectedly high earnings outperform firms reporting unexpectedly poor earnings. The superior performance persist over a period of about six months after earnings announ-cements. Givoly and Lakonishok (1979) report
similar sluggishness in the response of prices
to revisions in analysts‟ forecasts of earnings.
Accordingly, one possibility is that the profitability of momentum strategies is entirely due to the component of medium-horizon returns that is related to these earnings related news. If this explanation is true, then momentum strategies will not be profitable after accounting for past innovations in earnings and earnings forecasts. Affleck-Graves and Mendenhall (1992) examine the Value Line timeliness ranking system (a proprietary model based on a combination of past earnings and price momentum, among other variables), and suggest that earnings
surprises account for Value Line‟s ability to
predict future returns.
over-reaction induced by positive feedback trading strategies of the sort discussed by DeLong et al. (1990). This explanation implies that
“trend-chasers” reinforce movements in stock prices even in the absence of fundamental information, so that the returns for past winners and losers are (at least partly) temporary in nature. Under this explanation, we expect that past winners and losers will subsequently experience reversals in their stock prices.
Finally, it is possible that strategies based either on past returns or on earnings surprises (Chan et al., 1996) refer to the latter as
“earnings momentum” strategies) exploit
market under-reaction to different pieces of information. For example, an earnings momentum strategy may benefit from under reaction to information related to short-term earnings, while a price momentum strategy
may benefit from the market‟s slow response
to a broader set of information, including longer-term profitability. In this case Chan et al. (1996) would expect that each of the momentum strategies is individually suc-cessful, and that one effect is not subsumed by the other. True economic earnings are imperfectly measured by accounting numbers, so reported earnings may be currently low
even though the firm‟s prospects are
improving. If the stock price incorporates other sources of information about future profitability, then there may be momentum in stock prices even with weak reported earnings.
Researchers have also convincingly demonstrated that momentum strategies have power to predict stock returns. For instance, Jegadeesh and Titman (1993) showed that strategies that buy winners and sell losers based on returns over the previous 6-12 months generate excess returns. Asness (1995) showed that these strategies are effective even after accounting for common value measures. Asness ( 1997) examined whether value and momentum strategies are independent or related, asking how well value strategies work
among stocks that have exhibited both strong momentum (winners) and weak momentum (losers). Similarly, Asness (1997) looked at momentum strategies among only high-value (cheap) or only low-value (expensive) stocks.
2. Objective and motivation
The objective of this article are: 1) the effects of past returns on future returns, 2) the effects of volume on profitability of momen-tum strategies, and 3) the effects profitability of momentum strategies and volume on future returns.
The motivation of their studies are not clear for the ongoing controversy over interpreting why these strategies work. One explanation for the success of momentum strategies is that the market is slow to react to new information.
Beside future earnings, prior research e.g., Datar et al. (1998) shows that low (high) volume firms earn higher (lower) future returns. We show that this volume effect is long lived (i.e., it is observable over the next three to five years) and is most pronounced among the extreme winner and loser portfolios
Two differing interpretations for why value strategies work are that value represents risk versus that the market is inefficient. Value strategies work well, expect among the strongest recent performers. Among the strongest recent performers, value strategies based on industry-relative BV/MV or dividend yield are ineffective. Value strategies might
work because of investors‟ inability to price
securities correctly (e.g., investors might systematically over extrapolate good or bad past result).
returns and share turnover, and examines the turnover characteristics of the local returns factor portfolios. There is no evidence of a relation between expected returns and turnover in emerging markets. However, beta, size, momentum, and value are positively cross sectionally correlated with turnover in emerging markets. This suggest that the returns premiums do not simply reflect a compen-sation for illiquidity.
3. Research Question
The research questions: 1) Are the effects of past returns on future returns? 2) Is the effects of volume on profitability of momentum strategies? and 3) Is the effects of profitability of momentum strategies and volume on future returns?
4. Contribution
We contribute to the literature on price momentum in two ways. First, we show that the price momentum effect documented by Jegadeesh and Titman (1993) reverses over long horizons. Like Jegadeesh and Titman, we find no significant price reversals through the third year following portfolio formation. However, over years 3 through 5, we find that initial winner portfolios significantly under perform initial loser portfolios. This finding is important because it refutes the common presumption that price momentum is simply a market under reaction. Instead, the evidence suggests that at least a portion of the initial momentum gain is better characterized as an over reaction.
Second, we show that past trading volume predicts both the magnitude and the persistence of future price momentum. Specifically, high (low) volume winners (loser) experience faster momentum reversals. Conditional on past volume, we can create Jegadeesh and Titman-type momentum portfolios (winners minus losers) that either exhibit long-horizon returns reversals or long-horizon returns continuations. This evidence shows that the information
contained in past trading volume can be useful in reconciling intermediate horizon "under reaction" and long-horizon "over reaction" effects.
Our findings also extend the trading volume literature (prior research e.g., Datar et al. (1998) shows that low (high) volume firms earn higher (lower) future returns. We show that this volume effect is long lived (i.e., it is observable over the next three to five years) and is most pronounced among the extreme winner and loser portfolios).
PRIOR RESEARCH AND HYPOTHESIS DEVELOPMENT
1. Momentum Strategies
Momentum strategies, which past winning stocks and sell past losing stock (Jegadeesh and Titman, 1993; Moskowitz and Grinblatt, 1999). Momentum (or "relative strength") strategies entail the purchase of stocks that performed well in the past and the sale of stocks that performed poorly - the exact opposite of what contrarians recommend (Schiereck et al.,1999).
Profitability of momentum strategies consists are: 1) the profitability of price momentum strategies: the profitability of price momentum strategies based on past returns; and 2) the profitability of earnings momentum: the profitability of earnings momentum strategies based on standardized unexpected earnings and revisions of consensus forecasts (Chan et al., 1999).
One explanation is that stock returns tend to be high when earnings growth exceeds expectations or when consensus forecasts of future earnings are revised upward (Chan, 1999) refer to these conditions together as
“earnings momentum”). Studies by Givoly and
strategy may reflect underlying changes in fundamentals that are captured by earnings momentum.
Another explanation is that strategies based on price momentum and earnings momentum may be profitable because Chan et al. (1999) exploit market under reaction to different pieces of information. For instance, earnings momentum strategies may exploit under reaction to information about the short-term prospects of companies that will ultimately be manifested in near-term earnings. Price momentum strategies may exploit slow reaction to a broader set of value-relevant information, including the long-term prospects of companies that have not been fully captured by near-term earnings forecasts or past earnings growth. If both these explanations are true, then a strategy based on past returns and on earnings momentum in combination should lead to higher profits than either strategy individually.
In addition to relating the evidence on price momentum to that on earnings momentum, this article adds to the existing literature in several ways. Chan et al. (1996) provide a comprehensive analysis of different earnings momentum strategies on a common set of data. These strategies differ with respect to how earnings surprise are measured and each adds a different perspective. In the finance literature, the most common way of measuring earnings surprises is in terms of standardized unexpected earnings, although this variable requires a model of expected earnings and hence runs the risk of specification error. In
comparison, analysts‟ forecasts of earnings
have not been as widely used in the finance literature, even though Chan et al. (1996) provide a more direct measure of expectations and are available on a more timely basis. Tracking changes in analysts‟ forecasts is also a popular technique used by investment managers. The abnormal returns surrounding earnings announcements provide another
means of objectively capturing the market‟s
interpretation of earnings news. A particularly intriguing puzzle in this regard is that Foster et al. (1984) find that while standardized unexpected earnings help to predict future returns, residual returns immediately around the announcement date have no such power. Chan et al. (1996) analysis helps to clear up some of these lingering issues on earnings momentum. Chan et al. (1996) go on to conferment of price momentum with earnings momentum strategies, using portfolios formed on the basis of one- way, as well as two-way, classifications. These comparisons, and Chan et al. (1996) cross sectional regressions, help to disentangle the relative predictive power of past returns and earnings surprises for future returns. Chan et al. (1996) also provide evidence on the risk-adjusted performance of the price and earnings momentum strategies.
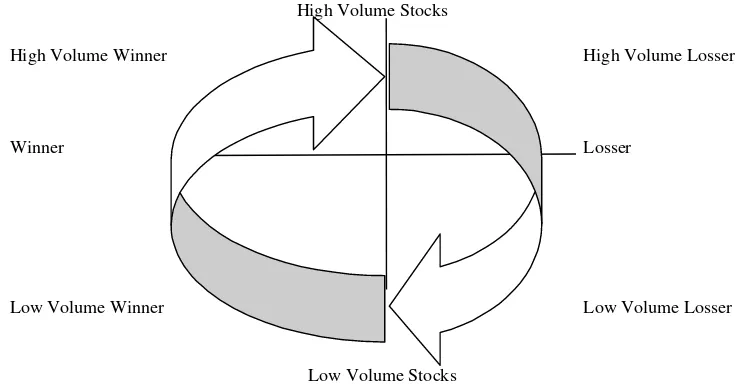
2. Momentum Life Cycle (MLC)
This figure 2.1 ilustrates some of the more salient features of our empirical findings. Lee and Swarminathan (2000) find that low volume stocks generally outperform high volume stocks. Among winners, low volume stocks show greater persistence in price momentum. Among losers, high volume stocks show greater persistence in price momentum. In addition, low volume (high volume) firms exhibit many characteristics most commonly associated with value (glamour stock).
Figure 2.1: Momentum Investing based on Past Price and Volume Information
According to this hypothesis, stocks experience periods of investor favoritism and neglect. A stock with positive price and/or earning momentum (past winner) would be on the left half of the cycle, whereas a stock with negative price and/ or earning momentum (past losser) would be on the right half of the cycle. Growth stocks that experience positive news move up the cycle, but eventually these stocks
disappoint the market and are “topedoed.”
Stocks that disappoint begin a downward slide and eventually experience general neglect. If they fall far enough in price, they may become attractive to contrarian investors (Lee and Swarminathan (2000))
Given this framework, Lee and Swarminathan (2000) evidence suggests trading volume may provide information useful in locating a given stock in the momentum/expectation life cycle. Generally, when a stock popular into disfavor, its trading volume declines. Conversely, when a stock is popular, its trading volume increases. Viewed in this light, trading volume provides
information on the degree of investors favoritism (or neglect) in a stock, or more precisely, the extent to which market sentiment favors the stock at the particular point in time.
The MLC would characterize high volume winners and low volume losers as late stage momentum stocks, in the sense that their price momentum is more likely to reverse in the near future. Conversely low volume winners and high volume losers are early stage momentum stocks, in the sense that their momentum is more likely to persits in the near future. The MLC also implies that trading volume should be correlated with value/glamour characte-ristics. As a stock moves up the cycle, trading volume increases and it becomes more
“expensive” in terms of price-to-value
measures. The higher (lower) number of analysts following high (low) volume stocks is also consistent with this explanation. In fact, many of the relations between volume and value characteristics are diffucult to accom-modate in any other explanation that Lee and Swarminathan (2000) are aware of.
High Volume Stocks
High Volume Winner High Volume Losser
Winner Losser
Low Volume Winner Low Volume Losser
Low Volume Stocks
Lee and Swarminathan (2000) wish stress the limitations on figure 2.1. Lee and Swarminathan (2000) have shown that, on average, firms in each of the four quadrants of this cycle exhibit characteristics that are consistent with the MLC hypothesis. However, these results describe general tendencies at the portfolio level. For individual firms, things are far less deterministic than the figure implies. Individual firms do not necessarily exhibit expectation cycles of the same frequency. Nor does each firm need to pass through all phases of the cycle each time. The turning points for individual firms may appear random and difficult to pinpoint, even though the portfolios in each quadrant conform to the predictions of the MLC hypothesis.
3 EMH (Efficient Markets Hypotheses)
The evidence on returns predictability is, as Fama (1991) notes, among the most controversial aspects of the debate on market efficiency. Accordingly, a large number of explanations have been put forward to to account for reversals in stock prices. For example, Kaul and Nimalendran (1990) and Jegadeesh and Titman (1995) examine whether bid-ask spreads can explain short-term reversals. Short-term constrain profits may also be due to lead-lag effects between stocks (Lo and MacKinlay, 1990). DeBondt and Thaler (1985, 1987), and Chopra et al. (1992)
point to investors‟ tendencies to overreact. Competing explanations for long-term rever-sals are based on microstructure biases that are particularly serious for low-priced stocks (Ball et al. ,1995, Conrad and Kaul, 1993), or time-variation in expected returns (Ball and Kothari, 1989). Since differences across stocks in their pat price performance tend to show up as differences in their book-to-market value of equity and in related measures as well, the phenomenon of long-term reversals is related to the kinds of book-to-market effects discussed by Chan et al. (1991), Fama and French (1992), and Lakonishok et al. (1994).
The situation with respect to stock price momentum is very different. In contrast to the rich array of testable hypotheses concerning long and short-term reversals, there is a woeful shortage of potential explanations for momentum. A recent article by Fama and French (1996) tries to rationalize a number of related empirical regularities, but fails to account for the profitability of the Jegadeesh and Titman (1993) strategies. In the absence of an explanation, the evidence on momentum stands out as a major unresolved puzzle. From the standpoint of investors, this state of affairs should also be a source of concern. The lack of an explanation suggests that there is a good chance that a momentum strategy will not work out-of-sample and is merely a statistical fluke.
There remains disagreement over the interpretation of the above evidence of predic-tability. One possibility is that these anomalies are chance deviations to be expected under market efficiency (Fama, 1998). Daniel et al. (1998) believe the evidence does not accord with this viewpoint because some of the returns patterns are strong and regular.
4. Returns
An extensive body of recent finance litera-ture documents that stock returns are predic-table based on past price history. Numerous studies examine the profitability of trading strategies that exploit interdependence of time-series returns and show that these strategies could lead to abnormal returns. For example, Jegadeesh and Titman (1993) document that over a horizon of three to 12 months, past winners, on average, continue to outperform past losers by about 1% per month, showing
that there is “momentum” in stock prices.
subsequent earnings announcements. Hong and Stein (1999) find that under reaction of stock prices depends on analyst coverage, which is pronounced with bad news. Second, investors
tend to “flock” together. The herding behavior
is documented by several studies. For example, Grinblatt et al. (1995) find that the majority of mutual funds purchase stocks based on their
past returns, namely by buying past “winners,”
and that funds showing the greatest tendency to buy past winners also tend to invest more
intensely “with the crowd” than other funds
do. Also, Lakonishok et al. (1992) find eviden-ce of pension fund managers either buying or selling in herds, with slightly stronger evidence that they herd around small stocks.
Several recent studies evaluate the profita-bility of the strategy for international equities. Rouwenhorst (1997) finds that momentum strategies are profitable for equities in 12 European markets, and Rouwenhorst (1999) also reports that emerging market stocks exhibit momentum. On the other hand, Bekaert et al. (1997) find that momentum strategies are not consistently profitable for emerging markets, although they perform better when the invest able indexes are examined.
Rouwenhorst (1998) document interna-tional equity markets exhibit medium-term returns continuation. Between 1980 and 1995 an internationally diversified portfolio of past medium-term Winners outperforms a portfolio of medium-term Losers after correcting for risk by more than 1 percent per month. Returns continuation is present in all twelve sample countries and lasts on average for about one year. Returns continuation is negatively related to firm size, but is not limited to small firms. The international momentum returns are correlated with those of the United States which suggests that exposure to a common factor may drive the profitability of momentum strategies.
Many papers (Jegadeesh and Titman, 1993, DeBondt and Thaler, 1985, 1987, Chan et al., 1996, and Fama and French, 1996) have
documented that average stock returns are related to past performance. Jegadeesh and Titman (1993) document that over medium-term horizons performance persists: firms with high returns over the past three months to one year continue to outperform firm with low past returns over the same period. By contrast, DeBondt and Thaler (1985, 1987) document returns reversals over longer horizons. Firm with poor three- to five-year past performance earn higher average returns than firms that performed well in the past. There has been an extensive literature on whether these returns patterns reflect an improper response by markets to information, or whether they can be explained by market microstructure biases or by properly accounting for risk. Fama and French (1996) show that long-term reversals can be consistent with a multifactor model of returns, but their model fails to explain medium-term performance continuation. Chan et al. (1996) find that medium-term returns continuation can be explained in part by under reaction to earning information, but price momentum is not subsumed by earnings momentum.
To test the conflicting implications of these theories, Jegadeesh and Titman (2001) exa-mine the returns of the winner and loser stocks in the 60 months following the formation date. Consistent with earlier work, Jegadeesh and Titman (2001) find that over the entire sample period of 1965 to 1998, the Jegadeesh and Titman (1993) momentum portfolio yields significant positive returns in the first 12 months following the formation period. In addition, the cumulative returns in months 13 to 60 for the Jegadeesh and Titman (1993) momentum portfolio is negative, which is consistent with the behavioral theories but is inconsistent with the Conrad and Kaul hypothesis.
Ha11 = Past returns affect future returns in
Indonesia
Ha12 = Past returns affect future returns in
5. Volume
Chan et al. (2000) examine the role of trading volume in momentum strategies. Several theoretical papers conjecture that there is a relation between trading volume and predictable patterns in short horizon security returns. Blume et al. (1994) show that volume provides information that cannot be deduced from the price statistic and demonstrate that traders who use information contained in the
volume statistic will do “better” than traders
who do not. Campbell et al. (1993) argue that because the variations in the aggregate demand of the liquidity traders also generate large levels of trade, volume information can help distinguish between price movements that are due to fluctuating demands of liquidity traders and those that reflect changes in expected returns. An implication of the model is that price changes accompanied by large trading volumes tend to be reversed.
Wang (1994) examines the link between the nature of heterogeneity among investors and the behavior of trading volume and its relation to price dynamics. In the model, uninformed investors trade against informed investors and will revise their positions when they realize their mistakes. When the returns is high in the previous period, it could be due to private information of informed investors or simply buying pressure for non-informational reasons. If it is due to private information, the high realized returns accompanied by high volume in the past will be followed by high future returns. If it is due to non-informational reasons, the high realized returns will be followed by low future returns. Conrad et al. (1994) provides empirical evidence on these relations. They find that high transaction securities experience price reversals, while the returns of low transactions securities are positively auto correlated, a result that seems to be consistent with Campbell et al. (1993).
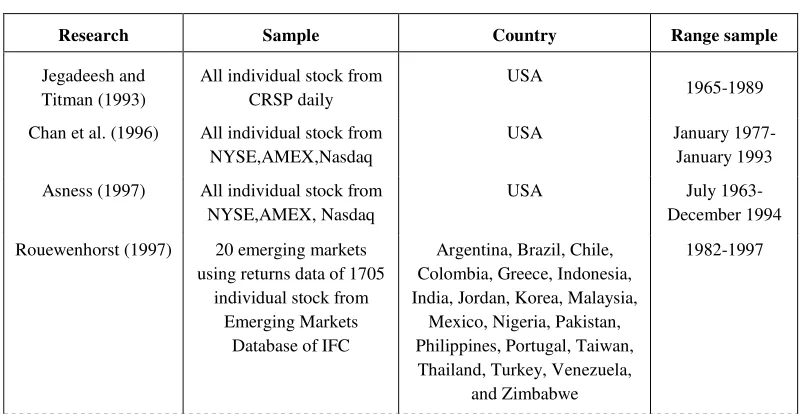
Table 1: Related Research
Research Sample Country Range sample
Jegadeesh and Titman (1993)
All individual stock from CRSP daily
USA
1965-1989
Chan et al. (1996) All individual stock from NYSE,AMEX,Nasdaq
USA January 1977-January 1993
Asness (1997) All individual stock from NYSE,AMEX, Nasdaq
USA July 1963-December 1994
Rouewenhorst (1997) 20 emerging markets using returns data of 1705
individual stock from Emerging Markets
Database of IFC
Argentina, Brazil, Chile, Colombia, Greece, Indonesia, India, Jordan, Korea, Malaysia,
Mexico, Nigeria, Pakistan, Philippines, Portugal, Taiwan, Thailand, Turkey, Venezuela,
and Zimbabwe
1982-1997
Rouwenhorst (1998) 2,190 firm from 12 European countries
Austria (60 firms) Belgium (127)
Denmark (60) France (427) Germany (228)
Italy (223) The Netherlands (101)
Norway (71) Spain (111) Sweden (134) Switzerland (154) and the United Kingdom (494).
Returns
1978-1995
NN 1,000 individual securities traded on six Asian Market
except for Indonesia
Hongkong (201 firms) Malaysia (244 firms) Singapore (103 firms) South Korea (309 firms)
Taiwan (92 firms) Thailand (59 firms)
1979-1994
Chan et al. (1999) All individual stock from NYSE, AMEX, Nasdaq
USA January 1973-December 1993
Hong and Stein (1999)
All individual stock from CRSP monthly combined file
included NYSE, AMEX, Nasdaq
USA 1976-1996
Moskowitz and Grinblatt (1999)
20 value weighted industry from CRSP and Compustat
USA July 1963-July 1995
Schiereck et al (1999) 357 companies from FSE (Frankfurt Stock Exchange)
Germany January 1961-December 1991
Chan et al. (2000) 23 sample countries from PACAP
Nine from Asia Pasific: Australia, Hongkong, South
Korea, Japan, Singapore, Thailand, Taiwan, Malaysia,
Indonesia 11 are from Europe: ustria, Belgium, Denmark, France,
Germany, Italy, Netherlands, Norway, Spain, Swizerland, and
UK
1980-1995 except for Indonesia in
1985-1995
Lee and Lwaminathan (2000)
All individual stock from NYSE, AMEX
USA January 1965-December 1995 Jegadeesh and Titman
(2001)
All individual stock from NYSE
USA 1965-1998
Financial academics and practitioners have long recognized that past trading volume may provide valuable information about a security. However, there is little agreement on how volume information should be handled and interpreted. Even less is known about how past trading volume interacts with past returns in the prediction of future stock returns. Stock returns and trading volume are jointly determined by the same market dynamics, and are inextricably linked in theory (e.g., Blume et al., 1994). Yet prior empirical studies have generally accorded them separate treatment.
In Lee and Swaminathan (2000) investigate the usefulness of trading volume in predicting cross-sectional returns for various price momentum portfolios. The study is organized into two parts. In the first part, Lee and Swaminathan (2000) document the interaction between past returns and past trading volume in predicting future returns over intermediate and long horizons. In the second part, Lee and Swaminathan (2000) evaluate alternative explanations for these empirical regularities. Lee and Swaminathan (2000) finding extend the literature on both price momentum and trading volume. In addition, Lee and Swaminathan (2000) establish an important link between intermediate-horizon "momen-tum" and long-horizon "value" strategies.
More recently, Conrad and Kaul (1998) suggest that the momentum effect may be due to cross-sectional variation in the mean returns of individual securities. Moskowitz and Grinblatt (1999) claim that a significant component of firm-specific momentum can be explained by industry momentum. However, the evidence in Grundy and Martin (1998) suggests momentum effects are not explained by time-varying factor exposures, cross-sectional differences in expected returns, or industry effects. None of these studies examine the interaction between past trading volume and past price movements in predicting cross-sectional returns.
At least two theoretical papers suggest that past trading volume may provide valuable information about a security. Campbell et al. (1993) present a model in which trading volume proxies for the aggregate demand of liquidity traders. However, their model focuses on short-run liquidity imbalances (or volume shocks) of a daily or weekly duration and makes no predictions about longer-term returns. Blume et al. (1994) present a model in which traders can learn valuable information about a security by observing both past price and past volume information. However, their model does not specify the nature of the information that might be derived from past volume. Lee and Swaminathan (2000) provide empirical evidence on the nature of this information.
In a related study, Datar et al. (1998) show that low turnover stocks generally earn higher returns than high turnover stocks. Datar et al. (1998) interpret this result as providing support for the liquidity hypothesis of Amihud and Mendelson (1986). According to the liquidity hypothesis, firms with relatively low trading volume are less liquid and therefore command a higher expected returns. Lee and Swaminathan (2000) build on the finding of Datar et al. (1998) by examining the interaction between past price momentum and trading volume in predicting cross-sectional returns. Lee and Swaminathan (2000) and Datar et al. (1998) confirm their findings but also present additional evidence, which is difficult to reconcile with the liquidity hypothesis.
in the previous period, indicating that returns continuation is stronger following an increase in trading volume. This result confirms the informational role of volume and its applicability in technical analysis.
Ha21 = Volume affect profitability of
momen-tum strategies in Indonesia
Ha22 = Volume affect profitability of
momen-tum strategies in Malaysia
6. The Effect of Profitability of Momentum Strategies and Volume on Future Returns
Jegadeesh and Titman (1993) evaluates various explanations for the profitability of momentum strategies documented. The evidence indicates that momentum profits have continued in the 1990s, suggesting that the original results were not a product of data snooping bias. The paper also examines the predictions of recent behavioral models that propose that momentum profits are due to delayed over reactions that are eventually reversed. Jegadeesh and Titman (1993) evidences provides support for the behavioral models, but this support should be tempered with caution.
Many portfolio managers and stock analysts subscribe to the view that momentum strategies yield significant profits. Jegadeesh and Titman (1993) examine a variety of momentum strategies and document that strategies that buy stocks with high returns over the previous 3 to 12 months and sell stocks with poor returns over the same time period earn profits of about one percent per month for the following year. Although these results have been well accepted, the source of the profits and the interpretation of the evidence are widely debated. Although some have argued that the results provide strong
evidence of “market inefficiency,” other have
argued that the returns from these strategies are either compensation for risk, or alternatively, the product of data mining.
Chan et al. (2000) examines the profitability of momentum strategies formed based on past returns of country indices in the global equity markets. Chan et al. (2000) result indicate evidence of momentum profits that are statistically and economically significant, especially for short holding periods (less than four weeks). Although the momentum profits could be increased by exploiting exchange rate information, the major source of momentum profits arises from price continuations in individual stock indices. Evidence also indicates that the momentum profits cannot be completely explained by non synchronous trading and are not confined to emerging markets, although it seems that they diminish significantly after adjusting for beta risk.
An interesting result is that when Chan et al. (2000) implement the momentum strategies on markets that experience increases in volume in the previous period, the momentum profits are higher. This indicates that returns continuation is stronger following an increase in trading volume. This result seems to contradict the hypothesis of under reaction and price reversals of liquidity-related trades as predicted by Campbell et al. (1993), but is consistent with the herding behavior theory, in which investors tend to follow the crowd in buying and selling securities. Chan et al. (2000) must point out that their evidence is different from Conrad et al. (1994), who document that the price changes accompanied by higher trading volume tend to be reversed in the following period. Conrad et al. (1994) study individual stock indices in the international equity markets while they study individual securities in the U.S. market. This seems to suggest that the relation between trading volume and price continuation (or price reversal) is different between individual stocks and the market an interesting topic for future work.
has long received attention from technical analysis who believe that volume data provides important information about future price
movements. There is a common belief that “it takes volume to move prices.” Without suffi -cient trading volume, stock prices may under react to information. Thus, if a country under reacts to information on low trading activity, the momentum strategy applied to this country will be profitable. Several theoretical papers also show that traders can learn valuable information about securities from past volume information (Grundy and McNichols, 1990, Blume et al., 1994, and Campbell et al. 1993). A few empirical papers also document that trading volume does contain information about future stock prices. Conrad et al. (1994) find that high volume securities experience price reversals, while low volume securities expe-rience price continuations
.
Gervais et al. (1998) show that individual stocks whose trading volumes are unusually large (small) tend to experience large (small) subsequent returns. Lee and Swaminathan (2000) illustrate that past trading volume predicts both the magnitude and persistence of future price momentum and, over intermediate horizons, price momentum strategies work better among high volume stocks. Nevertheless, as these studies are on individual stocks, it is unclear if similar results will hold for their momentum strategies that are implemented on stock market indices.Ha3 = Profitability of momentum strategies
and volume affect future returns in Indonesia
Ha3 = Profitability of momentum strategies and volume affect future returns in Malaysia
METHODOLOGY
1. Sample and Procedure
Our sample comprises monthly stock returns on 30 individual security traded on Jakarta Stock Exchange and Kualalumpur
Stock Exchange. Our sample period is 1996-1997 (like Sukmawati and Hermawan, 2002). We obtain the data from the JSX database and KLSE database. For each securities, we obtain the monthly price, returns, size, trading volume, and number of days traded in a month.
The procedure is constructed as in Jegadeesh and Titman (1993). At the end of each month, all stocks with a returns history of at least 12 months are ranked into deciles based on their past J-month returns (J equals 3, 6, 9, or 12) and assigned to one of ten relative strength portfolios (1 equals lowest past
performance, or “Loser,” 10 equals highest
past performance, or “Winner”). These portfo
-lios are equally weighted at formation, and held for K subsequent months (K equals 3, 6, 9, or 12 months) during which time they are not re-balanced. The holding period exceeds the interval over which returns information is available (monthly), which creates an overlap in the holding period returns.
2. Variable Measurement
Dependent Variable
Dependent variable is the profitability of price momentum strategies: the profitability of price momentum strategies based on past returns proxy WL=Pt-1-Pt-2 (for Ha2) and future
returns (for Ha1 andHa3)
Independent Variable:
1) Past returns=Pt-1-Pt-2 (for Ha1); 2) The
profitability of price momentum strategies: the profitability of price momentum strategies based on past returns with proxy past returns WL=Pt-1-Pt-2 (for Ha3); and 3) Volume. We
measure volume/turnover as percentage of the number of shares traded in month divided by the number of share outstanding.
DATA ANALYSIS AND RESULT
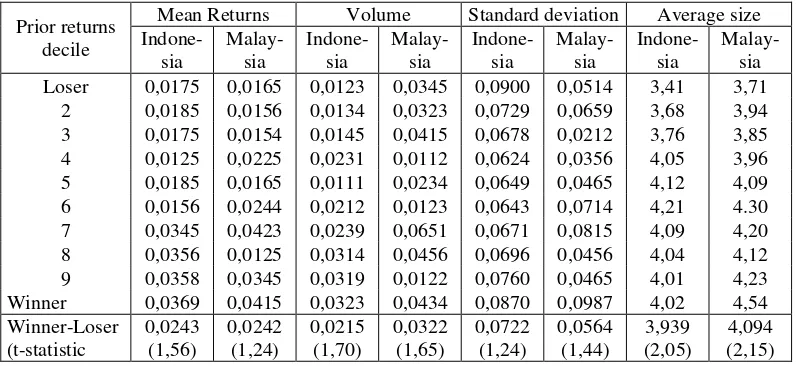
1. Descriptive statistic
Descriptive statistic is derived from the statistic analysis before another test performed
using multiple regression analysis. Mean and standard deviation is summarized in table 2.
Table 2:Descriptive Statistics for Returns of Decile Portfolios
Prior returns decile
Mean Returns Volume Standard deviation Average size
Indone-sia
Malay-sia
Indone-sia
Malay-sia
Indone-sia
Malay-sia
Indone-sia
Malay-sia Loser 0,0175 0,0165 0,0123 0,0345 0,0900 0,0514 3,41 3,71
2 0,0185 0,0156 0,0134 0,0323 0,0729 0,0659 3,68 3,94 3 0,0175 0,0154 0,0145 0,0415 0,0678 0,0212 3,76 3,85 4 0,0125 0,0225 0,0231 0,0112 0,0624 0,0356 4,05 3,96 5 0,0185 0,0165 0,0111 0,0234 0,0649 0,0465 4,12 4,09 6 0,0156 0,0244 0,0212 0,0123 0,0643 0,0714 4,21 4.30 7 0,0345 0,0423 0,0239 0,0651 0,0671 0,0815 4,09 4,20 8 0,0356 0,0125 0,0314 0,0456 0,0696 0,0456 4,04 4,12 9 0,0358 0,0345 0,0319 0,0122 0,0760 0,0465 4,01 4,23 Winner 0,0369 0,0415 0,0323 0,0434 0,0870 0,0987 4,02 4,54 Winner-Loser
(t-statistic
0,0243 (1,56)
0,0242 (1,24)
0,0215 (1,70)
0,0322 (1,65)
0,0722 (1,24)
0,0564 (1,44)
3,939 (2,05)
4,094 (2,15) Sources: Result Research, 2002
2. Blue
a. No Multicollinearity
The assumption of no multicollinearity according to Gujarati (1995:192-193) happened when there is no exact linear relationship among independent variables, or there is no multicollinearity if more than one exact linear relationship in involved, is new and needs some explanation. Informally, no collinaerity means none of the explanatory variables can be written as linear combinations of the remaining explanatory variables. Formally, no collineairity means that there exits no set of numbers among partial regression coefficient, not all zero. The empirical analysis has indicated that there is no multicollinearity. If VIF>10,it could indicate a multicollinearity problem. Mean of VIF from empirical finding is 1,09. This is demonstrated by the multicolinearity number r < 0,8 or VIF
mean 1 that shows that the multicolinearity is not dangerous
b. No heteroscedasticity
BG (The Breussh-Godfrey) test for hetros-cedasticity, that is =0. It means that there is no heteroscedasticity. If we used the cross-sectional data, a heteroscedacity. If we used the cross-sectional data, a heteroscedasticity problems is possible available, therefore, we do the heteroscedasticityt test in this study. With heteroscedasticity, the variance is not constantly keading to potentially biased standard error.
c. No Autocorelation
3. The Normal Data Test
The normal data test and non response bias using t-test = 1,345 and 1,215 shows an
insignificant result. This means that there is the normal data.
4. Hypotheses Result
We construct the relative strength portfolio as follows. At the end of each month, we rank all in ascending orders, based on the past J Month returns (J=3,6,9,12). We then assign the stock to one of the ten relative strength
portfolio (one represent the “Loser” portfolio
or the one with the highest past performance. The portfolio are equal weighted at formation and then held for the next K month (K=3,6,9,1nd 12). The gives us 16 combi-nation of J and K months, and hence 16 momentum strategies.
Since only month returns are available, when the holding period exceeds I month, we create an overlap in the holding period returns. As a result we form K composite portfolio each of which are initiated one month apart. In each month, we revise I/K of the holding and the rest are carried over from the previous month. For example, towards the end of month t, J=3,K=3 portfolio Winner consit of tree parts, a position carried over from the invest-ment at the end of month 1-3 in the top 10 percent of firms with the highest past three-month performance as of t-3,and two similar position resulting from similar investment in month t-2 and t-1 respectively. At the end of month t, we liquidate the first position and replace it with an investment in the stocks that show the highest past three-month perfor-mance at time t.
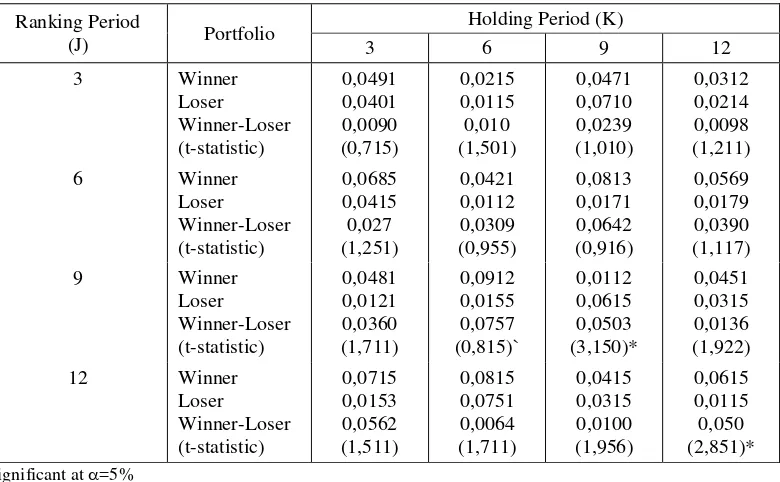
Table 3. present the monthly average returns of the strategies implemented on all stocks in all sample from 1996-1997, where we define Winners and Loser as the top and bottom 10 percent of past returns. The table shows that for the six month interval (J=6 and K=6), an equal-eighted portfolio formed from
stocks in the bottom decile of past six-month performance (loser portfolio) earn 1,12 percent (Malaysia) and earn 3,21 percent (Indonesia) and the corressponding winner portfolio earns 4,21 percent (Malaysia) and 3,74 percent (Indonesia). A Zero-cost relative strength portfolio, which we construct by buying the past winner and selling the past loser (Winner-Loser), gives a positive excess returns of 3,09 percent (Malaysia) and 0,53 percent (Indone-sia) per month. The correlation between the Winner and Loser portfolio is 0,52 (Malaysia) and 0,57 (Indonesia). We obtain the highest average returns of 0,81 percent (Malaysia) per month and 0,80 percent (Indonesia) per month (or 9,72 (malaysia) percent per year and 9,6 percent per year (Indonesia)) for a 12 month holding period (k=12), which we form by ranking the stocks on past 6 and 9 month performance (J=6 and 9). However, all strategies yield statistically insignificant returns except (J=9 and 9) and (J=12 and 12).
Fama and French (1993) among many others, show that firm size is an important factor that effect in the US securities in strongest in the small firms and declines sharply as market capitalization increases. Hong and Stein (1999) argue that firm-specific information, especially negative information, circulates only gradually through the investing public. If price momentum result from gradual information flow, then there should be relatively stronger profits in those stocks for which information gets out slowly (i.e. Small stock).To examine whether the small firm price momentum holds in Emerging Markets, we construct by first rangking all the stocks in three size-groups: small (lowest 30 percent), medium (midlle 40 percent), and large (highest 30 percent).
Several recent paper indicate that investors are particularly interested in trading volume (turnover), and that volume might influence the behavior of the returns momentum. Lee and Swaminathan (2000) suggest that turnover might indicate the level of investor interest in a stock. For example, the low-turnover losers are
likely to be at the bottom of their „life cycle‟
and a price reversal is likely, while a high volume loser may have plenty of negative price momentum. Chan et al. (2000) show that the momentum profits are higher for the portfolio of countries with higher lagged trading volume than portfolio of countries with lower lagged trading volume. These papers suggest that higher trading volume accentuate the returns continuation effect.
Table 3.A.: Returns of Relative Strength Decile Portfolio in Malaysia
Ranking Period
Sources: Result Research, 2002
We use turnover strategies to examine the role of the stock turnover on price momentum in our sample. We define turnover as the ratio of monthly trading volume divided by number of shares outstanding. We rank securities the
performance. This procedure generates a total of 18 momentum (Winner-Loser) portfolio sorted by country and turnover.
Empirical model is estimated using OLS. When the multiple regression was fitted to the data, we obtained result is the following analysis in table 3.A and 3.B.
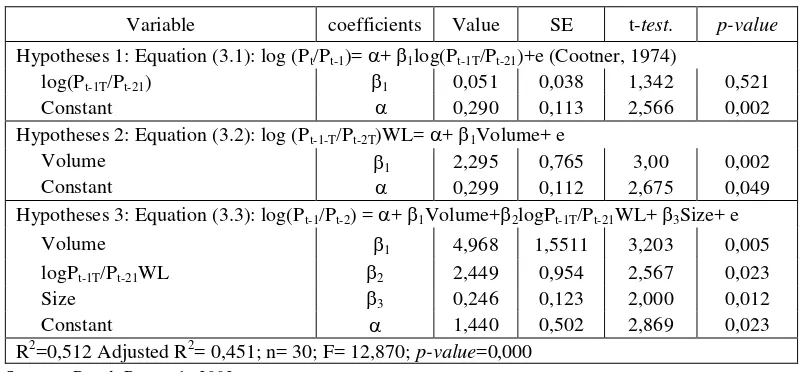
Table 3.B: Hypotheses Result in Indonesia
Variable coefficients Value SE t-test. p-value Hypotheses 1: Equation (3.1): log (Pt/Pt-1)= + 1log(Pt-1T/Pt-21)+e (Cootner, 1974)
log(Pt-1T/Pt-21) b1 0,051 0,038 1,342 0,521
Constant B 0,290 0,113 2,566 0,002
Hypotheses 2: Equation (3.2): log (Pt-1-T/Pt-2T)WL= + 1Volume+ e
Volume B1 2,295 0,765 3,00 0,002
Constant B 0,299 0,112 2,675 0,049
Hypotheses 3: Equation (3.3): log(Pt-1/Pt-2) = + 1Volume+2logPt-1T/Pt-21WL+ 3Size+ e
Volume B1 4,968 1,5511 3,203 0,005
logPt-1T/Pt-21WL 2 2,449 0,954 2,567 0,023
Size 3 0,246 0,123 2,000 0,012
Constant 1,440 0,502 2,869 0,023
R2=0,512 Adjusted R2= 0,451; n= 30; F= 12,870; p-value=0,000 Sources: Result Research, 2002.
CONCLUSION, LIMITATION, AND FUTURE RESEARCH
1. Conclusion and Discussion
This study intends to identify the effects of profitability of momentum strategies and volume on future earnings. The analysis units are 30 companies registered on the Jakarta Stock Exchange and Kualalumpur Stock Exchange from 1996-1997. Data is selected using purposive sampling. The data collection is performed using archaival. The statistic method used to test the hypotheses is regression analysis.
The study results are as follows: first, The results provide no support for the hypothesis that the effects of past returns on future returns which is consistent with the Fama (1991, 1992) but is inconsistent with the Rosenberg et al. (1985); second, the result support the effects of volume on profitability of momentum strategies which is consistent with the Gervais (1991) and Chambell et al. (1993), and Lee and Swaminathan (2000) but is
inconsistent with Jegadeesh and Titman (1993); third, the result support the effects of profitability of momentum strategies and volume on future returns which is consistent with the Jegadeesh et al. (1993) Strategies based on past returns and returns momentum yield significant profits over a 6-12 month horizon, Chan et al. (1996), Chan et al. (1996), Chan et al. (1996), Rouwenhorst (1998), Rouwenhorst (1999), Schireck et al. (1999) and Jegadeesh et al. (2001) but is inconsistent with the NN and Latane (1979); fourth, the normal data test and non response bias using t-test shows an insignificant result.
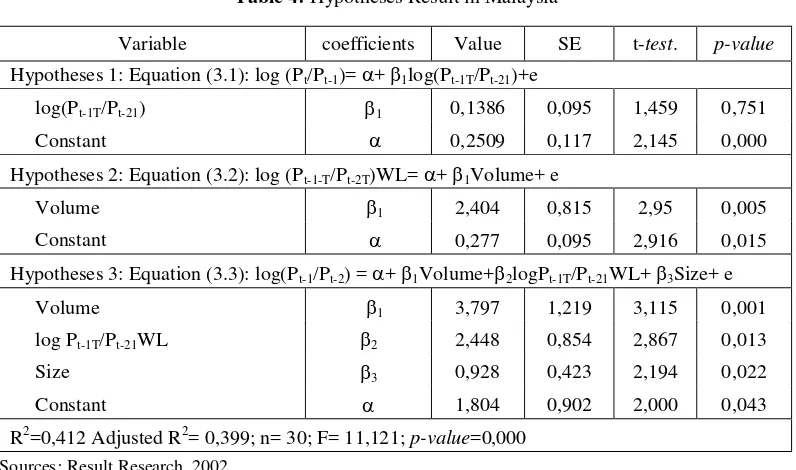
Table 4: Hypotheses Result in Malaysia
Variable coefficients Value SE t-test. p-value Hypotheses 1: Equation (3.1): log (Pt/Pt-1)= + 1log(Pt-1T/Pt-21)+e
log(Pt-1T/Pt-21) b1 0,1386 0,095 1,459 0,751
Constant B 0,2509 0,117 2,145 0,000
Hypotheses 2: Equation (3.2): log (Pt-1-T/Pt-2T)WL= + 1Volume+ e
Volume B1 2,404 0,815 2,95 0,005
Constant B 0,277 0,095 2,916 0,015
Hypotheses 3: Equation (3.3): log(Pt-1/Pt-2) = + 1Volume+2logPt-1T/Pt-21WL+ 3Size+ e
Volume B1 3,797 1,219 3,115 0,001
log Pt-1T/Pt-21WL 2 2,448 0,854 2,867 0,013
Size 3 0,928 0,423 2,194 0,022
Constant 1,804 0,902 2,000 0,043
R2=0,412 Adjusted R2= 0,399; n= 30; F= 11,121; p-value=0,000 Sources: Result Research, 2002.
2. Limitation and Future Research
This present study has several limitations:first, this paper only focuses on investment decision as financing decision determinants. Other studies have been investigated the interdependency between the financial policies (Adedeji, 1998; Jensen et al. 1992; Cruthley and Hansen, 1989); second, the present study only uses month-by-month data; third, the present study does not include variable of risk, such as variance or standard deviation of returns, beta, or other approach to measure the risk explicitly. This variable can be included as controlling variable in the model; and
fourth,
paper only focuses on future return.3. Future Research
Future research consists: first, further study can develops future earnings; and second, in the future, profitability of earnings momentum strategies based on proxy on standardized unexpected earnings and revisions of consensus forecasts.
REFERENCE
Affleck-Graves, J and Mendenhall, R, 1992. The Relation Between the Value Line Enigma and Post-Earnings-Announcement Drift. Journal of Financial Economics (31): 75-96.
Amihud, Y dan Mendelson, H, 1986. Asset Pricing and the Bid-Ask Spread. Journal of Financial Economics 17: 223-249. Asness, Clifford, 1995. The Power of Past
Returns to Explain Future Stock Returns. Working Paper, Goldman Sachs Asset Management.
____; J.Liew, and R. Stevens, 1996. Parallels Between the Cross-Sectional Predictability of Stock Returns and Country Returns. Working paper, Goldman Sachs Asset Maagement in NN.
____, 1997). The Interaction of Value and Momentum Strategies. Financial Analyst Journal (March/April): 29-36
in Returns. Journal of Financial Economics (25): 51-74.
Ball, Ray; Kothari, SP and Shanken, Jay, 1995. Problems in Measuring Portfolio Performance: An Aplication to Contrarian Investment Strategies. Journal of Financial Economics (38): 79-107 Banz, Rolf, 1981. The Relationship Between
Returns and Market Value of Common Stocks. Journal of Financial Economics (9): 3-18.
Barberis, Nicholas, Shleifer, Andrei, and Vishny, Robert, 1998: A Model of Investor Sentiment. Journal of Financial Economics (49): 307-343.
Basu, Sanjoy, 1983. The Relationship Between Earnings Yield, Market Value, and Returns for NYSE Common Stocks: Futher Evidence. Journal of Financial Economics (12): 129-156.
Bekaert G, Erb C, Harvey C, and Viskanta T, 1997. What Matters for Emerging Market Investment. Emerging Market Quartely (Summer): 17-46.
Bernard, Victor and Thomas, Jacob, 1989. Post-Earnings-Announcement Drift: Delayed Price Response or Risk Premium. Journal of Accounting Research (Vol 27, Supplement): 1-36.
Bernads, V, Thomas, J and Wahlen, J, 1995. Accounting-Based Stock Price Anomalies: Separating Market Inefficiencies from Research Design Flaws: Working Paper, University of Michigan.
Blume L, Easley D, and O‟Hara M, 1994.
Market Statistics and Technical Analysis: The Role of Volume. Journal of Finance (49): 163-181.
Campbell J, Grossman S, and Wang T., 1993. Trading Volume and Serial Correlation in Stock Returns. Quartely Journal of Economics (108): 905-940.
Chan, LKC Hamao,Y and Lakonishok, J., 1991. Fundamentals and Stock Returns in
Japan. Journal of Finance (46): 1739-1764.
Chan, Louis K.C., Narasimhan Jegadeesh, and Josef Lakonishok, 1996. Momentum Strategies. Journal of Finance (Vol 11, No, 5, December): 1681-1713
Chan Louis K.C., Narasimhan Jegadeesh, and Josef Lakonishok, 1999. The Profitability of Momentum Strategies. Association for Investment Management and Research: 80-90.
Chan, Kalok, Hameed, Allaudeen, and Tong, Wilson, 2000. Profitability of Momentum Strategies in the International Equity Markets. Journal of Financial and Quantitative Analysis (Vol 35, No 2, June): 153-172.
Chopra, Navin; Lakonishok J, and Ritter, JR, 1992. Measuring Abnormal Performance: Do the Stock Overreact. Journal of Financial Economics (31): 235-268. Conrad, J and Kaul, G, 1993. Long-Term
Market Overreaction or Biases in Computed Returns. Journal of Finance (48): 39-64.
Conrad J, Hameed A, and Niden C, 1994. Volume and Autocovariances in Short-Horizon Individual Security Returns. Journal of Finance (49): 1305-1329. Conrad J and Kaul G, 1998. An Anatomy of
Trading Strategies. Review of Financial Studies (11): 489-519.
Cootner, P, 1974. Random Character of Stock Market Prices, Cambridge MA:MIT Press in Hartono, Jogianto, (1998), Teori Portofolio dan Analisis Investasi, Edisi Pertama, BPFE, Yogyakarta.
Copeland, Thomas and Mayers, David, 1982. The Value Line Enigma (1965-1978): A Case Study of Performance Evaluation Issues. Journal of Financial Economics (10): 289-321.
Psychology and Security Market Under-and Overreactions. Journal of Finance (Vol LIII, No. 6, December): 1839-1885. Daniel K, Hirshleifer D, dan Subrahmanyam
A., 1998. A Theory of Overconfidence, Self-Attribution, and Security Market Under and Overreaction. Journal of Finance (53): 1839-1886.
Datar V, Narayan Naik, and Robert Radelife, 1998. Liquidity and Assets Returns: An Alternative Test. Journal of Financial Markets (1): 203-230.
DeBondt, Werner FM and Thaler, Richard H, 1985. Does the Stock Market Overreact? Journal of Finance (40): 793-805.
____(1987). Futher Evidence on Investor Overreaction and Stock Market Seasona-lity. Journal of Finance (42): 557-581. DeLong B; Shleifer A, Summers LH, and
Waldman RJ, 1990. Positive Feedback Investment Strategies and Destabilizing Rational Speculation. Journal of Finance (45): 379-395.
Fama, Eugene F, 1991. Efficient Capital Market II. Journal of Finance (46): 1575-1617.
Fama, Eugene F and French, Kenneth R, 1992. The Cross Section of Expected Returns. Journal of Finance (Vol. 47, No, 2 (June)): 427-65.
____.(1993). Common Risk Factors in the Returns on Stocks and Bonds. Journal of Financial Economics (Vol. 33, no 1 (February)): 3-56.
Fama, Eugene F. and French, Kenneth R., 1996. Multifactor Explanations of Asset Pricing Anomalies. The Journal of Finance (Vol. 51, No, 1, March): 55-84 Fama, E, 1998. Market Efficiency, Long Term
Returns and Behavioral Finance. Journal of Financial Economics (49): 283-306. Foster G, Olsen C, and Shevlin T, 1984.
Earnings Release, Anomalies, and the
Behavior of Security Returns. The Accounting Review (59): 574-603. Gervais S, Kaniel R, and Mingelgrin D, 1998.
The High Volume Returns Premium. Working Paper, Univ of Pennsylvia. Givoly, Dan and Lakonishok, Josesef, 1979.
The Information Content of Financial
Analysts‟ Forecasts of Earnings: Some
Evidence on Semi-Strong Inefficiency. Journal of Accounting and Economics (Vol 1, No 3, December): 165-185. Grinblatt MS, Titman S, and Wermers R,
1995. Momentum Strategies, Portfolio Performance, and Herding: A Study of Mutual Fund Behavior. American Economics Review (85): 1088-1105. Grundy B and McNichols M, 1990. Trade and
the Revelation of Information through Prices and Direct Disclosure. Review of Financial Studies (2): 495-526.
Gujarati, D. N., 1995. Basic Econometrics, 3rd ed., Singapore: McGraw-Hill, Inc.
Hong, Harrison and Stein, Jeremy C., 1999. A Unified Theory of Under reaction, Momentum Trading, and Overreaction in Asset Markets. (Vol LIV, No 6, December): 2143-2184.
Jegadeesh, Narasimhan and Titman, Sheridan, 1991. Short Horizon Returns Reversals and the Bid Ask Spread. Working Paper, University of California at Los Angeles. Jegadeesh, Narasimhan and and Titman,
Sheridan, 1993. Returns to Buying Winners, and Selling Losers: Implications for Stock Market Efficiency. Journal of Finance (Vol 48, no. 1 (March)): 65-91. Jegadeesh, Narasimhan and Titman, Sheridan,
1995. Short Horizon Returns Reversals and Intermediate Stock Price Trends. Journal of Finance (25): 143-148. Jegadeesh, Narasimhan and Titman ,Sheridan,
Explanations. The Journal of Finance (Vol LVI, No 2, April): 699-720.
Kaul, Gautam and Nimalendran, M, 1990.
Price Reversals‟ Bid Ask Error or market Overrection? Journal of Financial Economics (28): 67-93.
Lakokonishok, Josef, Andrei Shleifer, and Robert W Vishny, 1992. The Impact of Institutional Trading on Stock Prices. Journal of Financial Economics (32, August): 23-43.
____(1994). Contrain Investment, Extrapo-lation, and Risk. Journal of Finance (Vol. 49, No. 5 (December)): 1541-78.
Latane, Henry A and Jone, Charles P., 1979. Standardized Unexpected Earnings 1971-1977. Journal of Finance (Vol 34, No 3 (June)): 717-724.
Lee; Charles M. C. and Swaminathan, Bhaskaran, 2000. Price Momentum and Trading Volume. The Journal of Finance (Vol LV, No 5, Oct): 2017-2069.
Lintner, John, 1965. The Valuation of Risk Assets and the Selection of Risky Investments in Stock Portfolios and Capital Budgets. Review of Economics and Statistics (47): 13-37.
Lo, Andrew W and MacKinlay, AC, 1990. When are Contrarian Profits Due to Stock Market Overrection. Review of Financial Studies (3): 175-205.
MacKinlay, A Craig, 1995. Multifactor Models do not Explain Deviations from the CAPM. Journal of Financial Economics (38): 3-28.
Mardiyah, Aida Ainul, 2002. The Effect of Profitability of Momentum Strategies and Volume on Future Returns: Evidence in Indonesia. Accounting National Sympo-sium 5rd at at Diponegoro University, Semarang, September 5th.
NN, material of Preliminary PHD Program. Rosenberg, Bar; Reid,Kenneth, and Lanstein,
Ronald, 1985. Persuasive Evidence of Market Inefficiency. Journal of Portfolio Management (11): 9-17.
Rouwenhorst, K. Geert, 1998. International Momentum Strategies. The Journal of Finance (Vol LIII, No. 1, February): 267-284
Rouwenhorst, K. Geert, 1999. Local Returns Factors and Turnover in Emerging Stock Markets. The Journal of Finance (Vol LIV, No 4, August): 1439-1464.
Schiereck, Dirk, Werner De Bondt, and Martin Weber, 1999. Contrarian and Momentum Strategies in Germany. Association for Investment Management and Research: 104-116.
Sharpe, William F, 1964. Capital Asset Price: A Theory of Market Equilibrium Under Conditions of Risk. Journal of Finance (18): 425-442.