ANALYSIS AND IDENTIFICATION SPIKING CHEMICAL COMPOUNDS RELATED TO
CHEMICAL WEAPON CONVENTION IN UNKNOWN WATER SAMPLES USING
GAS CHROMATOGRAPHY AND GAS CHROMATOGRAPHY
ELECTRON IONIZATION MASS SPECTROMETRY
Harry Budiman*
Research Center for Chemistry, Indonesian Institute of Sciences Kawasan PUSPIPTEK, Serpong, Banten 15314
Received 14 September 2007; Accepted 24 september 2007
ABSTRACT
The identification and analysis of chemical warfare agents and their degradation products is one of important component for the implementation of the convention. Nowadays, the analytical method for determination chemical warfare agent and their degradation products has been developing and improving. In order to get the sufficient analytical data as recommended by OPCW especially in Proficiency Testing, the spiking chemical compounds related to Chemical Weapon Convention in unknown water sample were determined using two different techniques such as gas chromatography and gas chromatography electron-impact ionization mass spectrometry. Neutral organic extraction, pH 11 organic extraction, cation exchanged-methylation, triethylamine/methanol-silylation were
performed to extract the chemical warfare agents from the sample, before analyzing with gas chromatography. The
identification of chemical warfare agents was carried out by comparing the mass spectrum of chemicals with mass spectrum reference from the OPCW Central Analytical Database (OCAD) library while the retention indices calculation obtained from gas chromatography analysis was used to get the confirmation and supported data of the chemical warfare agents. Diisopropyl methylphosphonate, 2,2-diphenyl-2-hydroacetic acid and 3-quinuclidinol were found in unknown water sample. Those chemicals were classified in schedule 2 as precursor or reactant of chemical weapons compound in schedule list of Chemical Weapon Convention.
Keywords: gas chromatography, mass spectrometry, retention indices, OCAD library, chemical warfare agents
INTRODUCTION
Chemical Weapon Convention (CWC) entered into force on 29 April 2007. By May 2005, 165 countries had signed and ratified the convention. The CWC prohibits the development, production, stockpiling, and the use of chemical weapons, except used for purpose not prohibited by CWC such as industrial, agriculture, research, medical, pharmaceutical, riot control agent and other peaceful purposes. Chemical weapons are defined as toxic chemical which can cause death, temporary incapacitation, or permanent harm to humans or animal by its chemical action on life processes. These include their precursor. Precursor is a chemical needed for production the toxic chemical, but can also be degradation product of toxic chemical [1,2]. Therefore, the identification and analysis chemical warfare agents and their degradation products is one of important component for the implementation of the convention. Nowadays, the analytical method for determination chemical warfare agent and their degradation products has been developing and improving. The most frequently methods used for identification and analysis chemical warfare agents, their precursor and degradation products are based on gas chromatography in combination with mass spectrometry as detector (GC-MS) or tandem mass spectrometry (GC-MS-(GC-MS), Liquid
Chromatography coupled with mass spectrometry (LC-MS) and Nuclear Magnetic Resonance (NMR) [3,5]. GC-MS is used to identify and analyze volatile Chemical Warfare Agent (CWA) or non volatile degradation product of CWA after derivatisation. Both Electron-impact Ionization (EI) and Chemical Ionization (CI) can be used as ionization techniques of GC-MS for verification of CWA in sample. Analyses GC-MS of nerve agents under EI condition often produce in extensive fragmentation which may provide the important of structural information, while CI, typically used methane, ammonia, or isobutene as reagent gas, is commonly used to provide the molecular weight information. Meanwhile, LC-MS is usually performed to analyze directly non volatile CWA in order to avoid the major source of error which might be caused by derivatisation and the need to evaporation aqueous solution till dryness [2,4]. For screening purposes, GC Flame Ionization Detector (GC-FID) and GC with selective detectors such as Nitrogen Phosphorus Detector (NPD), Flame Photometric Detector (FPD) mode Phosphor or Sulfur, Electron Capture Detector (ECD), Atomic Emission Detector (AED) are frequently used [2,3]. Also Retention Indices values (RI) can be used to screen the presence of CWA in sample. The RI values support GC-MS identification so that the
GC-EI/MS to get the sufficient analytical data for proving the spiking chemicals. Two different techniques must be used to confirm the spiking chemicals in sample and at least one of these techniques must be spectrometric technique as Organisation for the Prohibition of Chemical Weapons requirements in proficiency testing [1,8].
EXPERIMENTAL SECTION
Material
Dichloromethane, 0.2 N hydrochloric acid (HCl), 0.2 N ammonia (NH4OH), bis(trimethylsilyl) trifluoroacetamide (BSTFA), SCX Cartridge Varian 100 mg, methanol, aquademineral, acetonitrile, 1 % triethylamine in methanol (TEA/MeOH), potassium hydroxide (KOH), diazald, ethylacetate, sodium sulfate anhydrous, nitrogen gas.
Sample Preparation
Neutral dichloromethane extraction
pH water sample was checked by pH paper and adjusted pH until neutral by adding 0.1 N NH4OH or 0.1 N HCl. Water sample was extracted with 2 x 2.5 mL dichloromethane for 10 min. The dichloromethane was separated from water layer and added by Na2SO4 anhydrous. One milliliter dichloromethane layer was transferred into vial and concentrated until 0.1 mL by mild flow N2.
pH 11 dichloromethane extraction
pH water sample was checked by pH paper and adjusted pH until 11 by adding 0.1 N NH4OH or 0.1 N HCl. Water sample was extracted with 2 x 2.5 mL dichloromethane for 10 min. The dichloromethane was separated from water layer and added by Na2SO4 anhydrous. One milliliter dichloromethane layer was transferred into vial. Then 100 µL BSTFA was added for silylation process at 60 oC for 30 min.
Cation Exchange, Methylation
Cation exchange cartridge (SCX) was conditioned with 1 mL methanol and 1mL water. 10 mL water sample was eluted into SCX cartridge. Eluat from SCX cartridge was collected and transferred into evaporation flask. Eluat was evaporated till dryness at 35 mBar, 50 oC. Then, residue was dissolved by 1 mL acidic methanol. Solution was methylated by diazomethane (CH2N2) which was produced from the reaction between saturated KOH and diazald.
fraction was transferred into vial and evaporated till dryness again by mild flow N2. The residue was dissolved by 500 µL acetonitrile and added with 500 µL BSTFA for silylation process at 60 oC for 30 min.
Gas Chromatography
GC Flame Ionization Detector
Micromat HRGC 412 Nordion, two channels FID: a) SE-54 column, dimension 30 m x 0.25 mm x 0.25 µm (column length X ID X film thickness), b) OV-1701 column, dimension 30 m x 0.25 mm x 0.25 µm.
GC Nitrogen Phosphorus Detector-Flame Photometric Detector (sulphur channel)
HP Agilent 6890 Series GC System, HP-5 MS column, dimension 30 m x 0.25 mm x 0.25 µm. Make up gas: Nitrogen.
GC Electron Ionization Mass Spectrometry (EI/MS)
Perkin Elmer, Auto system XL Gas Chromatograph, Turbo Mass Gold, Mass Spectrometer. Zebron 5-MS column, dimension 30 m x 0.25 mm x 0.25 µm. Ionization polarity: positive, electron energy 70 eV, scan range 40-500 m/z.
Separation condition of GC above were carrier gas Helium, flow rate 2 mL min-1, split less injection, injector temperature 250 oC, temperature program: initial temperature 40 oC (1 min), rate 10 oC/min, final temperature 28 oC (5 min).
GC and GC EI MS injection
A 2,5 µL of quality control solution was injected to verify the performance of instrument. The quality control solution contained 5 ng of trimethyl phosphate, 2,6-dimethyl phenol, 5-chloro-2-methylaniline, tri-n-butylphosphate, dibenzothiophene, malathion, and methyl stearate, also contained C series (C8, C10,…,C24) for retention indices calculation of component in sample. For analysis sample, 1 µL of aliquots from each step of sample preparation above were injected to GC-FID, GC-NPD, GC-FPD (sulphur channel) and GC EI/MS.
RESULT AND DISCUSSION
Identification of Diisopropyl Methylphosphonate (DIMP)
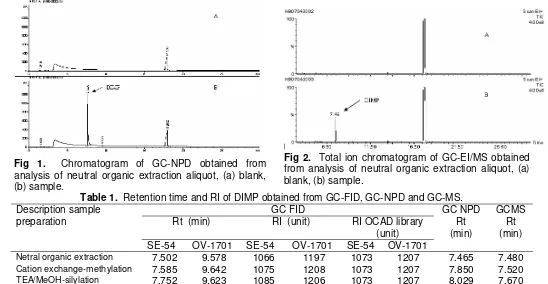
Fig 1. Chromatogram of GC-NPD obtained from analysis of neutral organic extraction aliquot, (a) blank, (b) sample.
Fig 2. Total ion chromatogram of GC-EI/MS obtained from analysis of neutral organic extraction aliquot, (a) blank, (b) sample.
Table 1. Retention time and RI of DIMP obtained from GC-FID, GC-NPD and GC-MS.
GC FID GC NPD GCMS
Rt (min) RI (unit) RI OCAD library
(unit) Description sample
preparation
SE-54 OV-1701 SE-54 OV-1701 SE-54 OV-1701 Rt (min)
Rt (min)
Netral organic extraction 7.502 9.578 1066 1197 1073 1207 7.465 7.480
Cation exchange-methylation 7.585 9.642 1075 1208 1073 1207 7.850 7.520
TEA/MeOH-silylation 7.752 9.623 1085 1206 1073 1207 8.029 7.670
sulphur channel. These indicate that the compound only contains heteroatom phosphorus or nitrogen, or both nitrogen and phosphorus.
In GC FID, The DIMP peak was found at 7.502 min in SE-54 and 9.578 in OV-1701 column and the RI monitoring obtained the good comparison and match with RI library in OCAD for DIMP, the difference of RI was less than ± 20 units (Table 1). DIMP also can be analyzed from cation exchange-methylation and TEA/MeOH-silylation aliquot by GC-FID and GC-NPD.
After GC-FID and GC-NPD screening, GC-EI/MS was performed to identify the spiking chemical founded. Total Ion Chromatogram (TIC) showed the presence of high intensity peak at 7.48 min in netral organic extraction aliquot (Fig 2).
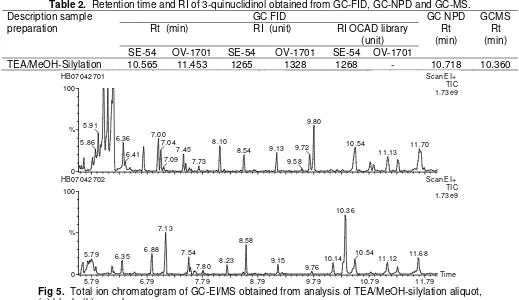
The mass spectrum of peak produced base peak at m/z 97 which indicates the presence of fragmentation [CH6PO2]
+
(Fig 3). The base peak at m/z 97 and accom-
Fig 3. GC-EI/MS mass spectrum of peak at 7.48 min corresponding to DIMP
panied by the presence of fragmentation losing water molecule at m/z 79 were characteristic for dialkyl methylposphonate family [6]. The comparison of mass spectrum with OCAD and NIST library resulted the good similarity for diisopropyl methylphosphonate compound. Dialkyl methylphosphonate family is usually founded as side product of alkyl alkylphos-phonofluoridate (schedule 1 compound) synthesis, for instance disopropyl methylphosphonate was founded in isopropyl methylphosphonofluoridate (sarin) synthesis [7]. Therefore, extracted ion m/z 99: [CH5FO2P]+, characteristic for the presence of methylphosphono-fluoridate [6], was used to observe the possibility of
(unit) (min) (min) SE-54 OV-1701 SE-54 OV-1701 SE-54 OV-1701
TEA/MeOH-Silylation 10.565 p p y 11.453 1265 1328 1268 p y p- 10.718 10.360
0 100
%
HB07042701 Scan EI+
TIC
HB07042702 Scan EI+
TIC 1.73e9
5.79 6.79 7.79 8.79 9.79 10.79 11.79 Time
10.36
Fig 5. Total ion chromatogram of GC-EI/MS obtained from analysis of TEA/MeOH-silylation aliquot, (a) blank, (b) sample.
sarin contained in water sample, but m/z 99 was not shown in Extracted Ion Chromatogram (EIC) of peak 7.48 min. DIMP compound also can be identified by GC-EI/MS in cation exchanged aliquot and TEA/MeOH-silylation aliquot, the same as GC-FID and GC-NPD screening.
Identification of 3-quinuclidinol
The second compound identified from water sample is 3-quinuclidinol. This compound can be extracted by basic solution TEA/MeOH after the amount of water sample evaporated till dryness, because it is basic and contains heteroatom N.
For analyzing with GC and GC-MS, it has to be derivatised first with BSTFA to convert the non volatile and polar compound into volatile compound as silyl derivative form, as shown in following scheme reaction below.
Therefore, It only can be determined by GC and GC-MS from TEA-MeOH Silylation aliquot. The presence of heteroatom N in this compound, gave the responds at Rt: 10.718 min in GC-NPD (Fig 4). Peak of
3-quinuclidinol was shown at 10.565 min in SE-54 and 11.453 in OV-1701 column. And the RI calculation showed the good and match result for 3-quinuclidinol which had ± 20 unit in difference, after comparing RI with OCAD library (Table 2).
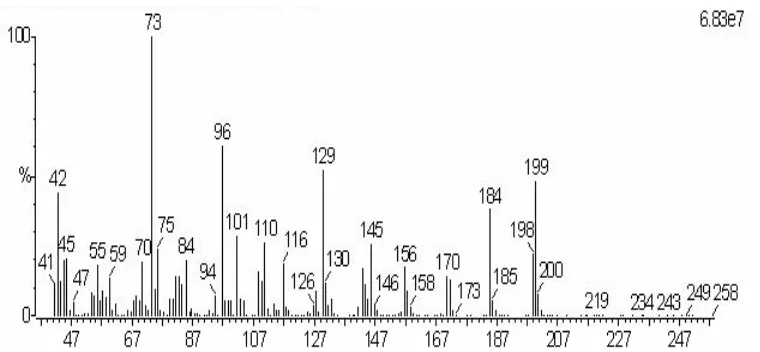
Identification with GC-EI/MS, the compound was found at Rt 10.36 min in TEA/MeOH aliquot (Fig 5). The fragmentation of m/z 73 was present in its mass spectrum which came from trimethylsilyl (TMS) and also the molecular ion [M+1] was shown at m/z 199. Quinuclidinol-TMS gives a strong molecular ion [M+1] at m/z 199, plus a number of intense fragment ions [2]. Meanwhile, m/z 126 for the fragmentation of quinuclidinyl part was characteristic for 3-quinuclidinol which was obtained from the difference in m/z 199 and 73 (Fig 6) [6]. The compound as silyl derivative, 3-quinuclidinyl trimethylsilylether was found, when comparing the mass spectrum with OCAD and NIST library.
Identification of 2,2-diphenyl-2-hydroacetic acid
Fig 6. GC-EI/MS mass spectrum of peak at 10.36 min corresponding to 3-quinuclidinyl trimethylsilyl ether
Table 3. Retention time and RI of benzilic acid obtained from GC-FID, GC-NPD and GC-MS.
GC FID GC NPD GCMS
Rt (min) RI (unit) RI OCAD library
(unit)
Rt (min)
Rt (min) Description sample
preparation
SE-54 OV-1701 SE-54 OV-1701 SE-54 OV-1701
TEA/MeOH-silylation 18,720 - 1899 - 1908 - - 17,840
Cation exchange-methylation 18,380 20,520 1852 2056,16 1853 2058 - 17,400
methylation process (B), as shown in following scheme reaction below.
1 7 .4 3 1 7 .5 3 1 7 .6 3 1 7 .7 3 1 7 .8 3 1 7 .9 3 1 8 .0 3 1 8 .1 3 1 8 .2 3 T im e 0
1 0 0
% 0 1 0 0
%
HB 0 7 0 4 2 7 0 1 S c an E I+
T IC 5 .6 7 e 9
1 8 .1 6 1 8 .0 6
HB 0 7 0 4 2 7 0 2 S c an E I+
T IC 5 .6 7 e 9 1 7 .5 6
1 7 .7 8 1 7 .7 1
1 7 .9 1 1 7 .8 4
1 8 .0 3
O H
O O H
F3C N
O S i S i
N N+ O H
O O S i O
O O
S i
B S T F A
D i a z o m e t h a n e
m e t h y l b e n z i l a t e b i s ( t r i m e t h y l s i l y l ) b e n z i l a t e
b e n z i l i c a c i d
The peak of compound was identified at Rt 18.720 and 18.380 in GC-FID chromatogram, respectively for TEA/MeOh aliquot and kation exchange-methylation aliquot, but no peak was observed around 18-20 min when screening with GC-NPD and GC-FPD sulfur channel (Table 3), so no heteroatom N, P or S was contained in this compound. the RI monitoring and comparison RI with OCAD library resulted that the compound was found as bis(trimethylsilyl) benzilate and methyl benzilate which had RI still in the range ± 20 unit.
Peak of Bis trimethylsilyl benzilate was shown at Rt 17.84 min in GC-EI/MS analysis (Fig 7). m/z 182 obtained from difference between m/z 73 and 255 is fragmentation of [(C6H5)2COH] molecule which is characteristic for benzilic acid (Fig 8) [6]. The EI spectrum of benzilic acid-TMS shows no molecular ion [M+1], two characteristic ions at m/z 357, [M-Me]+, and m/z 329, [M-CH3CO]+ and a base peak at m/z 255, [(C6H5)2COTMS]
+
(Fig 8) [2].
(A)
(B)
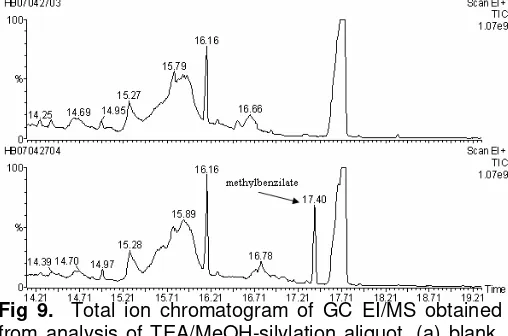
Fig 7. Total ion chromatogram of GC EI/MS obtained from analysis of TEA/MeOH-silylation aliquot, (a) blank, (b) sample.
Fig 9. Total ion chromatogram of GC EI/MS obtained from analysis of TEA/MeOH-silylation aliquot, (a) blank, (b) sample.
Fig 10. GC EI/MS mass spectrum of peak at 17.40 min corresponding to methylbenzilate.
In the other hand, methylbenzilate was found at Rt 17.40 min in cation exchanged-methylation aliquots (Fig 9). It is formed by the reaction of diazald with benzilic acid, as shown in methylation scheme reaction (B) above. m/z 105 from fragmentation of benzoyl cation [C6H5CO]
+
and m/z 182 from fragmentation of [(C6H5)2COH]
+
was present in the mass spectrum of peak which are characteristic for benzilic acid (Fig 10) [6].
Either 3-quinuclidinol or benzilic acid were degradation product compound of 3-quinuclidinyl benzilate (BZ) which is classified into schedule 2 in chemical weapon convention. The BZ is not relative stabile in the environment and degraded into those compounds by hydrolysis reaction [2], as shown in following scheme reaction below.
Therefore, observation of BZ was done by using its characteristic extracted ions such as m/z 105 and m/z 183 for diphenyl glycolic part, m/z 126 for quinuclidinyl part of molecule and a weak molecular ion signal at m/z 337 [6]. They were not shown in extracted ion chromatogram of peak 17.84 min (Fig 8), so the BZ was not present in water sample.
fulfilled the requirements of OPCW proficiency testing to use at least two analytical techniques. The water sample contained three chemicals related to the chemical weapon convention: diisopropyl methylphosphonate, 3-quinuclidinol and 2,2-diphenyl-2-hydroacetic acid. Those chemicals were clasified into schedule 2 as precursor and degradation products in chemical weapon convention.
ACKNOWLEDGEMENT
Authors would like to thank to Martin Söderström, Vesa Häkkinen, Marja Leena Kuituinen, Sri Sumartini, all staff in Finnish Institute for Verification of the Chemical Weapons Convention (VERIFIN) for their support and the Ministry for Foreign Affairs of Finland who funded this project.
REFFERENCES
1. Anonim, 1997, Convention on the Prohibition of the Development, Production, Stockpiling and Use of
Chemical Weapons and on their Destruction,
Technical Secretariat of the Organisation for Prohibition of Chemical Weapons, The Hague.. Http://www.opcw.nl.
2. Black, R. M, and Muir, B., 2003, J. Chromatogr. A., 1000, 253-281.
3. Kientz, Ch.E., 1998, J. Chromatogr. A., 814, 1-23. 4. Hootjschuur, E.W.J, Kientz, Ch.E., and Brinkman,
U.A.Th., 2002, J. Chromatogr. A., 982, 177-200. 5. Hootjschuur, E.W.J, Hults, A.G., de Jong, Ad.L.,
de Reuver, L.P., van Krimpen, S.H., van Baar, B.L.M., Wils, E.R.J., Kientz, Ch.E., and Brinkman, U.A.Th. 2002. Trends in Anal. Chem. 21: 2, p 116-130.
6. Wils, E.R.J., 2005, Chemical Weapons Convention Chemicals Analysis: Gas Chromatography/Mass Spectrometry in Analysis of Chemicals Related to
the Chemical Weapons Convention. edited by
Markku Mesilaakso. p 249-279.
7. Black, R.M., and Read, R.W., 2005, Chemical Weapons Convention Chemicals Analysis: Liquid Chromatography/Mass Spectrometry in Analysis of Chemicals Related to the Chemical Weapons
Convention, edited by Markku Mesilaakso, p.
284-315. N
O H O
O
N O H
O H
O O H
B Z
B a s i c
+
Q u i n u c l i d i n - 3 - o l B e n z i l i c a c i d