Response of plant nutrient
stoichiometry to fertilization
varied with plant tissues in a
tropical forest
Qifeng Mo1,2,3, Bi Zou1,3, Yingwen Li1,3, Yao Chen1,2, Weixin Zhang1,3, Rong Mao4, Yongzhen Ding5, Jun Wang1,3, Xiankai Lu1, Xiaobo Li1,3, Jianwu tang6, Zhian Li1,3 & Faming Wang1,3
plant N:p ratios are widely used as indices of nutrient limitation in terrestrial ecosystems, but the response of these metrics in diferent plant tissues to altered N and P availability and their interactions remains largely unclear. We evaluated changes in N and p concentrations, N:p ratios of new leaves (<1 yr), older leaves (>1 yr), stems and mixed ine roots of seven species after 3-years of an N and p addition experiment in a tropical forest. Nitrogen addition only increased ine root N concentrations. P addition increased P concentrations among all tissues. The N × p interaction reduced leaf and stem P concentrations, suggesting a negative efect of N addition on p concentrations under p addition. the reliability of using nutrient ratios as indices of soil nutrient availability varied with tissues: the stoichiometric metrics of stems and older leaves were more responsive indicators of changed soil nutrient availability than those of new leaves and ine roots. However, leaf N:P ratios can be a useful indicator of inter-speciic variation in plant response to nutrients availability. this study suggests that older leaf is a better choice than other tissues in the assessment of soil nutrient status and predicting plant response to altered nutrients using nutrients ratios.
Nitrogen (N) and phosphorus (P) are commonly found to be the limiting elements for the primary production since they are essential nutrients for plant growth1,2. he response of plants to atmospheric
deposition, climate change, and other human inluences will therefore be mediated by changes in the availability of these elements3. Previous studies indicated that biological processes in many ecosystems
with young soils might be limited by the low supply of N, while those with old soils might be limited by P2. he P limitation occurred because P was primarily derived from rock weathering, and P loss from
the soil runof could hardly be compensated by other pathways4. Due to increasing fuel combustion and
human N ixation worldwide, more and more ecosystems are facing a substantial increase of N inputs. herefore, phosphorus limitation could be more widespread than generally acknowledged in a changing world.
Tropical forests occur on highly weathered soils, where much of the original P-rich parent material has been lost, and most of the remaining P is occluded on iron and aluminum oxides5. herefore, it is
1Key Laboratory of Vegetation Restoration and Management of Degraded ecosystems, South china Botanical
Garden, chinese Academy of Sciences, Guangzhou 510650, china. 2University of chinese Academy of Sciences,
Beijing 100049, china. 3Xiaoliang Research Station for tropical coastal ecosystems, Maoming 525029, china. 4northeast institute of Geography and Agroecology, chinese Academy of Sciences, changchun 130102, china. 5Agro-environmental Protection institute, 300191 tianjin, P.R. china. 6ecosystems center, Marine Biological
Laboratory, Woods Hole, MA, 02543, USA. correspondence and requests for materials should be addressed to Z.L. (email: [email protected]) or f.W. (email: [email protected])
www.nature.com/scientificreports/
generally believed that plant growth might be limited by P in tropical forests6–8. However, a meta-analysis
of nutrient addition experiments suggested that N limitation was equally strong for temperate and trop-ical forests9. Recent studies also suggested that nutrient limitation was complex and oten regulated by
several interacting resources, collectively regarded as the multiple limitation resources theory10,11. For
example, in a tropical forest, seedling growth rate was limited by multiple nutrients (N, P and K) and their interaction12. hese conlicting results relect an uncertainty in the nutrient limitation of tropical
forests. herefore, a better understanding of nutrient limitation in tropical forests may be critical for mitigating climate change, since tropical forests play an important role in the global carbon (C) cycle13.
Examining plant tissues nutrient concentrations and N:P ratios within the same species in experimen-tal N and/or P addition sites is a useful approach to evaluate the nutrient status of ecosystems14,15, since
the variations of N:P ratios generally could be interpreted by the supply of nutrients. However, only a handful of ield fertilization studies have been conducted in tropical forests, and most of these studies only reported plant growth rates. For example, Alvarez-Clare et al.16 found that trees per plot increased
basal area with P addition ater 2.7 years fertilization in a tropical forest of Central America, indicating a P limitation of this tropical forest. Denslow et al.17 reported that added N also increased the tree trunk
growth in a Hawaiian young tropical forest. More recently, Ceccon et al.18 addressed seedling growth in
response to nutrient addition in two Mexican tropical forests and observed increased seedling growth with N addition in a young secondary forest and with P addition in a 60-year-old forest. Santiago et al.12
suggested that the seedling growth rate in Panamanian tropical forests was limited by multiple nutrients. However, seedlings may have diferent nutrient requirements than their adult counterparts. hese results indicated that our knowledge of limiting nutrients in tropical forests was still rare and inconsistent.
Plant nutrient concentrations and their stoichiometric ratios were widely used as indicators for plant nutrient status, and nutrient supply of ecosystems19. However, previous studies mainly focused on new
green leaves12,20, while neglecting the responses of other plant tissues, such as older leaves, stems and
ine roots to experimental N and P addition21,22. Actually, due to the stronger homeostatic control over
N:P ratios in new leaves than in older leaves or stems23, the allocation or storage of excess N or P
uptake from soils could preferably occur in stems or older leaves rather than in new leaves when only one of these nutrients were limiting24,25. Moreover, the active new leaves could also acquire nutrients
through the nutrient resorption or movement within plants24. he N:P ratios in new leaves thus would
be less responsive to altered soil nutrients availability than those in other plant tissues22. herefore, it is
necessary to investigate the responses of diferent plant tissues to altered soil N or P availability due to environmental changes.
Most tropical forest fertilization experiments were conducted in tropical America or the Hawaiian islands, though similar studies rarely occurred in Asia26, where about 393 million ha of tropical forests
exist27. Tropical Asia, one of the ive major regions of tropical forests worldwide (including tropical
America, Africa, Asia, Madagascar island and New Guinea), has its distinct ecological traits and species composition28. For example, the understory of Asian tropical forests is generally dominated by sterile
saplings of canopy trees, whereas that of the neotropics is rich in fruiting shrubs and small trees29. his
diference not only afects the understory frugivores, but also had a critical role in canopy trees regen-eration. hese diferences also suggest that plant community in Asian tropical forest may have diferent response to nutrient fertilization as those in the neotropics. herefore, equally assessing the response of Asian tropical forests to fertilization is valuable for our understanding of tropical forests.
Southern China, located in subtropical and tropical Asia, has a large area of tropical forests, most of which are secondary forests, which were established on previously deforested land30. Due to fast
eco-nomic development, this region is sufering from serious atmosphere N deposition31. Here, we report N
and P concentrations and N:P ratios in new leaves, older leaves and stems of seven species and mixed ine roots ater three years of N and P fertilization in a secondary tropical forest. We expect that: 1) due to high N deposition in this region, the forest should be P limited; and thus N addition would have a relatively weak efect on N concentrations and N:P ratios while P addition would dramatically increase/ decrease P concentrations/N:P ratios of plant tissues; 2) N and P concentrations would vary among dif-ferent plant tissues, and the values in older leaves, stems and ine roots would be more greatly altered by changed nutrient status than those in new leaves.
Results
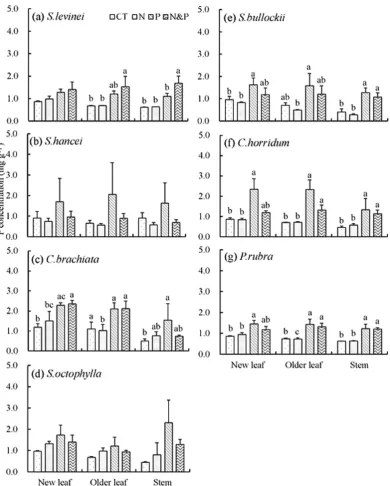
Nitrogen (N) and phosphorus (p) concentrations in new leaves, older leaves and stems. Ater several years N and P fertilization, the soil available N and P were signiicantly increased by N and P addition (Table 1). In the seven species, plant N concentrations showed a consistent pattern in diferent tissues, with much higher value in new and older leaves than that in stems (Fig. S1). Moreover, N con-centrations in new leaves, older leaves and stems exhibited consistent species variation (Table 2, P< 0.001
for all), with the values ranging from 13 mg g−1 to 18 mg g−1, and Carallia brachiata showed higher N
concentrations than other species (Fig. S1). Nitrogen concentrations of new leaves, older leaves and stems were neither signiicantly altered by N addition nor P addition (Table 2, P> 0.05 for three tissues). In
+ N plots, N concentrations in new leaves and older leaves were slightly higher (5%–20%) than those
Sampling
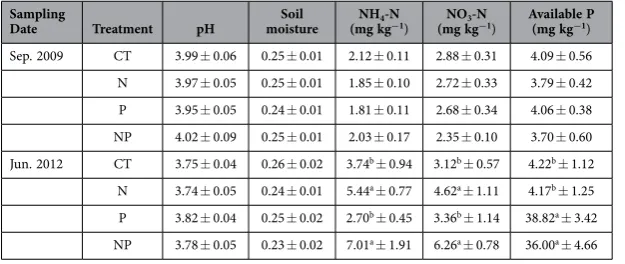
Table 1. General soil chemical properties (0–10 cm) in September, 2009 and June 2012 (mean ± SE, n = 5). Note: Diferent lowercase letters denote signiicant diferences between treatments (LSD test,
p< 0.05).
Plant Tissues Sources N concentration P concentration N:P Ratios
New leaves
www.nature.com/scientificreports/
in the remaining three species (Syzygium hance, Syzygium bullockii and Canthhium horridum), stem N concentrations had negative response to N addition (Fig. S1 b, e & f).
Plant tissue P concentrations had the same pattern as N concentrations among diferent tissues (Fig. 1). Nitrogen addition did not signiicantly afect P concentrations in new leaves and older leaves (Table 2), but signiicantly afected P concentrations in stems (P= 0.03, Table 2). Compared with CT plot, + N plots had 2%–80% higher stem P concentrations in ive species (Fig. S3 c). Furthermore, the + NP plots had lower plant P concentrations than + P plots in all species except Syzygium levinei (Fig. 1
& Fig. S3), suggesting signiicant interaction of N × P on P concentration (Table 2, P= 0.01, 0.07 and 0.02 for new leaves, older leaves and stems, respectively). P addition signiicantly increased P concentra-tions in new leaves, older leaves and stems (Table 2, P< 0.001 for all three tissues). In + P plots, the P
concentrations were signiicantly increased by 57%–169% in new leaves, 51%–228% in older leaves and 63%–232% in stems for all seven species relative to CT plot (Fig. S3). he relative efect (compared to the CT, RE) of P concentrations in + P plots in stems was generally higher than the corresponding value
Figure 1. Phosphorus (P) concentrations (mg g−1) in plant tissues of seven tree species exposed to N
in new leaves and older leaves (Fig. 2), suggesting a greater variation of P concentrations in stems than that in leaves in response to P addition.
Species had a signiicant efect on plant tissue N:P ratios (Table 2, P< 0.01), with the values ranged
from 15 to 21 in new and older leaves and from 10 to 18 in stems among the seven species (Fig. 3). Nitrogen addition signiicantly afected the N:P ratios in new leaves and older leaves (Table 2, P= 0.01 and P= 0.03), but not in stems. However, P addition signiicantly decreased the N:P ratios in all tissues (Table 2, P< 0.001 for all three tissues). Compared to CT, + P plots decreased 16%–61% N:P ratios in
new leaves, 21%–66% in older leaves and 18%–65% in stems (Fig. S4). Regardless of plant species, the relative efect of P concentrations ater P fertilization was relatively larger in stems and older leaves than that in new leaves (Fig. 2).
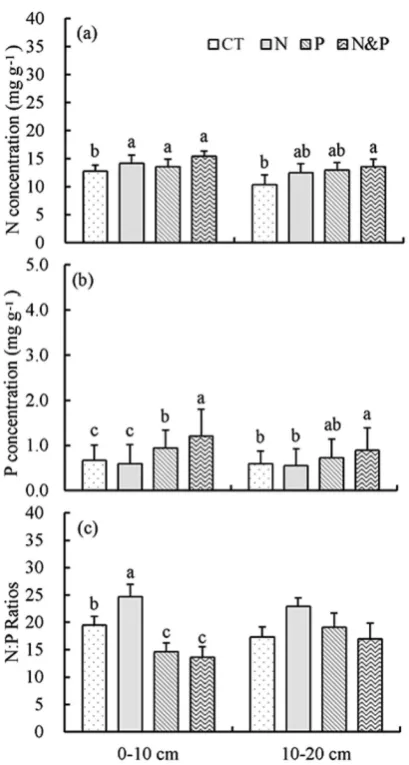
Nitrogen and P concentrations in mixed ine roots. Both N and P addition signiicantly increased the N concentrations of mixed ine roots (Table 2, P= 0.01 for both). In relative to CT, + N plots had 11% higher N concentrations in 0–10 cm layer and 21% higher in 10–20 cm layer, while + P plots had 6% higher N concentrations in 0–10 cm layer and 25% higher in 10–20 cm layer (Fig. 4). P addition greatly increased P concentrations of mixed ine roots relative to CT with the relative efect of P concentrations in + P plots ranging from 41% to 23% in 0–10 cm and 10–20 cm layer, respectively (Table 2, P< 0.001, Fig. 2). In mixed ine roots, + N plots had signiicantly higher N:P ratios than CT, while + P plots did not signiicantly changed N:P ratios (Fig. 4c).
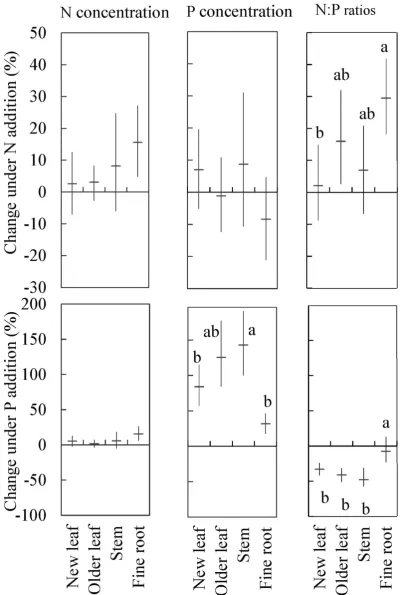
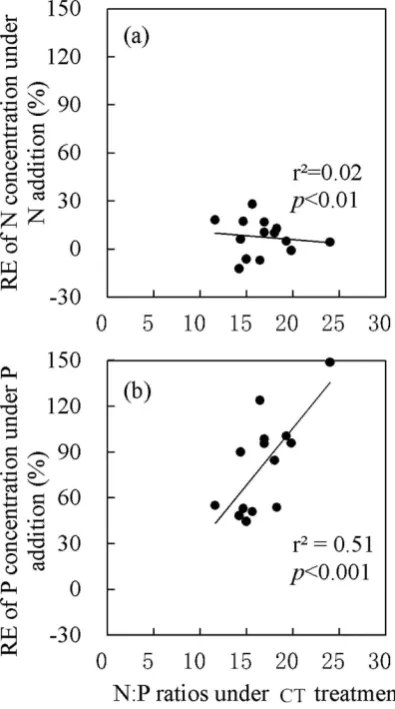
The relationship between relative efect of N or P concentrations and plant initial N:P
ratios. he connections between initial leaf N:P ratios in the seven species (N:P ratios in CT plots) and its relative efect of N or P concentrations under N or P addition were analyzed (Fig. 5). he relative efect of N concentrations under N addition showed a weak association with plant initial N:P ratios (Fig. 5a, r2= 0.02, P< 0.01), but the relative efect of P concentrations under P addition was strongly
associated with plant leaf N:P ratios (Fig. 5b, r2= 0.51, P< 0.001). However, we did not observe a similar
relationship in stems (Fig. S5).
Discussion
In this study, new and older leaf N:P ratios among the seven species in CT plots ranged from 15 to 21. If we accepted the concept that N:P ratios below 14 and above 16 indicated N- and P-limited biomass production, respectively32,33, plant growth would be more controlled by P- than N-limitation in this
for-est. hese results also agreed with our data from vegetation growth in the forfor-est. Speciically, from 2010 to 2013, the highest tree growth rate was with + P plots (52.48 t ha−1 year−1), followed by + NP plots,
+ N plots and CT34. Furthermore, N concentrations in aboveground tissues (new leaves, older leaves
and stems) did not exhibit any signiicant increases ater N fertilization. Conversely, P addition greatly increased P concentrations among all plant species and tissues. his supports the idea that N was not a limiting factor for plant growth because of the increased soil N availability caused by high atmospheric N deposition (40 Kg N ha−1 a−1 for the wet N deposition) in the studied forest34. Collectively, this evidence
supports our irst hypothesis that this forest is P limited, rather than N limited.
he efect of N addition on leaf and stem N concentrations in the seven species was inconsistent. In + N plots, we only observed a slight increase (5%–20%) in leaf N concentrations than that in CT in ive species. his result was consistent with some previous studies in tropical forests, which were usually P-limited20,35. From an over 15 yrs fertilization experiment in tropical forests, Mayor et al.20 reported a
9.6% increase of old leaf N concentrations under N addition plots. In this study, the atmosphere dep-osition data showed that regional wet N depdep-osition was nearly 40 Kg N ha−1 yr−1 in 2011 and 2012
(unpublished data), which was comparable to the data in many N deposition hotspots worldwide15,31,36.
he slight change of leaf N concentrations in + N plots was in line with the idea that tropical trees were
usually N suicient, and did not appreciably accumulate N following fertilization20.
Compared to CT, plant P concentrations in + N plots were not signiicantly altered by N addition across the seven species (Fig. 1). However, N addition greatly reduced P concentrations in + NP plots relative to + P plots in six species, suggesting a negative efect of N addition on plant P concentrations
under P addition (N × P interaction: P< 0.01, Table 2). Previous studies found that chronic high N
depo-sition might seriously intensify the P deiciency37,38. In a meta-analysis study, Yuan and Chen39 found that
N addition decreased leaf P concentrations in non-P-limiting temperate broad-leaf forest. One potential mechanism might be associated with the reduction of arbuscular mycorrorhizal fungi (AMF) abundance ater N and P co-addition. In forest soils, AMF performed an important role in plant nutrient and water uptake. Camenzind et al.40 observed a signiicant negative efect of N addition on AMF abundance, and
the combined treatment with P addition provoked an even stronger decrease (− 39%) in AMF richness in a tropical montane forest. In this experiment, although we did not investigate the alteration of AMF ater nutrient addition, there was a decrease of soil fungal biomass ater N addition41. It thus was highly
possible that the N and P co-addition leaded to a reduction of soil AMF abundance and richness, which further limited the P uptake to aboveground plant tissues in spite of high soil available P. his assump-tion was in accordance with the pattern of increased plant growth rates among diferent treatments (+ P
plots > + NP plots > + N plots > CT). Although the potential mechanism behind this result still needs
www.nature.com/scientificreports/
of anthropogenic N deposition in tropical forests, the positive efects of P addition on plant growth may be hampered due to the reduction of P uptake.
In herbaceous plants, leaf N:P ratios, especially in recently produced, fully expanded new leaf, is used as target indicators of nutrient availability and limitation to plants22. However, when this index is
applied to tree species, the nutrient allocation within plant tissues should be carefully considered. New leaf acquires limiting nutrients from other tissues for the maximization of growth, which has been proved by the relocation of N from shaded old leaves to new leaves in several studies42. Here, we hypothesized
that new leaves would therefore be less sensitive to changes in nutrient status than other plant tissues (i.e. older leaves, stems and ine roots). Our results showed that nutrient addition generally led to a larger variation of N, P concentrations and N:P ratios in older leaves and stems in comparison with these values in new leaves. Phosphorus additions increased P concentrations in new leaves by 84%, by 125% in older leaves, and by 143% in stems among the seven species for average. In response to the increase in plant P concentrations, the average N:P ratios in the seven species decreased in all plant tissues ater P fertili-zation with the order: stems (− 47%), older leaves (− 41%), new leaves (− 33%), and ine root (− 7%), as
www.nature.com/scientificreports/
suggested by Garrish et al.23 in a common garden experiment. Liu et al.21 also observed stronger efects
of N addition on N:P ratios in stems than in leaves in a tropical plant species (O. pinnata). Our results were consistent with the indings in Panama tropical forests22, and further provided evidence that the
survey of nutrient stoichiometry in new leaves of tree species might not provide powerful insight into plant response to altered nutrient status. he metrics of stems and older leaves were more responsive intra-speciic indicators of changed soil nutrient availability than those of new leaves.
Recently, Schreeg et al.22 discussed the inter-tissues variation of N:P stoichiometry within diferent
species, and suggested that stems were more responsive indicators of soil nutrient availability than new leaves. However, this study neglected the substantial inter-speciic diferences in stem nutrient concen-trations. Scaling stem N:P ratios from tissue-level to species-level need inter-speciic comparisons. In our study, the relative efect of leaf P concentrations under P addition was highly positively associated with leaf initial N:P ratios (Fig. 5b, r2= 0.51, P< 0.001). his inding agrees with the prediction that
species with higher N:P ratios are more P limited, and thus would have more pronounced response to P fertilization. However, no such relationship was observed in stems (Fig. S5). he result thus indicated that leaf N:P ratio was a more reined indicator in predicting the inter-speciic variation of tree species in response to altered soil nutrients. herefore, considering both inter-tissues and inter-speciic variations, we recommend that older leaves would be a better choice than new leaves or stems in the assessment of soil nutrient status and predicting plant response to altered nutrients using tissue nutrients ratios.
Fine roots, which have similar metabolic activities belowground as green leaves do aboveground, were expected to have a similar N to P stoichiometry response to nutrient availability. However, the N and P stoichiometry in ine roots was inconsistent with our predictions. In the study, the response of ine root N:P ratios to nutrient addition was more homeostatic and diferent from plant leaves and stems. In response to the increased N concentrations, the ine root N:P ratio was signiicantly increased in + N
plots. he fact that ine roots were more constrained by N when compared to leaves and stems makes sense, as ine roots are highly metabolically active and require substantial allocation of N to the syn-thesis of carrier enzymes that actively acquire nutrients from soil solution43. A previous study reported
that plant roots appeared to allocate excess N to construction of extracellular phosphatases to acquire P43. his increase in phosphatase production with N fertilization implies that even P-limited systems
might respond to N deposition with greater productivity, which had been conirmed by our plant growth data (+ N plots also had higher plant growth rate relative to control)34. Overall, these results reveal that
using ine root N to P stoichiometry as an indicator of soil nutrients status is an area in need of more examination.
Conclusions
In this secondary tropical forest, P addition increased aboveground plant P concentrations, and simul-taneously decreased N:P ratios, while N addition had no efect on N concentrations, indicating more intense limitation by P rather than N. We also observed that N addition greatly reduced the P concen-trations in + NP plots relative to + P plots in six species, suggesting a negative efect of N addition on the
plant P concentrations under P addition. his decline of plant tissue P concentrations might be due to a decrease of soil AMF abundance and richness ater N and P co-addition, as suggested by Camenzind et al.40 in a tropical montane forest. Moreover, we found that stems and older leaves had a more pronounced
response to P addition than new leaves, and the response of leaf P concentration to P addition was highly positively associated with initial leaf N:P ratios. he latter inding agreed with the prediction that species with higher N:P ratios would be more P-limited. Finally, this study suggested that the response of ine roots to nutrient fertilization difered from the leaves and stems, suggesting that the use of ine root N to P stoichiometry as an indicator of soil nutrient status needs to be approached with careful consideration.
Based on our indings, we showed that the response of plant nutrient stoichiometry to N and P ferti-lization varied with tissues and N and P interactions. Given projected increasing N deposition in tropical
www.nature.com/scientificreports/
forest regions, the positive efects of P addition on plant growth would be diminished due to the reduc-tion of P uptake. In sampling practices, under the considerareduc-tion of both inter-tissues and inter-speciic variation, we recommended that older leaves would be better index than new leaves, stems or ine roots when assessing soil nutrient status and predicting plant response to altered nutrients.
Methods
site description. his study was carried out at Xiaoliang Research Station for Tropical Coastal Ecosystem of Chinese Academy of Sciences (21 °27′ N, 110 °54′ E), southwest of Guangdong Province,
PR. China. his region is characterized by tropical monsoon climate with the mean annual temperature of 23 °C. Annual rainfall ranges from 1400 to 1700 mm with a variation of dry and wet seasons. he wet season is from April to October and the dry season from November to March. he soil is latosol devel-oped from granite34. he annually wet N deposition in this region was about 40 kg N ha−1 in 2011 and
2012 (Wang et al., unpublished data).
he study was conducted in a restored mixed evergreen broad-leaf forest. he forest started as
Eucalyptus exserta plantation in 1959, then 312 plant species were introduced between 1964 and 197544.
Later, the forest succeeded and naturally colonized species displaced almost all planted species by 1990’s. Now, the most common tree species are: Castanopsis issa, Cinnamomum camphora, Carallia brachiata, Aphanamixis polystachya, Ternstroemia pseudoverticillata, Acacia auriculaiformis, Cassia siamea, Albizia procera, Albizia odoratissima, Leucaena leucocephala, Aquilaria sinensis, Chakrasia tabularis, Syzygium levinei, Carallia brachiata, Schelera heptaphylla, Syzygium hancei, Psychotria rubra and Aporusa dioica.
he forest is considered as typical secondary evergreen tropical forest in regard to biodiversity and struc-ture complexity of the forest community34.
experimental design. An N and P addition experiment was designed as a completely randomized block design and established in the secondary tropical forest in September 200945. Each block was located
in a site more than 50 meters apart from each other in the forest. Within each block, four 10 × 10 m plots were established and each plot was surrounded by a 2 m wide bufer strip in each site. Four treat-ments, N addition (+ N), P addition (+ P), N addition with P addition (+ NP), and control treatment (CT, no addition of mineral nutrients) were assigned randomly to the four plots within each block. Each fertilization treatment had ive replicates. Both N and P addition were applied at 100 kg ha−1 yr−1.
Nitrogen was added as ammonium nitrate (NH4NO3) and phosphorus was added as sodium dihydrogen
phosphate (Na2HPO4). Briely, in every fertilization event, 476.6 g NH4NO3 (equal to 166.6 g N) and/or
808 g Na2HPO4 (equal to 166.6 g P) were dissolved in 30 L ground water and then applied to the
corre-sponding plots near soil surface uniformly using a backpack sprayer. Fertilization was conducted in every two months, 6 times in one year, since September 2009. hirty liters of ground water was also applied to control plots in each treatment event34,41. Since the annual precipitation of this region could be up to
1700 mm, the amount of added water in each plots only equals to 0.08% and 0.35% of rainfall inputs in wet and dry seasons in 2011.
soil sampling and analysis. Soil was sampled in September 2009 (before fertilization) and June 2012 (33th month ater fertilization). From each plot, soil cores (5 cm inner diameter) were taken at 0–10 cm
depth from 6 randomly selected locations and combined to one composite sample. he litter layer was removed before the soil core was collected. he sample was sieved by 2-mm mesh size ater removing the stones and roots by hand.
Soil moisture content was measured by oven-drying for 24 h at 105 °C. Soil pH was determined in 1:2.5 (w/v) soil solutions. Soil NH4+-N and NO3−-N in iltered 2 M KCl-extracts of fresh soil sample
were measured with a low injection auto-analyzer (FIA, Lachat Instruments, USA). Soil available P was extracted with Bray-2 solution and determined by the molybdate blue colorimetric method.
plant sample collection and measurements. Seven tree species were selected in this study, including Syzygium levinei, Syzygium hancei, Psychotria rubra, Carallia brachiata, Canthhium horridum,
Syzygium bullockii and Schelera octophylla, all of them were dungarunga or shrub (less than 6 meters height). Leaves sampling was based on the position, color and texture12 then distinguish new leaves and
older leaves (> 1 yr old). Plant new leaves (< 1 yr old), which were fully expanded, locating in the top position of branches or stems12, older leaves (the lower position, dark green) and stems were sampled in
September 2012. Mixed ine roots (< 2 mm) were also sampled directly using a 6 cm diameter stainless steel drill with 3 soil core mixture to determine the N and P concentrations in June 2012. All samples were dried for 72 hours at 70 °C in an oven and then inely ground prior to N and P analyses. Tissue N concentration was determined using the Kjeldahl method46. Tissue P concentration was measured
photometrically ater samples were digested with sulfuric acid (H2SO4). Mass tissue N:P ratios was used
in this study.
depth, N addition and P addition as the main factors. he LSD test was generally used to investigate the diference between each treatments in N, P concentrations or N:P ratios.
To assess the efects of nutrient addition on N or P concentrations and N:P ratios, the relative efect (RE) was quantiied by the ratios of the variable in the experimental group to the control group minus one, the statistical data was used in Figs 2 and 5, S2, S3, S4, and S5, one-way ANOVA was used to analyze the relative efect data among diferent tissues. We used the 95% conidence interval to describe relative efect of N, P concentrations and N:P ratios to nutrients addition among four tree tissues (Fig. 2). he correlations between the initial N:P in CT treatment and the relative of N or P concentrations were also analyzed (Fig. 5). All data were performed using the SPSS 16.0 for windows (SPSS Inc., Chicago, IL). he level of signiicance used in tests was P< 0.05.
References
1. Allen, A. S. & Schlesinger, W. H. Nutrient limitations to soil microbial biomass and activity in loblolly pine forests. Soil Biol Biochem36, 581–589 (2004).
2. Vitousek, P. M., Porder, S. & Benjamin, H. Terrestrial phosphorus limitation: mechanisms implication and nitrogen-phosphorus inrtercations. Ecol Appl20, 5–15 (2010).
3. Perring, M. P., Hedin, L. O., Levin, S. A., McGroddy, M. & de Mazancourt, C. Increased plant growth from nitrogen addition should conserve phosphorus in terrestrial ecosystems. Proc Natl Acad Sci USA105, 1971–6 (2008).
4. Yu, S. et al. Surface runof phosphorus (P) loss in relation to phosphatase activity and soil P fractions in Florida sandy soils under citrus production. Soil Biol Biochem38, 619–628 (2006).
5. Miller, A. J., Schuur, E. A. G. & Chadwick, O. A. Redox control of phosphorus pools in Hawaiian montane forest soils. Geoderma 102, 219–237 (2001).
6. Walker, T. & Syers, J. he fate of phosphorus during pedogenesis. Geoderma15, 1–19 (1976).
7. Vitousek, P. M. & Farrington, H. Nutrient limitation and soil development: Experimental test of a biogeochemical theory.
Biogeochemistry37, 63–75 (1997).
8. Cleveland, C. C. et al. Relationships among net primary productivity, nutrients and climate in tropical rain forest: a pan‐tropical analysis. Ecol Lett14, 939–947 (2011).
9. LeBauer, D. S. & Treseder, K. K. Nitrogen limitation of net primary productivity in terrestrial ecosystems is globally distributed.
Ecology89, 371–379 (2008).
10. Craine, J. M., Morrow, C. & Stock, W. D. Nutrient concentration ratios and co-limitation in South African grasslands. New phytol 179, 829–36 (2008).
11. Gleeson, S. K. & Tilman, D. Plant Allocation and the Multiple Limitation Hypothesis. Am Nat139, 1322–1343 (1992). 12. Santiago, L. S. et al. Tropical tree seedling growth responses to nitrogen, phosphorus and potassium addition. J Ecol100, 309–316
(2012).
13. Townsend, A. R., Cleveland, C. C., Houlton, B. Z., Alden, C. B. & White, J. W. C. Multi-element regulation of the tropical forest carbon cycle. Front Ecol Environ9, 9–17 (2011).
14. Wang, X. et al. Impacts of understory species removal and/or addition on soil respiration in a mixed forest plantation with native species in southern China. Forest Ecol Manage261, 1053–1060 (2011).
15. Liu, X., Duan, L. & Mo, J. Nitrogen deposition and its ecological impact in China: an overview. Environ Pollut159, 2251–2264 (2011).
16. Alvarez-Clare, S., Mack, M. C. & Brooks, M. A direct test of nitrogen and phosphorus limitation to net primary productivity in a lowland tropical wet forest. Ecology94, 1540–1551 (2013).
17. Denslow, J. S., Vitousek, P. M. & Schultz, J. C. Bioassays of Nutrient Limitation in a Tropical Rain-Forest Soil. Oecologia74,
370–376 (1987).
18. Ceccon, E., Sanchez, S. & Campo, J. Tree seeding dynamics in two abandoned tropical dry forestsof difering successional status in Yucatan, Mexico: a ield experiment with N and P fertilization. Plant Ecology170, 277–285 (2004).
19. Vitousek, P. M., Turner, D. R. & Kitayama, K. Foliar Nutrients during Long-Term Soil Development in Hawaiian Montane Rain-Forest. Ecology76, 712–720 (1995).
20. Mayor, J. R., Wright, S. J., Turner, B. L. & Austin, A. Species-speciic responses of foliar nutrients to long-term nitrogen and phosphorus additions in a lowland tropical forest. J Ecol102, 36–44 (2014).
21. Liu, J. et al. Nitrogen to phosphorus ratios of tree species in response to elevated carbon dioxide and nitrogen addition in subtropical forests. Global Change Biol19, 208–16 (2013).
22. Schreeg, L. A., Santiago, L. S., Wright, S. J. & Turner, B. L. Stem, root, and older leaf N:P ratios are more responsive indicators of soil nutrient availability than new foliage. Ecology95, 2062–2068 (2014).
23. Garrish, V., Cernusak, L. A., Winter, K. & Turner, B. L. Nitrogen to phosphorus ratio of plant biomass versus soil solution in a tropical pioneer tree, Ficus insipida. J Exp Bot61, 3735–48 (2010).
24. Cernusak, L. A., Winter, K. & Turner, B. L. Leaf nitrogen to phosphorus ratios of tropical trees: experimental assessment of physiological and environmental controls. New phytol185, 770–9 (2010).
25. Dyckmans, J. & Flessa, H. Inluence of tree internal N status on uptake and translocation of C and N in beech: a dual 13C and 15N labeling approch. Tree Physiol21, 395–401 (2001).
26. Mirmanto, E., Proctor, J., Green, J., Nagy, L. & Suriantata. Efects of nitrogen and phosphorus fertilization in a lowland evergreen rainforest. Philos T Roy Soc B354, 1825–1829 (1999).
27. FAO. Global Forest Resources Assessment 2000, (FAO Forestry Paper, Rome, 2001).
28. Corlett, R. T. & Primack, R. B. Tropical rainforests and the need for cross-continental comparisons. TREE21, 104–10 (2006). 29. LaFrankie, J. Lowland Tropical Rain Forests of Asia and America: Parallels, Convergence, and Divergence. in Pollination Ecology
and the Rain Forest. Vol. 174 (eds Roubik, D., Sakai, S. & Hamid Karim, A. A.) 178–190 (Springer, New York, 2005).
30. Wang, F., Zhu, W., Xia, H., Fu, S. & Li, Z. Nitrogen Mineralization and Leaching in the Early Stages of a Subtropical Reforestation in Southern China. Resto Ecol18, 313–322 (2010).
31. Fang, Y. et al. Nitrogen deposition and forest nitrogen cycling along an urban-rural transect in southern China. Global Change Biol17, 872–885 (2011).
32. Verheven, J. T. A., Koerselman, W. & Meuleman, A. F. M. Nitrogen- or phosphorus-limited growth in herbaceous, wet vegetation: relations with atmospheric inputs and management regimes. TREE11, 494–498 (1996).
33. Gusewell, S., Koerselman, W. & Verhoeven, J. T. A. Biomass N : P ratios as indicators of nutrient limitation for plant populations in wetlands. Ecol Appl13, 372–384 (2003).
34. Wang, F. et al. Nitrogen and phosphorus addition impact soil N2O emission in a secondary tropical forest of South China. Sci
www.nature.com/scientificreports/
35. Ostertag, R. Foliar nitrogen and phosphorus accumulation responses ater fertilization: an example from nutrient-limited Hawaiian forests. Plant Soil334, 85–98 (2010).
36. Fang, Y., Gundersen, P., Mo, J. & Zhu, W. Nitrogen leaching in response to increased nitrogen inputs in subtropical monsoon forests in southern China. Forest Ecol Manage257, 332–342 (2009).
37. Reich, P. B., Knops, J. M. H., Tilman, D. & Craine, J. M. Plant diversity enhances ecosystem responses to elevated CO2 and nitrogen deposition. Nature410, 809–812 (2001).
38. Phoenix, G. K. et al. Efects of enhanced nitrogen deposition and phosphorus limitation on nitrogen budgets of semi-natural grasslands. Global Change Biol9, 1309–1321 (2003).
39. Yuan, Z. Y. & Chen, H. Y. H. Negative efects of fertilization on plant nutrient resorption. Ecology96, 373–380 (2015). 40. Camenzind, T. et al. Nitrogen and phosphorus additions impact arbuscular mycorrhizal abundance and molecular diversity in a
tropical montane forest. Global Change Biol20, 3646–59 (2014).
41. Li, J. et al. Efects of nitrogen and phosphorus addition on soil microbial community in a secondary tropical forest of China. Biol Fert Soil51, 207–215 (2015).
42. Field, C. Allocating Leaf Nitrogen for the Maximization of Carbon Gain - Leaf Age as a Control on the Allocation Program.
Oecologia56, 341–347 (1983).
43. Treseder, K. K. & Vitousek, P. M. Efects of soil nutrient availability on investment in acquisition of N and P in Hawaiian rain forests. Ecology82, 946–954 (2001).
44. Ren, H. et al. Changes in biodiversity and ecosystem function during the restoration of a tropical forest in south China. Sci China C Life Sci50, 277–84 (2007).
45. Zhao, J. et al. Efects of experimental nitrogen and/or phosphorus additions on soil nematode communities in a secondary tropical forest. Soil Biol Biochem75, 1–10 (2014).
46. Bremner, J. M. & Mulvaney, C. S. Nitrogen-total. in Methods of Soil Analysis, Part 2: Chemical and Microbial Properties (eds. Page, A. L., Miller, R. H. & Keeney, D. R.) 595–624 (Agronomy Society of American, Madison, Wisconsin, 1982).
Acknowledgements
his work was funded by Natural Science Foundation of China (31300419), NSFC-Guangdong Joint Project (U1131001), National Basic Research Program of China (2011CB403200), Innovation Foundation of Guangdong Forestry (2012KJCX013-02, 2014KJCX021-03) and the “Strategic Priority Research Program” of the Chinese Academy of Sciences (XDA05070307). We appreciate Dr. Mary Heskel (Marine Biological Lab, Woods Hole, MA, USA) for her valuable work to polish this paper.
Author Contributions
F.M.W. designed the experiment. Q.F.M., F.M.W., B.Z., Y.C. and Y.W.L. carried out the experiment and performed the analyses. Q.F.M., F.M.W., W.X.Z., R.M., J.W., X.K.L, J.W.T., Y.Z.D., Z.A.L. and X.B.L. substantially contributed to interpreting the results and writing the paper.
Additional Information
Supplementary information accompanies this paper at http://www.nature.com/srep
Competing inancial interests: he authors declare no competing inancial interests.
How to cite this article: Mo, Q. et al. Response of plant nutrient stoichiometry to fertilization varied with plant tissues in a tropical forest. Sci. Rep.5, 14605; doi: 10.1038/srep14605 (2015).