1 23
Biology and Fertility of Soils
Cooperating Journal of International
Society of Soil Science
ISSN 0178-2762
Biol Fertil Soils
DOI 10.1007/s00374-014-0964-1
Effects of nitrogen and phosphorus
addition on soil microbial community in a
secondary tropical forest of China
1 23
ORIGINAL PAPER
Effects of nitrogen and phosphorus addition on soil microbial
community in a secondary tropical forest of China
Jian Li&Zhian Li&Faming Wang&Bi Zou&Yao Chen&
Jie Zhao&Qifeng Mo&Yingwen Li&Xiaobo Li&
Hanping Xia
Received: 23 April 2014 / Revised: 17 September 2014 / Accepted: 23 September 2014
#Springer-Verlag Berlin Heidelberg 2014
Abstract Nutrient availability greatly regulates soil microbial processes and functions in tropical forests. However, few studies have explored the impacts of nitrogen (N) addition (100 kg P ha−1 year−1), phosphorus (P) addition
(100 kg N ha−1year−1), and N×P interaction on soil microbial
biomass and microbial community composition in tropical forests. We established a field nutrient manipulation experi-ment in a secondary tropical forest of South China. Soil physicochemical properties and microbial community com-position were measured. Analysis of phospholipid fatty acids (PLFAs) was used to determine soil microbial biomass and composition, and both were related to environmental factors by the redundancy analysis (RDA) and principal response curves (PRC). We demonstrated that N addition usually did not affect microbial biomass, which was increased by P addi-tion over 3 years of fertilizaaddi-tion. Nitrogen addiaddi-tion decreased soil bacterial biomass but did not affect soil fungal biomass after 3 years of fertilization. After P addition, soil fungal biomass increased faster than soil bacterial biomass, indicat-ing a more sensitive response of soil fungi to P addition than bacteria. Phosphorus addition increased fungi/bacteria ratio (F/B) ratios after 3 years of fertilization. Both N and P
additions had different effects on soil microbial community in this tropical forest and, thus, probably altered ecosystem functioning.
Keywords Nutrients . Fertilization . Biomass . Soil microbial community . Tropical forest
Introduction
Nitrogen (N) and phosphorus (P) play an important role in plant growth since they are essential nutrients for plants (Elser et al.2007). It is generally believed that in temperate and high latitude ecosystems, N frequently limits plant growth and organic matter storage (Vitousek and Howarth 1991). However, most tropical forests occur on highly weathered soils, where much of the original P-rich parent material has been lost, and most of the remaining P is occluded on iron and aluminum oxides (Miller et al.2001). Therefore, it is generally believed that plant growth is limited by P in tropical forests (Walker and Syers 1976; Vitousek 1984; Vitousek and Farrington 1997; Cleveland et al. 2011). However, a meta-analysis study suggested that N limitation was equally strong for temperate and tropical forests (LeBauer and Treseder
2008). Recent studies also have demonstrated that both N and P limit tropical forest plant growth (Wright et al.2011). These conflicting results reflect an uncertainty in the nutrient limitation of tropical forest.
Soil microbial community plays a key role in terrestrial ecosystem by carrying out almost all soil biochemical pro-cesses (Kennedy1999; Artursson et al.2006). They mineral-ize organic matters to simple inorganic compounds and recy-cle growth-limiting nutrients for autotrophs (Griffiths et al.
2012). These processes are essential for soil fertility and plant growth. Soil microbe therefore acts as both a sink and a source of available nutrients. The availability of essential soil
J. Li
:
Z. Li:
F. Wang (*):
B. Zou:
Y. Chen:
Q. Mo:
Y. Li:
X. Li
:
H. XiaKey Laboratory of Vegetation Restoration and Management of Degraded Ecosystems, South China Botanical Garden, Chinese Academy of Sciences, 510650 Guangzhou, People’s Republic of China
e-mail: [email protected] J. Li
:
Y. Chen:
Q. MoUniversity of Chinese Academy of Sciences, 10000 Beijing, People’s Republic of China
J. Zhao
Key Laboratory of Agro-ecological Processes in Subtropical Region, Institute of Subtropical Agriculture, Chinese Academy of Sciences, 410125 Changsha, People’s Republic of China
Biol Fertil Soils
nutrients (e.g., N and P) could influence the activities, bio-mass, and compositions of soil microbial communities (Treseder and Allen2002; He et al.2008). Furthermore, recent researches have shown that anthropogenic N deposition is increasing dramatically in tropical regions (Hietz et al.2011) and P deposition may already play an important role as a source of P in tropical regions (Sayer et al. 2012). Understanding the effect of N and P addition on soil microbial activities can thus improve our capacity to predict how the soil microbial community will respond to environmental change in tropical forest ecosystems.
The effect of N fertilization or deposition on soil microbial biomass and community composition has been well studied (Waldrop et al. 2004; Gallo et al. 2004; Frey et al. 2004; Chung et al.2007). Treseder (2008) analyzed 82 field exper-iment data and concluded that negative effects of N addition on soil microbial biomass were widespread in terrestrial ecosystems. However, the effects of N addition or deposition on microbial diversity were inconsistent among various studies. For example, Balser (2001) reported that alteration of microbial community composition by N addition varied in three Hawaiian tropical forest soils. Gallo et al. (2004) also found that the response of functions and structure of microbial decomposer communities to N amendment changed with forest types. DeForest et al. (2004) reported that N addition decreased microbial biomass without any evidence that N addition altered microbial community composition. These inconsistent results indicated that the response of soil micro-bial communities to N fertilization is highly variable among different environments.
Compared with studies on N addition, only a few studies focused on the effects of P addition on soil microbial biomass and microbial community, and most of these studies were conducted in agriculture ecosystems (Beauregard et al.2010; Shi et al.2013; Tan et al.2013). In an agriculture soil, Shi et al. (2012) reported no significant changes on soil microbial bio-mass by 17 years of P fertilization. Bünemann et al. (2004) also observed no significant difference in microbial, bacterial, and fungal biomass under maize-crotalaria fallow rotation with or without P fertilization. The response of soil microbial biomass and community composition to P fertilization in tropical forests is poorly documented and cannot get a consis-tent conclusion (Wang et al.2008; Liu et al.2012). Recent work indicates that P addition in tropical forest can increase soil microbial biomass and alter the composition of soil mi-crobial community (Liu et al.2012), but this effect has been transient and disappearing over 4 years of fertilization (Liu et al.2013). It remains unclear if these changes are consistent across various forests in tropical areas.
Although previous studies have studied well the response of soil microbial community to N addition, only few studies have explored impacts of N addition, P addition, and N×P interaction on soil microbial biomass and community
composition in tropical forests. In this study, we designed a long-term (>3 years) N and P addition experiment in a sec-ondary tropical forest, which is facing high atmospheric N deposition (over 40 kg N ha−1year−1), to test the following
two hypotheses: (1) N fertilization would have negative ef-fects on microbial biomass and composition of soil microbial community; and (2) P fertilization would have positive effects on the two microbial variables.
Materials and methods
Site description
This study was carried out at the Xiaoliang Tropical Coastal Ecosystem Research Station of the Chinese Academy of Sciences (CAS) (21°27′ N, 110° 54′ E), southwest of Guangdong Province, China. This region is characterized by tropical monsoon climate with a mean annual temperature of 23 °C. Annual rainfall ranges from 1400 to 1700 mm with a variation of dry and wet seasons. The wet season is from April to October and the dry season from November to March. The soil is latosol developed from granite (Yu and Pi1985).
The study was conducted in a restored mixed forest. The forest started as Eucalyptus exsertaplantation in 1959, and then 312 plant species were introduced between 1964 and 1975 (Ding et al. 1992; Ren et al. 2007). Later, the forest succeeded and naturally colonized species displaced almost all planted species by the 1990s. Now, the most common tree species are as follows: Castanopsis fissa, Cinnamomum camphora, Carallia brachiata, Aphanamixis polystachya, Ternstroemia pseudoverticillata, Acacia auriculaiformis, Cassia siamea, Albizia procera, Albizia odoratissima, Leucaena leucocephala, Aquilaria sinensis, Chakrasia tabularis, Syzygium levinei, Schefflera heptaphylla, Syzygium hancei, Psychotria rubra, and Aporusa dioica. The forest is considered as typical tropical secondary forest in regard to biodiversity and structure complexity of the forest community.
Experimental design
An N and P addition experiment was designed as a random-ized complete block (n=5) and established in the secondary tropical forest in September 2009. Each block was located in a site more than 50 m apart in the forest. Within each block, four 10×10 m plots were established and each plot was surrounded by a 2 m wide buffer strip in each site. Four treatments, N addition (+N), P addition (+P), N addition with P addition (+ NP), and control (CK) with no addition of mineral nutrients, were carried out randomly with four plots within each block. Both N and P were applied at 100 kg ha−1year−1. Briefly,
476.6 g NH4NO3(equal to 166.6 g N) and/or 808 g Na2HPO4
Biol Fertil Soils
(equal to 166.6 g P) was dissolved in 30 L of groundwater and, then, applied to the corresponding plots near the soil surface using a backpack sprayer in each 2 months from September 2009, respectively. Thirty liters of ground water was applied to control plots in each treatment event.
Soil sampling and analysis
Soil was sampled in September 2009 (before fertilization), September 2010 (12th month), March 2011 (18th month), September 2011 (24th month), and December 2012 (39th month), respectively. The general properties of soil in September 2009 are shown in Table1. From each plot, soil cores (5 cm inner diameter) were taken at 0–10 cm depth from six randomly selected locations and combined to one com-posite sample. The litter layer was removed before the soil core was collected. The sample was sieved by 2 mm mesh size after removing the stones and roots by hand.
Soil moisture content was measured by oven-drying for 24 h at 105 °C. Soil pH was determined in 1:2.5 (w/v) soil solutions. Soil organic C (SOC) was measured with the Walkley-Black method (Liu et al.1996). Total N (TN) and total P (TP) were measured after micro-Kjeldahl digestion using a flow injection autoanalyzer (FIA, Lachat Instruments, USA). Dissolved or-ganic C (DOC) and dissolved oror-ganic N (DON) in filtered 0.5 M K2SO4extracts of fresh soil sample were measured with a TOC analyzer (TOC-VCPH Shimadzu Corp., Japan). NH4+ -N and -NO3−-N in filtered 2 M KCl extracts of fresh soil sample were measured with the flow injection autoanalyzer (FIA, Lachat Instruments, USA).
Soil phospholipid fatty acids (PLFAs) were analyzed using the method described by Bossio and Scow (1998) for deter-mining soil microbial community structure and relative mi-crobial biomasses and a gas chromatograph (GC7890, Agilent, USA) was used. The abundance of individual fatty acids was determined as nanomoles per grams of dry soil, and standard nomenclature was used (Tunlid et al. 1989). Concentrations of each PLFA were calculated based on the 19:0 internal standard concentrations and were regarded as an indication of microbial biomass. The PLFAs used as fungal biomarkers were 18:2ω6, 9c (Frostegård et al. 1993). The
PLFAs of i14:0, i15:0, a15:0, i16:0, a17:0, and i17:0 were used as indicators of gram-positive bacteria and 16:1ω7c,
cy17:0, 18:1ω7, and cy19:0 were used as indicators of
gram-negative bacteria (Zelles 1999). The sum of gram-positive bacteria, gram-negative bacteria, and 15:0 and 17:0 were considered to represent bacterial biomass. The total PLFAs of soil microbial community were calculated as the sum of 14:0, 16:0, 16:1 2OH, 16:1ω5c, 16:1ω9c, 17:1ω8c,
18:1ω9c, 18:3ω6c, fungi, and bacteria. The ratio of fungal
PLFAs (18:2ω6, 9c) to total bacterial PLFAs was used to
estimate the ratio of fungal to bacterial biomass (F/B) in soils (Bardgett et al.1996; Frostegård and Bååth1996).
Data analysis
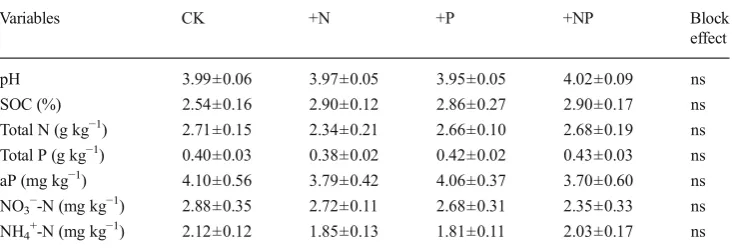
Since no significant block effect was found by one-way anal-ysis of variance (ANOVA) in the initial sampling (Table1), Table 1 Soil physical and
chem-ical characteristics of the tropchem-ical forest before the start of fertiliza-tion in 2009
Data are expressed as means±SE (n=5). Values are not significant atP<0.05
aPavailable P,nsnot significant
Variables CK +N +P +NP Block effect pH 3.99±0.06 3.97±0.05 3.95±0.05 4.02±0.09 ns SOC (%) 2.54±0.16 2.90±0.12 2.86±0.27 2.90±0.17 ns Total N (g kg−1) 2.71±0.15 2.34±0.21 2.66±0.10 2.68±0.19 ns
Total P (g kg−1) 0.40±0.03 0.38±0.02 0.42±0.02 0.43±0.03 ns
aP (mg kg−1) 4.10±0.56 3.79±0.42 4.06±0.37 3.70±0.60 ns
NO3−-N (mg kg−1) 2.88±0.35 2.72±0.11 2.68±0.31 2.35±0.33 ns
NH4+-N (mg kg−1) 2.12±0.12 1.85±0.13 1.81±0.11 2.03±0.17 ns
Table 2 The Pand Fvalues of RM-ANOVA for soil variables and microbial PLFA biomass in the secondary tropical forest after N and P addition
Variables N P N×P
F P F P F P
SWC 0.55 0.47 3.60 0.076 0.55 0.47 pH 0.184 0.674 1.833 0.195 0.146 0.708 aP 0.004 0.947 24.996 <0.001 0.137 0.716 NO3−-N 60.775 <0.001 11.181 0.004 0.819 0.379
NH4+-N 12.927 0.002 0.001 0.996 0.019 0.891
DOC 0.769 0.393 1.992 0.177 0.585 0.455 DON 10.665 0.005 3.105 0.097 1.068 0.317 Fungi 0.465 0.506 22.830 <0.001 0.263 0.616 G− 2.000 0.178 10.230 0.006 0.002 0.968
G+ 0.898 0.358 3.980 0.064 0.611 0.447 Bacteria 1.922 0.186 5.674 0.031 0.615 0.445 Total PLFAs 1.890 0.189 7.420 0.016 0.633 0.439 F/B 0.879 0.363 1.480 0.243 0.614 0.446
SWCsoil water content,aPavailable P,DOCdissolved organic C,DON
dissolved organic N,G−gram-negative bacteria,G+gram-positive
data of soil general properties and microbial characteristics were analyzed by repeated-measures two-way ANOVA with N and P addition as main factors. Statistical significance was determined atP<0.05. All statistical analyses used SPSS 18.0 software (SPSS Inc., Chicago, IL). Least significant difference (LSD) was used to test differences among treatments. Tamhane’s T2 was used to test differences among treatments when homogeneity of variances test data was not equal. Redundancy analysis (RDA) was used to determine which environmental factors were related to the composition of soil microbial communities represented by relative abundance of each PLFAs. The principal response curves (PRC) method was used to determine the temporal trends of soil microbial community composition for each treatment using CANOCO 4.5 (Ithaca, NY, USA). PRC is based on RDA. Both environ-mental class variables (treatments) and covariables (sampling times) were coded as nominal 0 or 1 variables (Lepš and Šmilauer2003). Monte Carlo permutation tests were applied to compute statistical significance (n=499). The result is a diagram showing the first principal component of the variance explained by treatment on the y-axis along the sampling periods on thex-axis. The control treatment is treated as a
zero baseline (the horizontal dashed line). The treatment effect is represented by the deviation of each fluctuating line (i.e., N, P, and NP) from the zero baseline through time.
Results
Soil available nutrients
Over the 3 years of observation, soil inorganic N concentra-tions were generally increased by N addition (Tables2and3), and soil available P was increased by P addition (Tables2and
3). Nitrogen addition also significantly increased soil DON (P=0.005, Table2), but had no effect on soil pH (P=0.674). After P addition, a decrease of soil NO3−(P=0.004, Table2) and DON (P=0.097, Table2) contents was observed.
Soil microbial community structure
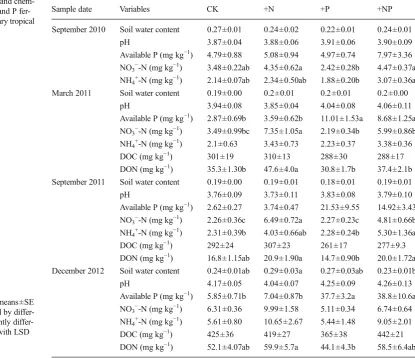
In the repeated-measures ANOVA, N addition did not signif-icantly affect soil microbial variables, while P addition Table 3 Soil physical and
chem-ical properties after N and P fer-tilization in the secondary tropical forest of China
Data are expressed as means±SE (n=5). Values followed by ent letters are significantly differ-ent among treatmdiffer-ents with LSD test (P<0.05)
aPavailable P
Sample date Variables CK +N +P +NP September 2010 Soil water content 0.27±0.01 0.24±0.02 0.22±0.01 0.24±0.01
pH 3.87±0.04 3.88±0.06 3.91±0.06 3.90±0.09 Available P (mg kg−1) 4.79±0.88 5.08±0.94 4.97±0.74 7.97±3.36
NO3−-N (mg kg−1) 3.48±0.22ab 4.35±0.62a 2.42±0.28b 4.47±0.37a
NH4+-N (mg kg−1) 2.14±0.07ab 2.34±0.50ab 1.88±0.20b 3.07±0.36a
March 2011 Soil water content 0.19±0.00 0.2±0.01 0.2±0.01 0.2±0.00 pH 3.94±0.08 3.85±0.04 4.04±0.08 4.06±0.11 Available P (mg kg−1) 2.87±0.69b 3.59±0.62b 11.01±1.53a 8.68±1.25a
NO3−-N (mg kg−1) 3.49±0.99bc 7.35±1.05a 2.19±0.34b 5.99±0.86b
NH4+-N (mg kg−1) 2.1±0.63 3.43±0.73 2.23±0.37 3.38±0.36
DOC (mg kg−1) 301±19 310±13 288±30 288±17
DON (mg kg−1) 35.3±1.30b 47.6±4.0a 30.8±1.7b 37.4±2.1b
September 2011 Soil water content 0.19±0.00 0.19±0.01 0.18±0.01 0.19±0.01 pH 3.76±0.09 3.73±0.11 3.83±0.08 3.79±0.10 Available P (mg kg−1) 2.62±0.27 3.74±0.47 21.53±9.55 14.92±3.43
NO3−-N (mg kg−1) 2.26±0.36c 6.49±0.72a 2.27±0.23c 4.81±0.66b
NH4+-N (mg kg−1) 2.31±0.39b 4.03±0.66ab 2.28±0.24b 5.30±1.36a
DOC (mg kg−1) 292±24 307±23 261±17 277±9.3
DON (mg kg−1) 16.8±1.15ab 20.9±1.90a 14.7±0.90b 20.0±1.72a
December 2012 Soil water content 0.24±0.01ab 0.29±0.03a 0.27±0.03ab 0.23±0.01b pH 4.17±0.05 4.04±0.07 4.25±0.09 4.26±0.13 Available P (mg kg−1) 5.85±0.71b 7.04±0.87b 37.7±3.2a 38.8±10.6a
NO3−-N (mg kg−1) 6.31±0.36 9.99±1.58 5.11±0.34 6.74±0.64
NH4+-N (mg kg−1) 5.61±0.80 10.65±2.67 5.44±1.48 9.05±2.01
DOC (mg kg−1) 425±36 419±27 365±38 442±21
DON (mg kg−1) 52.1±4.07ab 59.9±5.7a 44.1±4.3b 58.5±6.4ab
Biol Fertil Soils
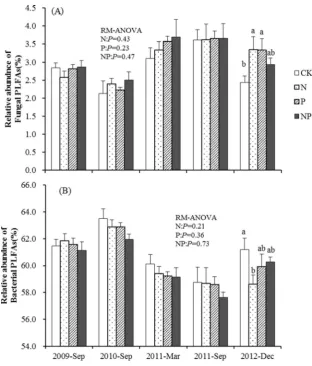
significantly increased nearly all soil PLFA groups with the exception of G+ PLFAs and F/B ratios (Tables2and4). The mean fungal, bacterial, and total biomasses were gradually increased by P addition since March 2011 (18 months) and reached the peak in December 2012 (39 months). No signif-icant effect of N addition was observed over the 3 years of fertilization, and the total, fungal, and bacterial biomasses in the N treatment were the lowest among the four treatments in December 2012 (Table4). Neither N nor P addition affect soil F/B ratio values significantly in the repeated-measures (RM)-ANOVA analysis. However, there was significantly higher F/B ratio under fertilized plots (N, P, and NP treatments) compared to CK in December 2012 (Table4,P<0.05). The relative abundances of soil fungi PLFAs were higher in N and P treatments compared to CK in December 2012 (Fig. 1), while the bacteria PLFAs showed the opposite pattern.
Redundancy analysis showed that the relative abundance of soil fungal PLFAs was positively related with available P in December 2012. All the environmental data explained 29.8 % of the variance, with axis 1 explaining 18.6 % of the variance and axis 2 explaining another 11.2 % (Fig. 2). The PRC analysis showed that the temporal dynamics of soil microbial community composition within P and NP plots were similar
(Fig.3), and the divergence of microbial composition within N addition and P addition plots was getting larger along with fertilization duration. Furthermore, the PRC also showed that the response of composition of soil microbial community to the NP treatment usually lay between N addition and P addi-tion treatments, indicating a low-level interacaddi-tion of N and P addition. Additionally, the species weight data plus PRC curve showed that soil microbe generally had a positive relationship with P addition, while there was no clear relationship with N addition (Fig.3).
Discussion
Effect of N addition
Nitrogen addition generally decreased soil microbial biomass in both field and lab-based studies (Treseder 2008). In this 3 year study, N addition did not significantly affect microbial biomass. However, we observed a reduction of soil bacterial biomass after 3 years of N addition (Table 4), and the G+ bacterial biomass was the most negatively affected by N Table 4 Soil microbial PLFA
biomass after fertilization in the secondary tropical forest
Values are means±SE (n=5). Values followed by different let-ters are significantly different among treatments with LSD test (P<0.05)
G−gram-negative bacteria, G+
gram-positive bacteria,F/B fun-gi/bacteria ratio
Sample date Microbial PLFA biomass
(nmol g−1dry soil)
CK +N +P +NP
September 2010 Fungi 0.21±0.05 0.22±0.03 0.20±0.01 0.24±0.02 G− 1.98±0.18 1.84±0.14 1.86±0.10 1.86±0.15
G+ 3.73±0.17 3.53±0.26 3.57±0.15 3.79±0.15 Bacteria 6.00±0.35 5.65±0.41 5.68±0.25 5.95±0.30 Total 9.46±0.61 9.00±0.68 9.03±0.36 9.59±0.46 F/B 0.034±0.007 0.038±0.004 0.036±0.002 0.040±0.003 March 2011 Fungi 0.32±0.07b 0.39±0.04ab 0.57±0.09a 0.49±0.05a
G− 2.15±0.40 2.53±0.39 3.37±0.49 2.84±0.43
G+ 3.93±0.88 4.39±0.69 5.49±0.83 5.07±0.86 Bacteria 6.36±1.30 7.26±1.13 9.28±1.30 8.28±1.33 Total 10.54±2.09 12.15±1.80 15.65±2.16 13.91±2.13 F/B 0.054±0.005 0.058±0.004 0.060±0.003 0.062±0.010 September 2011 Fungi 0.36±0.05 0.37±0.05 0.45±0.03 0.50±0.13
G− 1.85±0.32 1.93±0.40 2.40±0.11 2.42±0.56
G+ 4.08±0.87 4.17±0.92 4.48±0.10 4.97±1.21 Bacteria 6.22±1.25 6.40±1.36 7.18±0.22 7.77±1.84 Total 10.52±1.98 10.75±2.06 12.26±0.43 13.43±3.13 F/B 0.062±0.006 0.060±0.008 0.062±0.004 0.064±0.006 December 2012 Fungi 0.43±0.03b 0.43±0.05b 0.69±0.08a 0.55±0.04ab
G− 4.05±0.20 2.96±0.48 4.72±0.29 4.31±0.56
addition. Ramirez et al. (2012) also found that some soil bacterial groups were consistently decreased by 1 year N addition in 28 soils in North America, and N addition could decrease soil microbial activities by altering the metabolic capabilities of soil bacterial communities. Contrary to our first hypothesis, N addition did not significantly affect soil total fungal biomass in this study, indicating a resistance of fungi to N addition. Some other investigators have found similar results. Nilsson et al. (2007) reported that N input had no effect on total fungal biomass in oak forest soils along a natural N deposition gradient. Liu et al. (2013) also reported no changes in fungal PLFAs after 4 years of N addition in an old growth tropical forest of South China. Nitrogen addition also did not affect soil F/B ratio in the 3 year experiment except a significant increase in the F/B ratio in N plots com-pared to control in December 2012, due to the decrease in bacterial PLFAs (Fig.1). Also, Liu et al. (2012) observed that F/B ratios were significantly increased by 4 years of N addi-tion to a tropical old growth forest.
The N-induced alteration in microbial community compo-sition may be directly associated with increased soil N avail-ability. According to the enzyme inhibition hypothesis, N
addition can inhibit those enzymes involved in soil recalcitrant C decomposition, and this can reduce microbial activities (Gallo et al. 2004). Similarly, the copiotrophic hypothesis suggested that N additions reduced the relative abundance of oligotrophic taxa as the relieved N limitation allows them to be outcompeted by more copiotrophic (Ramirez et al.2010,
2012). However, the shifts of soil microbial composition by N addition were only observed in the last sampling of this study, and future observations are needed to elucidate whether this alteration is due to the cumulative effect of N addition or not.
Effect of P addition
Phosphorus addition increased all soil PLFA groups since March 2011. This result suggested a cumulative effect of P addition on soil microbial biomass. The increase in soil PLFAs under P treatment also coincided with the pattern of soil microbial biomass C and N in the 2011 and 2012 growing seasons (Wang et al.2014). This may depend on the fact that this soil is P limited, and the relieved P constraints could increase soil microbial biomass, since a previous study has found that microbial utilization of soil C in tropical forests was Fig. 1 The relative abundances
of fungal (a) and bacterial (b) PLFAs (mol%) in the secondary tropical forest after N and P addition.CKcontrol,Nnitrogen addition,Pphosphorus addition,
NPnitrogen and phosphorus addition. Significant differences (LSD test,P<0.05) among treatments are indicated by
different letters. Error barsshow SE (n=5)
Biol Fertil Soils
P limited (Cleveland et al.2002). Griffiths et al. (2012) ob-served an increase of soil microbial biomass in a grazed grassland under long-term P fertilization. They concluded that
soils with no P addition were characterized by strong P limi-tation for microbes. Liu et al. (2012) also reported an increase of microbial biomass by P addition in an old growth tropical Fig. 2 Redundancy analysis of
soil microbial PLFAs and environmental variables (December 2012). Ordination diagrams presenting species scores and environmental factor scores (vectors).DOCdissolved organic C,DONdissolved organic N,aPsoil available P,
NH4soil NH4+-N,NO3soil
NO3−-N
Fig. 3 Principal response curves (PRC) with species weights based on the relative abundance of PLFA biomarker data in the secondary tropical forest under control (baseline), N addition (N), P addition (P), and NP addition (NP) at each sampling event. The first principal component of the variance explained by treatment on they-axis along the sampling periods on thex-axis. The
horizontal dashed zero baseline
forest of South China. Another possible factor is that soil microbes in this forest are carbon (C) limited. P addition in this forest may lead to increase plant growth rate (Wang, personal observation), which would enhance plant C input into soils with stimulation of soil microbial activities. The increased fine root biomass after P addition (Wang et al., unpublished data) supports this assumption. However, in this field study, it is difficult to determine if microbial communi-ties’shifts in the composition are a direct result of P addition or an indirect result of changes in the composition of plant communities and their C inputs to soils.
Phosphorus addition did not only increase the microbial biomass but also altered soil microbial community composi-tion. Soil F/B ratio was significantly increased by P and NP treatments compared to CK in December 2012, indicating a more sensitive increase of soil fungal biomass to P addition than bacterial biomass. The relative abundance data more clearly showed this tendency. Abundance of fungi and bacte-ria as shown by gene copies ( with 16S ribosomal RNA (rRNA) genes and 18S rRNA genes) in South China red soils showed that P fertilization was a key factor in controlling microbial abundance, and abundance of soil fungi was a more sensitive indicator of soil fertility than soil bacterial abun-dance in this region (He et al.2008).
The increased soil microbial activities after P addition were expected in the increase of soil respiration, as confirmed by soil CO2emission data (Wang et al., unpublished). It is well established that changes in soil microbial composition are always associated with alteration of soil C storage and distri-bution (Ramirez et al.2012). In tropical forests, Cusack et al. (2011) observed increased bacterial biomass associated with a decrease in labile C, while an increase in fungal decomposers was associated with lower recalcitrant C compounds. Liu et al. (2013) reported a decrease of light fraction soil C and total soil C after P addition in an old growth tropical forest. After P addition in this forest, we thus expect that soil organic C storage would be altered by the changes in soil microbial community composition.
Conclusions
In this study, we found that N and P addition had different effects on the soil microbial biomass: N addition usually had no effect on total PLFA biomass but reduced the G+ bacterial biomass after 3 years of addition; P addition always had positive effects on microbial biomass in the over 3 years of fertilization. Soil fungal biomass was more sensitive to P-induced effects than bacterial biomass as shown by the higher F/B ratios after P addition. The alterations of soil microbial community composition might further result in altered soil C and N cycling.
Acknowledgments This work was funded by Natural Science Foun-dation of China (31300419), NSFC-Guangdong Joint Project (U1131001), National Basic Research Program of China (2011CB403200), Innovation Foundation of Guangdong Forestry (2012KJCX013-02), and the“Strategic Priority Research Program”of the Chinese Academy of Sciences (XDA05070307).
References
Artursson V, Finlay RD, Jansson JK (2006) Interactions between arbuscular mycorrhizal fungi and bacteria and their potential for stimulating plant growth. Environ Microbiol 8:1–10
Balser TC (2001) The impact of long-term nitrogen addition on microbial community composition in three Hawaiian forest soils. Sci World J 1(Suppl 2):500–504
Bardgett RD, Hobbs PJ, Frostegard A (1996) Changes in soil fungal:bacterial biomass ratios following reductions in the in-tensity of management of an upland grassland. Biol Fertil Soils 22:261–264
Beauregard MS, Hamel C, Atul N, St-Arnaud M (2010) Long-term phosphorus fertilization impacts soil fungal and bacterial diversity but not AM fungal community in alfalfa. Microb Ecol 59:379–389 Bossio DA, Scow KM (1998) Impacts of carbon and flooding on soil microbial communities: phospholipid fatty acid profiles and sub-strate utilization patterns. Microb Ecol 35:265–278
Bünemann EK, Bossio DA, Smithson PC, Frossard E, Oberson A (2004) Microbial community composition and substrate use in a highly weathered soil as affected by crop rotation and P fertilization. Soil Biol Biochem 36:889–901
Chung HG, Zak DR, Reich PB, Ellsworth DS (2007) Plant species richness, elevated CO2, and atmospheric nitrogen deposition alter
soil microbial community composition and function. Glob Chang Biol 13:980–989
Cleveland CC, Townsend AR, Schmidt SK (2002) Phosphorus limitation of microbial processes in moist tropical forests: evidence from short-term laboratory incubations and field studies. Ecosystems 5:0680–
0691
Cleveland CC, Townsend AR, Taylor P, Alvarez‐Clare S, Bustamante M, Chuyong G, Dobrowski SZ, Grierson P, Harms KE, Houlton BZ (2011) Relationships among net primary productivity, nutrients and climate in tropical rain forest: a pan-tropical analysis. Ecol Lett 14: 939–947
Cusack DF, Silver WL, Torn MS, Burton SD, Firestone MK (2011) Changes in microbial community characteristics and soil organic matter with nitrogen additions in two tropical forests. Ecology 92: 621–632
DeForest JL, Zak DR, Pregitzer KS, Burton AJ (2004) Atmospheric nitrate deposition, microbial community composition, and enzyme activity in northern hardwood forests. Soil Sci Soc Am J 68:132–
138
Ding M, Yi W, Liao L, Martens R, Insam H (1992) Effect of afforestation on microbial biomass and activity in soils of tropical China. Soil Biol Biochem 24:865–872
Elser JJ, Bracken ME, Cleland EE, Gruner DS, Harpole WS, Hillebrand H, Ngai JT, Seabloom EW, Shurin JB, Smith JE (2007) Global analysis of nitrogen and phosphorus limitation of primary producers in freshwater, marine and terrestrial ecosystems. Ecol Lett 10:1135–
1142
Frey SD, Knorr M, Parrent JL, Simpson RT (2004) Chronic nitrogen enrichment affects the structure and function of the soil microbial community in temperate hardwood and pine forests. Forest Ecol Manag 196:159–171
Biol Fertil Soils
Frostegård Å, Bååth E (1996) The use of phospholipid fatty acid analysis to estimate bacterial and fungal biomass in soil. Biol Fertil Soils 22: 59–65
Frostegård Å, Bååth E, Tunlid A (1993) Shifts in the structure of soil microbial communities in limed forests as revealed by phospholipid fatty acid analysis. Soil Biol Biochem 25:723–730
Gallo M, Amonette R, Lauber C, Sinsabaugh RL, Zak DR (2004) Microbial community structure and oxidative enzyme activity in nitrogen-amended north temperate forest soils. Microb Ecol 48: 218–229
Griffiths B, Spilles A, Bonkowski M (2012) C:N:P stoichiometry and nutrient limitation of the soil microbial biomass in a grazed grass-land site under experimental P limitation or excess. Ecol Process 1: 1–11
He J-Z, Zheng Y, Chen C-R, He Y-Q, Zhang L-M (2008) Microbial composition and diversity of an upland red soil under long-term fertilization treatments as revealed by dependent and culture-independent approaches. J Soil Sediment 8:349–358
Hietz P, Turner BL, Wanek W, Richter A, Nock CA, Wright SJ (2011) Long-term change in the nitrogen cycle of tropical forests. Science 334:664–666
Kennedy AC (1999) Bacterial diversity in agroecosystems. Agric Ecosyst Environ 74:65–76
LeBauer DS, Treseder KK (2008) Nitrogen limitation of net primary productivity in terrestrial ecosystems is globally distributed. Ecology 89:371–379
LepšJ,Šmilauer P (2003) Multivariate analysis of ecological data using
CANOCO. Cambridge University Press, New York
Liu G, Jiang N, Zhang L, Liu Z (1996) Soil physical and chemical analysis and description of soil profiles. China Standard Methods Press, Beijing, 24
Liu L, Gundersen P, Zhang T, Mo J (2012) Effects of phosphorus addition on soil microbial biomass and community composition in three forest types in tropical China. Soil Biol Biochem 44:31–38 Liu L, Zhang T, Gilliam FS, Gundersen P, Zhang W, Chen H, Mo J (2013)
Interactive effects of nitrogen and phosphorus on soil microbial communities in a tropical forest. Plos ONE 8:e61188
Miller AJ, Schuur EAG, Chadwick OA (2001) Redox control of phos-phorus pools in Hawaiian montane forest soils. Geoderma 102:219–
237
Nilsson L, Bååth E, Falkengren-Grerup U, Wallander H (2007) Growth of ectomycorrhizal mycelia and composition of soil microbial commu-nities in oak forest soils along a nitrogen deposition gradient. Oecologia 153:375–384
Ramirez KS, Lauber CL, Knight R, Bradford MA, Fierer N (2010) Consistent effects of nitrogen fertilization on soil bacterial commu-nities in contrasting systems. Ecology 91:3463–3470
Ramirez KS, Craine JM, Fierer N (2012) Consistent effects of nitrogen amendments on soil microbial communities and processes across biomes. Glob Chang Biol 18:1918–1927
Ren H, Li Z, Shen W, Yu Z, Peng S, Liao C, Ding M, Wu J (2007) Changes in biodiversity and ecosystem function during the restora-tion of a tropical forest in south China. Sci China Ser C 50:277–284
Sayer EJ, Wright SJ, Tanner EVJ, Yavitt JB, Harms KE, Powers JS, Kaspari M, Garcia MN, Turner BL (2012) Variable responses of lowland tropical forest nutrient status to fertilization and litter ma-nipulation. Ecosystems 15:387–400
Shi Y, Lalande R, Ziadi N, Sheng M, Hu Z (2012) An assessment of the soil microbial status after 17 years of tillage and mineral P fertiliza-tion management. Appl Soil Ecol 62:14–23
Shi YC, Lalande R, Hamel C, Ziadi N, Gagnon B, Hu ZY (2013) Seasonal variation of microbial biomass, activity, and community structure in soil under different tillage and phosphorus management practices. Biol Fertil Soils 49:803–818
Tan H, Barret M, Mooij MJ, Rice O, Morrissey JP, Dobson A, Griffiths B, O’Gara F (2013) Long-term phosphorus fertilisation increased the diversity of the total bacterial community and the phoD phosphorus mineraliser group in pasture soils. Biol Fertil Soils 49:661–672 Treseder KK (2008) Nitrogen additions and microbial biomass: a
meta-analysis of ecosystem studies. Ecol Lett 11:1111–1120
Treseder KK, Allen MF (2002) Direct nitrogen and phosphorus limitation of arbuscular mycorrhizal fungi: a model and field test. New Phytol 155:507–515
Tunlid A, Hoitink HAJ, Low C, White DC (1989) Characterization of bacteria that suppress rhizoctonia damping-off in bark compost media by analysis of fatty-acid biomarkers. Appl Environ Microbiol 55:1368–1374
Vitousek PM (1984) Litterfall, nutrient cycling, and nutrient limitation in tropical forests. Ecology 65:285–298
Vitousek PM, Farrington H (1997) Nutrient limitation and soil develop-ment: experimental test of a biogeochemical theory. Biogeochemistry 37:63–75
Vitousek PM, Howarth RW (1991) Nitrogen limitation on land and in the sea: how can it occur? Biogeochemistry 13:87–115
Waldrop MP, Zak DR, Sinsabaugh RL (2004) Microbial community response to nitrogen deposition in northern forest ecosystems. Soil Biol Biochem 36:1443–1451
Walker T, Syers J (1976) The fate of phosphorus during pedogenesis. Geoderma 15:1–19
Wang QK, Wang SL, Liu Y (2008) Responses to N and P fertilization in a youngEucalyptus dunniiplantation: microbial properties, enzyme activities and dissolved organic matter. Appl Soil Ecol 40:484–490 Wang FM, Li J, Wang XL, Zhang W, Zou B, Neher DA, Li ZA (2014) Nitrogen and phosphorus addition impact soil N2O emission in a
secondary tropical forest of South China. Sci Rep 4:5615 Wright SJ, Yavitt JB, Wurzburger N, Turner BL, Tanner EV, Sayer EJ,
Santiago LS, Kaspari M, Hedin LO, Harms KE, Garcia MN, Corre MD (2011) Potassium, phosphorus, or nitrogen limit root allocation, tree growth, or litter production in a lowland tropical forest. Ecology 92:1616–1625
Yu Z, Pi Y (1985) The path and its effects to rehabilitating vegetation on the tropical littoral eroded land in Guangdong province. Trop Subtrop For Ecosyst Res 3:97–108
Zelles L (1999) Fatty acid patterns of phospholipids and lipopolysaccha-rides in the characterisation of microbial communities in soil: a review. Biol Fertil Soils 29:111–129