Strategy of Soybean Management (Glycine max L.) to Cope with Extreme Climate
Using CropSyst
©Model
Aminah1*), Ambo Ala2), Yunus Musa2), Rusnadi Padjung2) and Kaimuddin2)
1) Department of Agronomy Faculty of Agriculture, Universitas Muslim Indonesia Makassar
South Sulawesi Indonesia
2) Department of Agronomy Faculty of Agriculture, Hasanuddin University Makassar
South Sulawesi Indonesia
*) Corresponding author E-mail: [email protected]
Received: July 31, 2016 /Accepted: October 17, 2016
ABSTRACT
This research was carried out to verify the CropSyst© plant model from experimental data in a soybean
ield and to predict planting time along with its
potential yield. The researches were divided into two stages. First stage was a calibration for model on
ield from June to September 2015. Second stage
was the application of the model. The required data models included climatic, soil and crop’s genetic data. There were relationship between the obtained
data in ield and the simulation from CropSyst©
model which was indicated by 0.679 of Eficiency
Index (EF) value. This meant that the CropSyst©
model was well used. In case of Relative Root
Mean Square Error (RRMSE), it was shown at 2.68 %. RRMSE value described that there was a 2.68%
error prediction between simulation and actual production. In conclusion, CropSyst© can be used to predict the suitable planting time for soybean and as the result, the suitable planting time for soybean on the dry land is the end of rainy season (2nd June
2015). Tanggamus variety is the most resistant
variety based on slow planting time, because the decreased percentage of production was lower
(8.3%) than Wilis (26.3%) and Anjasmoro (43.0%).
Keywords: calibration; CropSyst©; Eficiency Index; RRMSE; soybean
INTRODUCTION
Soybean is one of food crops with high protein
content (ca. 39%) consequently highly enthused by
consumers. In addition, soybean has a great prospect of market and it can help farmers to increase their income. Year by year, soybean’s demand increases because of the increasing of human population, however, the domestic production of soybean is only
possible to reach 998.870 ton (Statistics Indonesia, 2016) or 37 % of national demand. Finally to cover
the lack of production, import is the only reasonable effort.
There are some environmental factors related to the lower productivity of soybean. Drought and
looding as results of climatic anomaly and climate
change are the main causal factors. Many sectors are affected by climate changes, and agriculture is the most susceptible sector related to extreme climate change. Ecosystem of rice and other food crops such as soybean are the common examples that impacted by the extreme climate changes
(Kaimuddin, Kamaluddin, & Sasmono, 2013).
To solve environmental problems, there are
some desires to ind integrated software or models
that combined some variables from interdisciplinary approaches as solution models (Donatelli, Bregaglio,
Confalonieri, de Mascellis, & Acutis, 2014). Models
or software which can simulate plant growth and development on the varied crop management are opportunity in the global modernization of agricultural production. Some models can describe the plant responses on the different environment and crop management (Singh, Tripathy, & Chopra,
2008; Evett & Tolk, 2009).
CropSyst© is one of models that can describe some concepts in the agriculture for future (Stöckle et
al., 2014). This model was used to predict or simulate
the growth and development of the selected plants or crops on the selected soil. It produces model that can estimate the potential crop production on the
speciic climatic and soil condition (Radovanović & Šovljanski, 2013) and it is the irst step for crops
to adapt on the cropping system (Stöckle et al.,
2012). This model has been applied on some crops
and in some areas of the world (Singh, Tripathy, &
Chopra, 2008; Palosuo et al., 2011; Rotter et al., 2012). Calibration and validation are needed as
preliminary procedure before applying CropSyst©
on the various environmental conditions.
Cite this as: Aminah, Ala, A., Musa, Y., Padjung, R., & Kaimuddin. (2017). Strategy of soybean management (Glycine max L.) to cope with extreme climate. AGRIVITA Journal of Agricultural Science, 39(3), 324–328. http://doi.org/10.17503/
agrivita.v39i3.1020
Based on that condition, it is deemed necessary to get a better strategy of soybean management to cope the extreme climate change
by using CropSyst©. This research was needed
because mitigation and adaptation of climate change on agriculture sectors are the latest issues in the world, especially food crops are very susceptible to climate change.
MATERIALS AND METHODS
This research was divided into two stages
based on the use of CropSyst© models. The irst
stage was calibration stage and the next stage was
ield application (preparation and test of Relative Root Mean Square Error; RRMSE). Calibration
stage was conducted in the ield from June to September 2015, at the Bureau of Meteorology,
Climatology and Geophysics (BMKG) in Maros District. Split-plot design was adopted in the research that consisted of treatments; variety (V)
as the main plot and planting time (W) as sub-plot. Three varieties, such as Tanggamus (V1), Wilis (V2) and Anjasmoro varieties (V3) were used. Planting times were divided into four periods, namely 2 June (W1), 12 June (W2), 22 June (W3) and 2 July 2015 (W4). Growth Degree Days (GDDs) were observed
from planting to harvest period. Plant phenological
variables such as emergence, end canopy growth,
early lowering, early seed illing, early senescence,
maturity and completed senescence were also recorded. Application model was conducted after calibration stage. In this stage, the data obtained from
calibration/veriication in the ield were then used in
CropSyst© models. The required data models were daily climatic data (such as precipitation, radiation, air temperature, and humidity), physical soil (pH,
bulk density, ield capacity, permanent wilting point,
cation exchange, sand, silt and clay contents), and the plant genetic data.
RESULTS AND DISCUSSION Calibration Stage
Calibration is a process of selecting the combination of variables or to change the plant and
soil variables for ixing of variables in the model and
then collecting plant variables that is needed for the model. On calibration stage (parameterization
of CropSyst© model) was done by comparing the
simulation and current values that were obtained on
the ield, and then changing the sensitive variables
to get the best results that were close to the actual
results on ield.
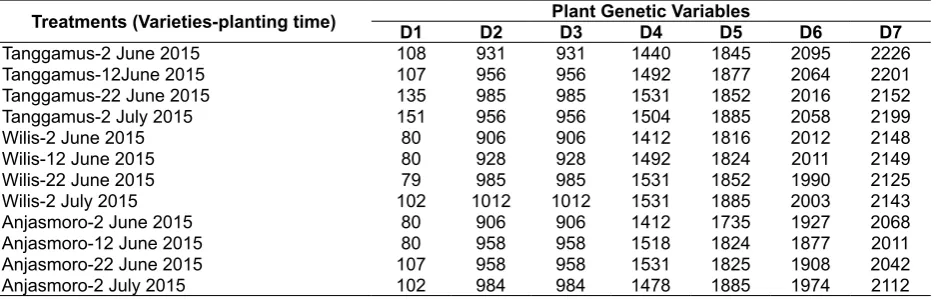
On calibration activities, data of plant genetic (Table 1) and soil variables (Table 2) were obtained from the observation results in Laboratory of Soil Science, Faculty of Agriculture, University of Hasanuddin, Makassar, Indonesia.
Table 1. Values of soybean genetic data were obtained on the ield
Treatments (Varieties-planting time) Plant Genetic Variables
D1 D2 D3 D4 D5 D6 D7
Tanggamus-2 June 2015 108 931 931 1440 1845 2095 2226
Tanggamus-12June 2015 107 956 956 1492 1877 2064 2201
Tanggamus-22 June 2015 135 985 985 1531 1852 2016 2152
Tanggamus-2 July 2015 151 956 956 1504 1885 2058 2199
Wilis-2 June 2015 80 906 906 1412 1816 2012 2148
Wilis-12 June 2015 80 928 928 1492 1824 2011 2149
Wilis-22 June 2015 79 985 985 1531 1852 1990 2125
Wilis-2 July 2015 102 1012 1012 1531 1885 2003 2143
Anjasmoro-2 June 2015 80 906 906 1412 1735 1927 2068
Anjasmoro-12 June 2015 80 958 958 1518 1824 1877 2011
Anjasmoro-22 June 2015 107 958 958 1531 1825 1908 2042
Anjasmoro-2 July 2015 102 984 984 1478 1885 1974 2112
The purpose at this stage was to see the accuracy of the model related to the condition of growth and development stages of soybean (from emergence to harvesting phases). Seven phases of soybean growth and development were observed in this research such as: 1) emergence, 2) end of
canopy growth, 3) early lowering, 4) early seed illing, 5) early senescence, 6) maturity and 7) completed
senescence phases. The relationship of data between
observation result in ield/current and simulation result on every treatment were described in Table 3.
Based on the validation, CropSyst© was
suitable to be used as a simulation tool for soybean.
It has been showed by Eficiency Index (EF) with value 0.679 that was obtained from actual production in ield and simulation CropSyst© model result. This model can be used to predict the production based
on suitable planting time. RRMSE resulted 2.684%, it showed that there was 2.684% prediction error
between actual and simulating results.
Wijayanto (2010) reported that the lowest
prediction error was produced by simulating model using variable`s values which were obtained from
previous research (Bellocchi et al., 2000). According
to his result, the lowest prediction error obtained
the high value of EF (0.97). High value of EF and
the lowest value of prediction error were the main indicators that CropSyst© could be used to predict crop production based on Nitrogen (N) application. However, this research was applied in the small
area (ca. 40 Ha) only, where there are differences
related to the differences in management. Table 2. Observation results of soil variables in
Bureau of Meteorology, Climatology and Geophysics, Maros District
Soil variables Values
Bulk Density (g cm-3) 1.24
pH (H2O) 6.90
Field capacity (%) 2.01
Cation Exchange Capacity 25.63
Base Saturation (%) 56.00
Permanent Wilt Point (cm cm-3) 0.26
Sand content (%) 22.00
Dust content (%) 32.00
Clay content (%) 46.00
Thickness (m) 0.20
Table 3. Relationship production data between simulation and actual observation for all treatment`s combinations of soybean
Treatments Simulation/ Actual Plant variables
Production (t ha-1) Stover Results (t ha-1)
Tanggamus-2 June 2015 S 1.059 2.119
A 1.140 2.358
Tanggamus-12 June 2015 S 0.714 1.428
A 1.09 1.943
Tanggamus-22 June 2015 S 0.507 1.014
A 0.840 1.773
Tanggamus-2 July 2015 S 0.356 0.711
A 0.810 1.008
Wilis-2 June 2015 S 1.052 2.105
A 1.130 2.133
Wilis-12 June 2015 S 0.749 1.497
A 1.090 1.516
Wilis-22 June 2015 S 0.614 1.228
A 0.890 1.886
Wilis-2 July 2015 S 0.540 1.080
A 0.570 1.116
Anjasmoro-2 June 2015 S 1.074 2.147
A 1.180 2.182
Anjasmoro-12 June 2015 S 0.803 1.606
A 0.980 1.598
Anjasmoro-22 June 2015 S 0.510 1.020
A 0.800 1.175
Anjasmoro-2 July 2015 S 0.483 0.965
A 0.590 1.001
RRMSE (%) 2.684 2.712
Application Model
In this stage, veriication was conducted by using
soybean as plant model on the CropSyst© program to predict the production of soybean for each treatment. After result of simulation was obtained, the comparison between simulation and actual productions for each treatment were then compared. Relationship between simulation and actual productions for each treatment
are described in Table 3.
Result showed that model of soybean production can predict actual production of soybean and there was a correlation between simulation and
actual production, with the value 0.679 (Fig. 1). This
means that this model was suitable for soybean.
Based on the veriication between actual
and prediction data, the high production was
resulted at the irst planting time (2 June 2015), and
production decreased at longer planting time. This condition was related to rainfall intensity, where the
irst planting time received the highest intensity of rainfall. The second (12 June 2015), third (22 June 2015) and fourth (2 July 2015) planting times had
no rain. In addition, the highest production was a result from treatments of soybean varieties such as
Tanggamus, Wilis and Anjasmoro at the irst planting
time. As conclusion, growth, development and production of soybean were related to the planting time. If soybean plants are planted at unsuitable planting time, it will cause some problems, such as:
1. Pest attack, for example: the ly nut will be an outbreak if soybean is planted at 2-4 weeks different
than others. To solve the problem, it is better to plant soybean at the same planting time. In case of
disease, Hong et al. (2012) reported that delayed planting time up to 15 days reduced the intensity
of bacterial disease on soybean. Related to this
condition, it is better to use the resistant cultivar if the planting time are on the different planting times. If susceptible cultivar is used, a delayed planting time with fungicide application is suggested to reduce the bacterial disease intensity on soybean. 2. Drought as result of delayed planting time. Hu
& Wiatrak (2011) reported that the delayed
planting time on the unsuitable climatic condition contribute to the lower quality in soybean growth, development and production. In addition, lower quality of seed will ensue because of the changes in oil and protein contents.
3. Water also contributed to growth, development and production of soybean. Aminah et al. (2013) reported that the suficient water during vegetative
stage and the lower volume of water during
generative stage (lowering and ripening of seed
stages) increased the production of soybean.
CONCLUSION
CropSyst© can be used to predict the suitable planting time for soybean and as a result, the suitable planting time for soybean on the dry land is in the
end of rainy season (2 June 2015). Tanggamus
variety was the most resistant variety based on slow planting time, because the decreased percentage of
production was the lowest (8.3%) than Wilis (26.3%) and Anjasmoro (43.0%).
ACKNOWLEDGEMENT
The authors would like to thank our colleagues who have helped in the completion of this research
and also to the head ofice of BMKG Maros,
Indonesia for providing facilities and infrastructure for the implementation of this research.
Fig. 1. Veriication result between simulation and actual productions for three varieties of soybean on the four planting times in Maros District
Actual production (tons.ha-1)
Simulation (tons.ha
REFERENCES
Aminah, Jusoff, K., Hadijah, St., Nuraeni, Reta, Marliana, S. P., .... & Nonci, M. (2013).
Increasing soybean (Glycine max L.) drought resistance with osmolit sorbitol. Modern Applied Science, 7(9), 78-85. http://dx.doi. org/10.5539/mas.v7n9p78
Bellocchi, G., Ashman, M., Shevtsova, L., Donatelli, M., Smith, P., Romanenkov, V., .... & Dailey,
G. (2000). Using cropsyst and sundial to
simulate soil organic matter dynamics at two sites in Eastern Europe. Paper presented at
Proceedings of the 3rd ICS – ESA Congress,
Hamburg, Germany (pp. 1-3). Retrieved from http://www.cracin.it/sipeaa/tools/CropSyst/
CS_lassee.pdf
Donatelli, M., Bregaglio, S., Confalonieri, R., de
Mascellis, R., & Acutis, M. (2014). A generic
framework for evaluating hybrid models by
reuse and composition – A case study on
soil temperature simulation. Environmental Modelling & Software, 62, 478–486. http://doi. org/10.1016/j.envsoft.2014.04.011
Evett, S. R., & Tolk, J. A. (2009). Introduction: Can water use eficiency be modeled well enough
to impact crop management? Agronomy
Journal, 101(3), 423–425. http://doi.org/10.21 34/agronj2009.0038xs
Hong, J,-K., Sung, C.-H., Kim, D.-K., Yun, H.-T., Jung, W., & Kim, K.-D. (2012). Differential effect of
delayed planting on soybean cultivars varying
in susceptibility to bacterial pustule and wildire
in Korea. Crop Protection, 42, 244-249. https://
doi.org/10.1016/j.cropro.2012.07.014
Hu, M., & Wiatrak, P. (2011). Effect of planting date
on soybean growth, yield, and grain quality: Review. Agronomy Journal, 104(3), 785–790.
http://doi.org/10.2134/agronj2011.0382
Kaimuddin, K., Kamaluddin, A., & Sasmono, M. S.
(2013). Analisis tingkat kerentanan dan adaptasi terhadap perubahan iklim berbasis ekosistem
padi di provinsi Sulawesi Selatan [Analysis of
vulnerability and adaptation to climate change with rice-based ecosystem in South Sulawesi]. Retrieved from http://balitbangda.sulselprov.
go.id/artikel-analisis-tingkat-kerentanan-dan- adaptasi-terhadap-perubahan-iklim-berbasis-ekosistem-padi-di-provins.html
Palosuo, T., Kersebaum, K. C., Angulo, C., Hlavinka,
P., Moriondo, M., Olesen, J. E., … Rötter, R.
(2011). Simulation of winter wheat yield and
its variability in different climates of Europe: A comparison of eight crop growth models.
European Journal of Agronomy, 35(3), 103– 114. http://doi.org/10.1016/j.eja. 2011.05.001 Radovanović, S., & Šovljanski, A. (2013). CropSyst
model and model testing for use in Serbia.
Paper presented at Technical Workshop
on Crop Yield Forecast in SEE, Skopje,
Macedonia 30 – 31 May. Republic
Hydrometeorological Service of Serbia. Retrieved from http://ies-webarchive-ext.jrc.
it/mars/mars/content/download/3244/16290/ ile/24_Sovljanski_Serbia.pdf
Rotter, R. P., Palosuo, T., Kersebaum, K. C., Angulo,
C., Bindi, M., Ewert, F., … Trnka, M. (2012).
Simulation of spring barley yield in different climatic zones of Northern and Central Europe: A comparison of nine crop models.
Field Crops Research, 133, 23–36. http://doi.
org/10.1016/j.fcr.2012.03.016
Singh, A. K., Tripathy, R., & Chopra, U. K. (2008). Evaluation of CERES-Wheat and CropSyst models for water–nitrogen interactions in
wheat crop. Agricultural Water Management, 95(7), 776-786. https://doi.org/10.1016/j. agwat.2008.02.006
Statistics Indonesia. (2016). Tanaman pangan
[Crop plants]. Retrieved from https://
bps.go.id/Subjek/view/id/53#subjek ViewTab3|accordion-daftar-subjek1
Stöckle, C. O., Kemanian, A. R., Nelson, R. L., Adam,
J. C., Sommer, R., & Carlson, B. (2014). CropSyst model evolution: From ield to
regional to global scales and from research to decision support systems. Environmental Modelling & Software, 62, 361–369. http://doi. org/10.1016/j.envsoft.2014.09.006
Stöckle, C., Higgins, S., Kemanian, A., Nelson, R.,
Huggins, D., Marcos, J., & Collins, H. (2012).
Carbon storage and nitrous oxide emissions
of cropping systems in eastern Washington:
A simulation study. Journal of Soil and Water
Conservation, 67(5), 365–377. http://doi.org/1
0.2489/jswc.67.5.365
Wijayanto, Y. (2010). Site speciic nitrogen management
simulated by cropsyst model under different inputs of nitrogen fertilizer. Journal of
Tropical Soils, 15(3), 229-235. Retrieved