Original scientific paper UDC: 005.336.4:330.35>(4-12) https://doi.org/10.18045/zbefri.2018.2.777
The impact of national intellectual capital on the
economic growth in the South-Eastern European
Countries
*Tatjana Stevanović
1, Maja Ivanović-Đukić
2, Tamara Rađenović
3,
Ognjen Radović
4Abstract
In the contemporary circumstances, intellectual capital has become the engine of the economic, social and cultural development. Mobilization and utilization of intellectual resources in enterprises create value, thus transforming and accelerating development of national economies towards the knowledge and innovation based economies. Due to these reasons, the most developed economies increase investments in education, information technologies and stimulate innovativeness. On the other hand, less developed countries do not have possibilities for significant investments in creating and employing national intellectual potential. This is reflected in their economic growth rates, as in the case of the Southeastern European (SEE) countries. In that regard, the paper investigates the impact of education, information technologies and innovations, as determinants of national intellectual capital development, on the economic growth in the SEE countries. The aim of this paper is to identify the contribution of the key intellectual capital determinants to the economic growth and development in the SEE countries and propose measures whose implementation lead to further development towards knowledge and innovation economies. The results of * Received: 02-05-2018; accepted: 28-11-2018
1 Associate Professor, University of Niš, Faculty of Economics, Trg kralja Aleksandra Ujedinitelja
11, 18000 Niš. Scientific affiliation: accounting, finance. Phone: +381 18 528 666. E-mail: tatjana.stevanovic@eknfak.ni.ac.rs.
2 Associate Professor, University of Niš, Faculty of Economics, Trg kralja Aleksandra Ujedinitelja
11, 18000 Niš. Scientific affiliation: management, finance. Phone: +381 18 528 659. E-mail: maja.ivanovic@eknfak.ni.ac.rs.
3 Researcher, University of Niš, Faculty of Economics, Trg kralja Aleksandra Ujedinitelja 11,
18000 Niš. Scientific affiliation: macroeconomics, intellectual capital. Phone: +381 18 528 659. E-mail: tamara.radjenovic@eknfak.ni.ac.rs.
4 Associate Professor, University of Niš, Faculty of Economics, Trg kralja Aleksandra Ujedinitelja
11, 18000 Niš. Scientific affiliation: informatics, finance. Phone: +381 18 528 653. E-mail: ognjen.radovic@eknfak.ni.ac.rs.
correlation analysis revealed positive and statistically significant correlation between GDP per capita and employed measures of national intellectual capital. The research has shown that increase in high-technology export, number of R&D researchers and mobile phone subscribers has a positive and significant impact on economic growth. The authors advise intensified cooperation between business community and institutes and universities to achieve synergetic effects in generating and utilising national intellectual potential.
Key words: intellectual capital, innovation, information technology, economic growth, performance measurement
JEL classification: I25, M40, O32, O34
1. Introduction
Human capital is one of the most important factors of economic growth and development, especially in the globalized environment in which the success of organizations in the international market can only be achieved by constant enhancement of their knowledge and innovations. Since the early 1980s, the importance of education and innovations, as the elements of human capital, for the long-term economic growth has been the subject of interest of the new theory of economic growth. New growth theory observes technological changes as an endogenous variable that is crucial in explaining economic performance and competitiveness (Plummer et al., 2014). In doing so, special attention is paid to the contribution of certain factors to economic growth such as: education level, investments in education, investments in research and development (R&D), institutional support and entrepreneurship. According to the endogenous growth theory, economic growth is viewed as a function of accumulated knowledge and innovations (Lucas, 1988; Romer, 1986).
Over the past two decades, the role of knowledge and intellectual capital has increased significantly (Bontis, 2004). This partly can be explained by the rapid advances in information and communication technologies (ICTs) that have significantly decreased the costs of computing power and electronic networking. With the increased affordability, the usage of computing power and electronic networking has surged, along with the efficient dissemination of existing knowledge. Furthermore, modern ICTs enable researchers across the world to work together, thus enhancing the productivity of researchers and resulting in rapid advances in R&D, as well as in the generation of new knowledge and technologies. The usage of new knowledge and technologies has become the factor of a strategic importance. For this reason, the most developed countries invest enormous resources in education and technology development which additionally contributes to the improvement of their competitiveness.
Apart from knowledge and technology, innovation is becoming an increasingly important source of competitiveness (Krstić, 2014). In recent years, it has become
extremely important to derive additional value added through the various product differentiations via innovative designs, effective marketing, efficient distribution, reputable brand names, etc. In other words, the key source of competitive capability is linked to the possibility to introduce various forms of innovation.
Therefore, knowledge, technology and innovation, specifically intellectual capital, have become the key drivers of economic development and the basis for the national competitiveness. In line with the above, the World Bank has created a KAM methodology with the aim to enable the construction of a knowledge-based society and contribute to the improvement of the national competitiveness (Chen and Dahlman, 2006). This methodology asserts that sustained investments in education, innovation, ICTs, and encouraging economic and institutional environment will lead to the increased creation and usage of intellectual capital in economic production, consequently resulting in the sustained economic growth. The intellectual capital of a country represents its ability to transform knowledge and other immaterial resources into wealth (Bradley, 1997a; 1997b). The basic assumption underlying national intellectual capital is reflected in the importance to create, acquire and develop valuable knowledge and its efficient and effective usage (Käpylä et al., 2012). National intellectual capital can be described as knowledge-based assets that support the growth and development of a country (Seleim and Bontis, 2013). Investments in intellectual capital are the main determinants of economic growth, employment and living conditions of citizens (Užienė, 2014). Those governments that invest more in education and training, as well as in R&D and science, have greater possibilities for growth and development.
This paper investigates the impact of education, information technologies and innovations, as determinants of national intellectual capital development, on the economic growth in the SEE countries. The aim of the paper is to identify the contribution of the key intellectual capital determinants to the economic growth and development in the SEE countries and propose measures whose implementation lead to further development of these countries towards knowledge and innovation economies. In that regard, following hypothesis is evaluated: the national intellectual capital is an important determinant of the economic growth in SEE countries.
The main contribution of the paper is a conducted research on the impact of intellectual capital on the economic growth in the SEE countries. The correlation and regression analyses results will point to the intellectual capital determinants that have the biggest impact on the economic growth in the analysed countries. These results can be useful for macroeconomic policy makers to anticipate the measures whose implementation could increase economic growth and create a knowledge-based society. The conducted research can serve as a good basis and inspiration for further researches in this area.
The paper is organized as follows. After the introduction the literature review is presented, followed by the methodology issues. The next section is devoted to empirical data analysis, followed by the discussion of the obtained results. The final part of the paper submits concluding remarks.
2. Literature review
Prevailing trends in the environment, namely, globalization, influential technological inventions and intense regulation, have altered the structure of market competition. The emphasis has been put on the new sources of value creation and competitive advantage, especially, on the intellectual resources. The success and survival of each nation, region, organization or individual in the knowledge economy, largely depend on the quality and productivity of knowledge, as the most important intellectual resource. This indicates that future depends largely on the ability to create a knowledge base and its prudent usage, thus imposing enormous responsibility on individuals in determining the evolutionary path of a society (Viedma Marti and Cabrita, 2012).
From the 1990s onwards, the literature dealing with intellectual capital issues has increased significantly (Brooking, 1998; Stewart, 2001; Bounfour, 2003; Al-Ali, 2003; An, 2015). Many companies, academic institutions, governments, influential international organizations (such as the Organization for Economic Co-operation and Development, the World Bank Institute, the European Commission and others) have initiated a powerful discussion on intangible assets. In the global knowledge economy, investments in intellectual resources have been increasingly seen as a source of wealth, competitiveness and prosperity. The intellectual capital and competitiveness of nations are strongly linked, as a result of knowledge in them (Ståhle and Ståhle, 2006). The Global Competitiveness Index, published by the World Economic Forum, indicates that the extent of the impact of intellectual capital on the countries’ competitiveness is between 58% and 70%. Namely, this index shows that the influence of human capital (education, skills and capabilities), organizations and technologies is highly dominant and determines, to a large extent, the competitive position of countries. The influence of intellectual capital is directly linked to the level of economic development of countries. Hence, this influence is higher in developed countries compared to developing ones.
Intellectual capital is defined as intangible assets that are not reported in the balance sheet, and it consists of (Brooking, 1998): property that gives the company market power, such as brand, customer loyalty, exclusive contracts, etc.; intellectual property such as patents, trademarks, copyrights, etc.; assets that give the organization internal strength, such as corporate culture, management and business processes, information systems, etc.; assets contained in characteristics of human
resources such as: knowledge, competence, skills, experience, ability to connect and cooperate. Intellectual capital represents a product of “flows of knowledge” in organization, or organizational learning, and it consists of human, structural and capital in relations with clients and other stakeholders (Bontis, 1998).
Many authors point to the role of intellectual capital in the process of creating and improving competitiveness (Stewart, 2001; Bounfour, 2003; An, 2015). Thereby, numerous research studies observe the contribution of some basic components of intellectual capital to economic growth. Namely, some authors explore the impact of innovation on competitiveness (Mehrara et al., 2017; Jankowska et al., 2017; Franco and Oliveira, 2017), while others examine the relationship between education and economic growth (Cohen and Soto, 2007; Neycheva, 2010; Suri et al. 2011; Pelinescu, 2015). Also, a certain number of researchers refer to the integral influence of all components of intellectual capital on the competitiveness of a national economy (Al-Ali, 2003; Dorinela, 2015).
Innovations play a key role in countries willing to increase their economic growth and prosperity. The innovative potential of an economy affects the macroeconomic and microeconomic factors such as GDP/capital, R&D expenditure, international trade. For example, Ercis and Ünalan (2016) examine the innovation positions of Turkey and South Korea. In their study they propose several measures for improving innovation potential of a country, that is: target oriented approach in R&D and innovation; policy changes towards the technology intensive industry; focus on a medium and high-tech products; supporting mechanisms for setting up research and development institutes and universities; increasing diversity of financial and tax incentives, including the funding system for a technology and research staff; increasing education expenditures; human capital improvement; efficient technology and innovation policy; promotion of sectors and companies with a large potential for a sustainable competitive advantage.
The research conducted by Pilinkiene (2015) focuses on the R&D funding in the Baltic States. The results reveal that the most of the R&D funds are from the state budget and that the largest part of the funds are allocated to higher education. Instead, the leading innovation countries allocate the largest part of R&D to the business sector.
Radosevic (2015) explores the relationship between R&D and competitiveness of the SEE economies. The SEE countries are fairly diverse in terms of competitiveness, with visible effects regarding the role of R&D, as confirmed by analysis of the R&D demand and supply factors. This author points to the fact that the broader role of R&D will increasingly depend on the strength of horizontal links within the national innovation system and the local innovative business sector. This requires re-examination of the science and technology policy. The results of this study indicate that a broad innovation policy is necessary for providing
long-term growth in the SEE economies. The measures include foundation of a public R&D which are related to the domestic industrial, agricultural and health sectors, and better usage of international assistance to integrate research and technological development in the SEE countries.
Bearing in mind the importance and role of high-tech exports in economic growth, Mehrara et al. (2017) identifies factors affecting exports. Their study investigates export determinants for 24 developing countries from 1996 to 2013. The results reveal that the rule of law (as an indicator of institutional quality), human capital, imports (as a measure of openness) and GDP are the most important factors affecting high technology export in developing countries.
Jankowska et al. (2017) explains how national innovation systems can transform innovation input into innovation output in different countries. They conclude that a higher level of innovation does not always mean the greater competitiveness of an economy. Namely, it is incorrect to conclude that a higher innovation result turns into a greater competitiveness of the economy, since the second issue is a complex phenomenon. Thus, taking into account a wider set of factors and deviating from the perspective of innovation efficiency, they conclude that the Polish economy has better results than Bulgaria. A study of the relationship between the sale of new or significantly improved products and physical capital and human capital in the Polish industry for the period 2011-2013 shows that the impact of physical capital on the relative increase in innovative production is greater than the impact of human capital. The obtained results indicate a higher degree of flexibility in sales of new and significantly improved products in relation to actual capital expenditure flows rather than human capital investment flows (Zwolak, 2016).
Franco and Oliveira (2017) analyse progress in the economic development of the BRICS (Brazil, Russia, India, China and South Africa countries) from 2008 to 2013. The results demonstrate the decline in innovations during the economic crisis (2008-2009). After the crisis, it is possible to perceive a mild recovery due to the rapid increase in institutional and infrastructure inputs. The analysis recommends to provide a special treatment for the human capital, market sophistication and business sophistication.
Many studies have confirmed the importance of Information and Communication Technologies for the improvement of productivity performance. Kostoska and Hristoski (2017) measure different aspects of competitiveness and assess the level of productivity and competitiveness of the Western Balkans countries: Albania, Macedonia, Montenegro and Serbia. In their study, they evaluate the relative position of the region in relation to the EU member states regarding competitiveness. They conclude that the EU is far from a homogeneous entity in terms of competitiveness, while candidate countries are exposing a competitiveness profile similar to that in Central and Eastern Europe. Some authors consider the
relationship between different ICT usages and the export activities of a company. Kotnik and Hagsten (2018) explore this relationship for several European countries on a sample of major production and service companies. The results of their research indicate heterogeneity among countries and specific characteristics of service firms. In some countries, e-sale is positively related to the likelihood of exports for companies from both sectors, while the website possession is relevant to production companies, and employees with broadband Internet access are relevant to service firms only.
Many authors have examined human capital as one of the most important factors of economic growth and development. A study conducted by Cohen and Soto (2007) on a sample of 95 countries in the period 1960-2000 intended to determine the average years of schooling in the analysed countries, as well as the impact of the quantity of education on economic growth. The results of the study have shown that middle and low-income countries have not yet reached the average years of schooling that the high-income countries had in 1960. In addition, the authors have shown that the years of schooling have a positive impact on economic growth. Baldacci et al. (2008) examined the impact of social expenditures on human capital and economic growth on a sample of 118 developing countries in the period 1975-2000. The results of the study have shown that the impact of education on economic growth is more significant in low-income countries.
The research conducted by Neycheva (2010) aimed to determine the impact of education on economic growth in the EU member states in the period 1995-2009, where the whole sample was analysed first, and then were specially observed “old member states” and “new member states” As an indirect indicator of human capital, the ratio of public expenditure on education to GDP was used, since they account for 85% of total education expenditure in the EU (Neycheva, 2010). Regarding the sample of 20 EU countries, the results confirmed that public expenditure on education has a positive and statistically significant impact on long-term fluctuations in the real growth of output. It has also been found that higher public investment in R&D means higher rates of economic growth. However, by dividing the sample into old and new member states, the results have changed when it comes to the new member states. Namely, in the case of post-communist countries, the links between public expenditure on education and economic growth are not statistically significant and stable. Surveys conducted by Suri et al. (2011) show that the level of human development is an important determinant of economic growth and that policies that are aimed at improving human development must precede or complement growth-oriented policies in order to achieve accelerated and sustainable growth.
Mercan and Sezer (2014) examined the impact of education expenditure on the economic growth in Turkey in the period 1970-2012, where real GDP and total education expenditure were used as variables. The results confirmed the positive
impact of education on economic growth. Dragonescu (2015) examined the long-term relationship between economic growth and higher education in Romania in the period 1980-2012. The survey used annual data, where the dependent variable was GDP per capita, and independent variables were: the share of public expenditure on education in GDP and the number of students involved in higher education. The results showed that increasing the number of students leads to an increase in per capita GDP, confirming that higher education has a significant positive impact on economic growth.
Pelinescu (2015) used the annual panel data of the Eurostat database for the period 2000-2012 and examined the impact of education expenditure as a percentage of GDP, the number of patents, the number of employees with secondary education and exports of goods and services, to the level of GDP per capita in the EU countries. The results of the fixed effects model showed that there was a statistically significant positive link between GDP per capita, the innovation capacity of human capital and the educational structure of employees, while education expenditure as a percentage of GDP showed a negative impact on GDP per capita. Pelinescu (2015) believes that the negative impact of expenditure on education on GDP is due to the heterogeneity of analysed countries.
Sekuloska (2014) examined the interdependence between the quality of the higher education and training system and the level of competitiveness in the SEE countries. The obtained results confirmed the positive correlation between the quality of human capital and competitiveness in all analysed countries. The study by Bokana and Akinola (2017) observed the productivity effects of higher education enrolment, higher education output and the associated productivity gap in selected sub-Saharan Africa countries from 1981 to 2014. The results have shown that both higher education enrolment and higher education output have a significant impact on the growth rate of total factor productivity. In addition, higher education enrolment has a positive effect on total factor productivity, while the inverse relationship is confirmed in the case of higher education output.
The research conducted by Choi and Lee (2015) aimed to establish a link between the various factors that affect educational competitiveness that is the key for improving national competitiveness in OECD countries. The PISA score was used as the dependent variable, or the indirect indicator of educational competitiveness, while the independent variables in the analysis were: GDP per capita, total education expenditures as a percentage of GDP, total expenditure per capita, private education expenditure as a percentage of GDP and the ratio of the number of students to teaching staff. The results of the research have shown that there are three significant combinations of variables that affect educational competitiveness: 1) high total expenditure on education as a percentage of GDP, high expenditure per capita, high private expenditure on education as a percentage of GDP and high GDP per capita (Netherlands, Finland, Australia, Ireland); 2) low total expenditure on
education as a percentage of GDP, low per capita education expenditure, low ratio of the number of students per teaching staff, low private education expenditure as a percentage of GDP and low GDP per capita (Poland), and 3 ) low total expenditure on education as a percentage of GDP, low education expenditure per capita, high ratio of students per teaching staff, high private education expenditure as a percentage of GDP and high GDP per capita (Choi and Lee, 2015). Accordingly, each country should choose the appropriate model for improving educational competitiveness, depending on the interaction between these factors.
By exploring the integral influence of all components of intellectual capital on competitiveness, some authors conclude that knowledge is the main resource of global economic development. According to Dorinela (2015), the progress of the economies is possible in relatively short periods, to the extent that they are able to create, access, use and expand knowledge. For this reason, the study employs the World Bank KAM methodology. The KAM includes 148 structural and qualitative variables and a group of 146 countries, including the majority of OECD economies and over 90 developing countries. The indicators are grouped into four pillars of the knowledge economy: stimulating institutional and economic environment that allows the free flow of new or existing knowledge; educated and expert population in order to create, exchange and use knowledge; network of private companies, research centres, universities, etc. to adapt to local needs and to create new technologies; dynamic information infrastructure in order to facilitate efficient communication, dissemination and information processing.
Chen and Dahlman (2006) emphasize the importance of knowledge for long-term economic growth. They present the concept of knowledge economy in which knowledge is the main driver of economic growth. Authors also introduced a simple knowledge economy benchmarking tool, the KAM, which was developed by the World Bank Institute. It is designed to provide the basic assessment of a country’s readiness to become the knowledge economy. Also, it identifies sectors or specific areas where policy makers should focus more attention on future investments. Additionally, these authors presented the framework of knowledge economy, which claims that the investments in education, innovation, information and communication technologies and a favourable economic and institutional environment will lead to an increase in the use and generation of knowledge in economic production, and will result in sustainable economic growth.
3. Methodology
For measuring intellectual capital of national economy, several measures have been employed. These measures are based on the three phases of the intellectual capital management, according to Al-Ali (2003): knowledge management,
innovation management and intellectual property management. Thus, for measuring knowledge the gross enrolment ratio of tertiary education is used (TE) (Lin and Edvinsson, 2008; Lin and Edvinsson, 2013; Ståhle et al., 2015). Education is an important determinant of human capital development and according to the literature the higher level of education has a positive impact on the economic growth since it enables development and usage of modern technology as a prerequisite for the technological advances and development.
Research and development expenditures as percentage of GDP (RD) are used as a measure of investments in the innovation capital of a country (Weziak, 2007; Seleim and Bontis, 2013). Higher value of R&D expenditures indicates bigger investments in the innovation capital, thus suggesting an advanced level of economic growth and development. Another proxy measure of the innovation capital is the number of researchers in the R&D per million people (Ståhle et al., 2015). If country possesses a greater number of the R&D researchers (R), it is expected to have advanced economic development. Additionally, the results of the innovation activities are implemented in the final products and thus the high-technology export (EXP) is employed as well (Bontis, 2004; Hervas‐Oliver and Dalmau‐Porta, 2007). It is expected that the higher value of high-technology export results in the higher level of economic growth and development.
In order to spread knowledge within and outside the organizations, the information and communication technologies are very important. Therefore, we employed the number of mobile phone subscribers per 100 people (M) as a measure of supporting information infrastructure (Weziak, 2007; Lin and Edvinsson, 2008; Lin and Edvinsson, 2013). The development of these complementary assets enables better communication and share of knowledge, thus enhancing the innovation process. For measuring the intellectual property (IP) development of a country, the patent applications are employed (P). On the macroeconomic level, the effectiveness of a country’s IP system is a determining factor in its economic performance (Sherwood, 1997). Globally, the technological competence of countries is increasingly being measured by their patent activity and R&D investments (Al-Ali, 2003). Hence, the higher amount of patent applications indicates higher technological ability of a country and greater possibilities for significant economic growth and development. Further, the unemployment rate as percentage of total population (UNE) has been used as a controlling macroeconomic indicator (Ståhle et al., 2015). If the unemployment rate in a country is high, then this high unemployment has negative impact on the economic growth and development.
As a dependent variable, the real Gross Domestic Product per capita in constant 2011 PPP $ (GDP) is used as the proxy indicator of economic development of a country.
Data used in this study are from the World Bank Development Indicators database covering the period from 2003 to 2015. The main hypothesis investigate whether national intellectual capital is an important determinant of the economic growth in SEE countries: Austria, Bulgaria, Croatia, Czech Republic, Greece, Hungary, Italy, Macedonia, Moldova, Poland, Romania, Serbia, Slovak Republic, Slovenia, and Ukraine (South East Europe, 2018). For the validation of this hypothesis the correlation and regression analysis were employed.
The primary objective of the correlation is to measure the strength of the linear association between two variables (Gujarati, 2004):
∑ − ∑ ∑
∑ − ∑ ∑ − ∑
Based on the value of the correlation coefficient r, the strength of the linear
association between two variables can be determined. If the value of r is close to +1, there exists a strong positive linear correlation, and if the value is close to -1, there exists a strong negative linear correlation. Values between 0.2 and 0.5 in both directions indicate a moderate correlation, while values below 0.2 indicate a low correlation between the analysed variables (Gupta, 1999).
Due to the fact that we have panel data before proceeding with the interpretation of the regression analysis results, it is necessary to decide which model the best describes the analysed data – The Pooled Regression Model (Pooled), the Fixed Effect Model (FEM) of the Random Effect Model (REM). Therefore, several tests were performed.
The F-test is used to test null hypothesis that Pooled model is better against the alternative hypothesis that FEM is better. If the test results indicate that we should accept null hypothesis, this means that there do not exist differences in regression constant across analysed countries (Jovičić and Dragutinović Mitrović, 2011). The Breusch-Pagan LM test is used to test the null hypothesis that Pooled model is better against the alternative hypothesis that REM is better. If the test results indicate the adequacy of Pooled model, this means that the error term does not contain significant individual effects (Jovičić and Dragutinović Mitrović, 2011). Finally, if the results of both previous tests show that either FEM or REM can be a good alternative for the analysed data, the ultimate decision about the model is based on the Hausman test, which tests the hull hypothesis that REM is better against the alternative hypothesis that FEM is better.
4. Empirical data and analysis
The countries included into analysis belong to the group of the SEE countries, and according to the World Bank classification regionally belong to the Europe and Central Asia. One part of the sample includes countries that have completed the transition process to the market economies, while other part of the sample consists of countries in which the transition process is near the end (Kovačević, 2017). Most of the countries in the sample are the EU member states (Austria, Bulgaria, Croatia, Czech Republic, Greece, Hungary, Italy, Poland, Romania, Slovak Republic and Slovenia), two of them are candidate countries, i.e. in the process of EU accession (Macedonia and Serbia), and the other two have signed the EU Association Agreement (Moldova and Ukraine).
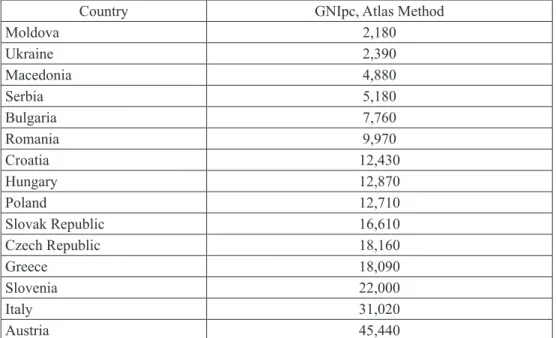
According to the data presented in Table 1 it is evident that two countries belong to the lower middle-income economies (with a GNI per capita between $996 and $3,895): Moldova and Ukraine; four to the upper middle-income economies (with a GNI per capita between $3,896 and $12,055): Macedonia, Serbia, Bulgaria and Romania; and nine to the high-income economies (with a GNI per capita of $12,056 or more): Croatia, Hungary, Poland, Slovak Republic, Czech Republic, Greece, Slovenia, Italy and Austria.
Table 1: Analysed countries according to the GNI per capita in 2017
– in US$
Country GNIpc, Atlas Method
Moldova 2,180 Ukraine 2,390 Macedonia 4,880 Serbia 5,180 Bulgaria 7,760 Romania 9,970 Croatia 12,430 Hungary 12,870 Poland 12,710 Slovak Republic 16,610 Czech Republic 18,160 Greece 18,090 Slovenia 22,000 Italy 31,020 Austria 45,440
In Table 2 the descriptive statistics are presented. The average value of GDP per capita in analysed countries is $21,185.57 (2011 PPP), and the minimum value of GDP per capita has Moldova in 2003 ($2,850.83), while the maximum value of GDP per capita has Austria in 2012 ($44,551.62). The average value of the enrolment rate of tertiary education (TE) is 60.14 percent and the minimum value of 27.16 percent is recorded in Macedonia in 2003, while maximum rate of 117.43 percent is recorded in Greece in 2014. The average patent application in the analysed countries is 1,287, while Macedonia recorded the least number of patent applications (only 27) in 2010, and the highest number of patent applications (9,255) was recorded in Italy in 2007.
The minimum value of the high-tech export of $7.8 million is achieved in Moldova in 2005, while the maximum level of the high-tech export of $31.2 billion is achieved in Italy in 2011. The average value of the high-tech export in the analysed countries was about $6.23 billion. The average number of R&D researchers per a million population is 1,892, while the minimum number of R&D researchers (433) is recorded in Macedonia in 2009 and the maximum number (4,955) is recorded in Austria in 2015. The minimum value of the R&D expenditures is 0.17 percent of GDP in Macedonia in 2007, while the maximum value of R&D expenditures is 3.07 percent of GDP in Austria in 2015. The mean value of the R&D expenditures is 0.96 percent indicating insufficient level of R&D investments in these countries. Table 2: Descriptive statistics
Variable Mean DeviationStandard Minimum Maximum
GDP 21,185.57 10,488.65 2,850.83 44,551.62 TE 60.14 17.14 27.16 117.43 P 1,287 1,899 27 9255 EXP 6,229,066,665 8,339,457,823 7,801,405 31,191,607,345 R 1,892.39 1,040.29 433.72 4,955.03 RD 0.96 0.64 0.17 3.07 M 106.76 31.07 11.41 162.7 UNE 11.52 7.44 3.69 37.25
Source: Authors’ calculations
The average number of mobile phone subscribers per 100 people is 106.76, while the minimum number of 11.41 is recorded in Moldova in 2003, and the maximum number of 162.7 is recorded in Italy in 2012. The lowest unemployment rate (3.69) is documented in Moldova in 2015, while the highest rate of 37.25 percent is recorded in Macedonia in 2005. The average unemployment rate in the analysed countries is 11.52 percent.
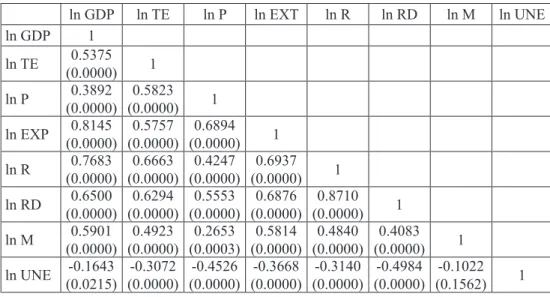
Table 3: Correlation analysis ln GDP ln TE ln P ln EXT ln R ln RD ln M ln UNE ln GDP 1 ln TE (0.0000)0.5375 1 ln P (0.0000)0.3892 (0.0000)0.5823 1 ln EXP (0.0000)0.8145 (0.0000)0.5757 (0.0000)0.6894 1 ln R (0.0000)0.7683 (0.0000)0.6663 (0.0000)0.4247 (0.0000)0.6937 1 ln RD (0.0000)0.6500 (0.0000)0.6294 (0.0000)0.5553 (0.0000)0.6876 (0.0000)0.8710 1 ln M (0.0000)0.5901 (0.0000)0.4923 (0.0003)0.2653 (0.0000)0.5814 (0.0000)0.4840 (0.0000)0.4083 1 ln UNE (0.0215)-0.1643 (0.0000)-0.3072 (0.0000)-0.4526 (0.0000)-0.3668 (0.0000)-0.3140 (0.0000)-0.4984 (0.1562)-0.1022 1
Note: p values are given in ( ) Source: Authors’ calculations
The results of correlation analysis are presented in Table 3. The correlation between GDP per capita and the enrolment rate of tertiary education (TE) is high, positive and statistically significant. As regards the patent application (P) this measure has positive, moderately statistically significant correlation with GDP per capita. The strongest positive, statistically significant relationship is determined between GDP per capita and high-technology export (EXP). The strong positive and statistically significant correlation exists between GDP per capita and number of R&D researchers (R), and as well as between GDP per capita and R&D expenditures (RD). A similar relationship exists between GDP per capita and number of mobile phone subscribers (M). On the other hand, the relationship between GDP per capita and unemployment rate is although statistically significant, low and negative. Followed by the results of correlation analysis, the test results for the appropriate regression model are presented in Table 4. Based on the obtained results it is determined that FEM is appropriate for fitting analysed data.
Table 4: Test results for choosing the appropriate model
F-test Breusch-Pagan LM Hausman
H0: Pooled, H1: FEM H0: Pooled, H1: REM H0: REM, H1: FEM
621.28
(0.0000) (0.0000)450.67 (0.0000)106.91
Note: p values are given in ( ) Source: Authors’ calculations
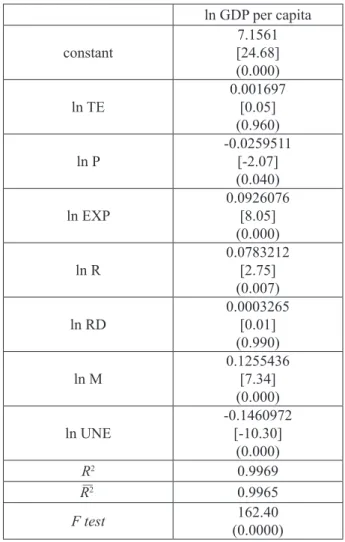
The results of the conducted regression analysis are presented in Table 5. The estimated model explains 99.69 percent change in GDP per capita and this model is statistically significant as confirmed by the F test (p<0.0000).
Table 5: Regression results
ln GDP per capita constant [24.68]7.1561 (0.000) ln TE 0.001697[0.05] (0.960) ln P -0.0259511[-2.07] (0.040) ln EXP 0.0926076[8.05] (0.000) ln R 0.0783212[2.75] (0.007) ln RD 0.0003265[0.01] (0.990) ln M 0.1255436[7.34] (0.000) ln UNE -0.1460972[-10.30] (0.000) R2 0.9969 – R2 0.9965 F test (0.0000)162.40
Note: t statistics are given in [ ], p values are given in ( ) Source: Authors’ calculations
Some of the indicators in the model are not statistically significant in explaining the changes in GDP per capita in the analysed countries. This is the case with the gross enrolment rate in tertiary education (TE). If the gross enrolment rate in tertiary education increases by 1 percent, the GDP per capita is expected to increase by 0.0017 percent, holding all other variables constant. However, this variable is not statistically significant. A similar situation is with the R&D expenditures as
percentage of GDP. If the R&D expenditures as percentage of GDP increase by 1 percent, the GDP per capita is expected to increase by 0.0003 percent, ceteris paribus. But, this variable is statistically insignificant for explaining GDP per capita. As regards patent application the results are different from expected. If the patent applications increases by 1 percent the GDP per capita is expected to decrease by 0.026 percent, ceteris paribus.
All other variables are statistically significant in explaining changes in the GDP per capita. If the high-technology export increases by 1% the GDP per capita will increase by 0.092%, holding all other variables constant. Percentage increase in the number of R&D researches will lead to the increase of GDP per capita by 0.078%, ceteris paribus. If the mobile phone subscribers increase by 1% the GDP per capita will increase by 0.13%, ceteris paribus. The increase of unemployment rate of 1% will lead to the decrease of GDP per capita of 0.15%, holding all other variables constant.
5. Results and discussion
Our research, based on a sample of 15 Southeast European countries, has shown that increase in high-technology export, number of R&D researchers and mobile phone subscribers have a positive and significant impact on economic growth. The information and communication technologies are important for acquiring and dissemination of knowledge, as the key phase of intellectual capital management. “Mobile phones improve the use of information, encourage access to information, reduce research costs and enhance market efficiency, thereby increasing economic growth” (Majeed and Ayub, 2018: 452). In the analysed countries the information and communication infrastructure has a positive impact on the economic growth. Therefore, the part of the macroeconomic policy measures should be directed toward further development of the information and communication infrastructure. These measures are especially important for the countries on the way to become digital economies.
The number of R&D researchers and the high-technology export has a positive impact on the economic growth in the analysed countries. The importance of high-tehnology export in explaining economic growth is in line with the research results obtained by Falk (2009), while the importance of R&D researchers for the economic growth is in line with the results by Bayarçelik and Taşel (2012). Therefore, the countries should consider engaging R&D researchers in the projects with the aim to develop new technology and products that can be exported to other countries, thus contributing to the future economic development. In order to support the activities of these researchers, governments should establish special funds for their financing. The industry and the wider community should also make contributions to these
funds. These collaborations can significantly contribute to the development of the high-technology products and services and their exports in the future. The focus on these channels is important for the further development of the analysed countries. However, results regarding patent applications are different from expected; the increase in the number of patent applications has caused a decrease of GDP per capita. These results are in line with the results obtained by Bayarçelik and Taşel (2012). The possible explanation for such results can be found in the insufficient usage of the registered patents, as well as in high costs of patent protection. Similarly, Bayarçelik and Taşel (2012) point to the sunk costs, in terms of varios fees which make patenting costly in the short-run, as possible explanation for the negative relationship. Therefore, countries should focus on the appropriate implementation of the patents in order to increase the potential benefits of their usage. Hence, macroeconomic policies should be directed towards the increased cooperation between R&D institutions and industry with a special emphasis on the foundation of high-tech incubators and science parks. Additionally, countries could benefit from patents by selling the patent rights for those patents that do not plan to implement in the specific industry. Further, countries should consider making some of the patents available to public in order to achieve spillover effects and obtain the application of these patents by entities which do not have R&D capacity, but are willing to develop products and technologies based on patents.
It is necessary to acknowledge the strategic importance of intellectual capital for future economic development. In that regard, it is important to develop modern and propulsive production sectors and services that would be the engine of future development and competitiveness. Hence, the development policies should be focused on the enhancement of business environment and support of knowledge and innovations. In this process, a significant role belongs to the mapping of intellectual resources, in order to determine the portfolio of intellectual resources that country possesses and to work continuously on its enhancement.
Special attention should be given to intensified cooperation between business community and institutes and universities in order to achieve synergetic effects in generating and utilising innovation potential. Development strategies should be based on the mobilisation of intellectual resources and the alignment of R&D activities and innovation capacities with the needs of an economy.
The management of national intellectual capital, among other things, should focus on: the wide spectrum of immaterial values and determinants within national economy that have influence on the growth and development of national intellectual capital; the maximum possible effects in usage of intellectual potential of a country; the increase in the economy efficiency resulting in the augmented value of GDP per capita and competitiveness. The efficient management of national intellectual capital should contribute to the increased economic welfare, improved image of
a country, and enable accomplishment of economic, social and political aims and interests in the international environment.
6. Conclusion
The production, dissemination, and use of knowledge have become crucial factors for enhancing competitiveness, job creation and welfare. Due to these reasons, the most developed economies increase investments in intellectual capital and become knowledge-based economies. The transition of most developed nations to knowledge-based economies has resulted in an increasing awareness of national intellectual capital as a key factor for the economic growth and performance. Nevertheless, studies regarding the contribution of national intellectual capital to the economic growth in developing countries are not vast. Thus, the main objective of the paper was to identify the contribution of the key intellectual capital determinants to the economic growth and development in the SEE countries. The indicators for the study were chosen based on the three phases of the intellectual capital management, according to Al-Ali (2003): knowledge management, innovation management and intellectual property management. For measuring knowledge, the gross enrolment ratio of tertiary education was used (TE). For measuring innovation capital following indicators were employed: the research and development expenditures as percentage of GDP (RD), the number of researchers in the R&D per million people (R) and the high-technology export (EXP). For measuring the intellectual property development of a country we employed the indicator of the patent applications (P). Additionally, the number of mobile phone subscribers per 100 people (M), as a measure of supporting information infrastructure, and the unemployment rate as percentage of total population (UNE), as a controlling macroeconomic indicator, were used. Based on all the above obtained results the defined hypothesis was confirmed, suggesting that national intellectual capital is an important determinant of the economic growth in the analysed SEE countries. Hence, it can be concluded that intellectual capital is extremely important for economic growth. Previous studies have shown that large investments in intellectual capital have contributed to a higher rate of economic growth in the most developed economies. The results of this study have filled the gap in the literature regarding the contribution of intellectual capital to the economic growth in the SEE countries. Due to the fact that only several indicators regarding intellectual capital were used, it would be encouraging to perform additional investigations by involving a greater number of indicators for each segment of national intellectual capital. Additionally, some considerations should be given to the chosen indicators for the three dimensions of intellectual capital, since this can be viewed as a main limitation of the paper. Namely, there is no unique position in the literature regarding individual indicators of intellectual capital components, but the choice of indicators is rather based on the subjective judgement of the
researchers. Therefore, it would be inspiring for further research to employ some other measures of the intellectual capital components. This would be especially challenging for the knowledge measurement, since the employed measure – the gross enrolment ratio of tertiary education, was statistically insignificant. Further research should consider employing the literacy rate or number of graduate students, as better proxies for the level of knowledge, or even some qualitative measure, such as the level of quality of higher education institutions in a specific country. Nonetheless, these limitations do not diminish the importance of the paper and obtained results, but rather point towards the possibilities for future research and improvement.
References
Al-Ali, N. (2003) Comprehensive Intellectual Capital Management: Step-by-Step,
Hoboken: John Wiley & Sons, Inc.
An, Y. (2015) Reporting of Intellectual Capital Information: Evidence from a
Developing Country, Saarbrücken: Scholar’s Press.
Baldacci, E. et al. (2008) “Social Spending, Human Capital, and Growth in
Developing Countries”, World Development, Vol. 36, No. 8, pp. 1317–1341,
doi: 10.1016/j.worlddev.2007.08.003.
Bayarçelik, E. B., Taşel, F. (2012) “Research and Development: Source of Economic
Growth”, Procedia – Social and Behavioral Sciences, Vol. 58, pp. 744–753,
doi: 10.1016/j.sbspro.2012.09.1052.
Bokana, K. G., Akinola, G. W. (2017) “Productivity effects of higher education
human capital in selected countries of Sub-Saharan Africa”, Zbornik radova
Ekonomskog fakulteta u Rijeci: časopis za ekonomsku teoriju i praksu/ Proceedings of Rijeka Faculty of Economics: Journal of Economics and Business, Vol. 35, No. 1, pp. 173–198, doi: 10.18045/zbefri.2017.1.173.
Bontis, N. (1998) “Intellectual Capital: An Exploratory Study that Develops
Measures and Models”, Management Decision, Vol. 36, No. 2, pp. 63–76, doi:
10.1108/00251749810204142.
Bontis, N. (2004) “National Intellectual Capital: A United Nations Initiative for the
Arab Region”, Journal of Intellectual Capital, Vol. 5, No. 1, pp. 13–39, doi:
10.1108/14691930410512905.
Bounfour, A. (2003) The Management of Intangibles, London: Routledge.
Bradley, K. (1997a) “Intellectual Capital and the New Wealth of Nations”, Business Strategy Review, Vol. 8, No. 1, pp. 53–62, doi: 10.1111/1467-8616.00007. Bradley, K. (1997b) “Intellectual Capital and the New Wealth of Nations II”,
Business Strategy Review, Vol. 8, No. 4, pp. 33–44, doi: 10.1111/1467-8616.
Brooking, A. (1998) Intellectual Capital: Core Assets for the Third Millennium Enterprise, London: International Thomson Business Press.
Chen, D., Dahlman, C. (2006) The Knowledge Economy, the KAM Methodology
and World Bank Operations, Washington: The World Bank Institute.
Choi, Y.-C., Lee, J.-H. (2015) “What Most Matters in Strengthening Educational
Competitiveness?: An Application of FS/QCA Method”, Procedia - Social and
Behavioral Sciences, Vol. 197, pp. 2182–2190, doi: 10.1016/j.sbspro.2015.
07.354.
Cohen, D., Soto, M. (2007) “Growth and Human Capital: Good Data, Good
Results”, Journal of Economic Growth, Vol. 12, No. 1, pp. 51–76, doi: 10.1007/
s10887-007-9011-5.
Dorinela, N. (2015) “The Knowledge Assessment Methodology of Countries”, Ovidius University Annals, Economic Sciences Series, Volume XV, Issue 2, pp. 156–159.
Dragonescu, M. R. (2015) “Education as a Determinant of the Economic Growth.
The Case of Romania”, Procedia – Social and Behavioral Sciences, Vol. 197,
pp. 404–412, doi: 10.1016/j.sbspro.2015.07.156.
Ercis, A., Ünalan, M. (2016) “Innovation: A comparative case study of Turkey and
South Korea”, Procedia – Social and Behavioral Sciences, Vol. 235, pp. 701–
708, doi: 10.1016/j.sbspro.2016.11.071.
Falk, M. (2009) “High-tech exports and economic growth in industrialized
countries”, Applied Economics Letters, Vol. 16, Issue 10, pp. 1025–1028, doi:
10.1080/13504850701222228.
Franco, C., Henrique de Oliveira, R. (2017) “Inputs and outputs of innovation: analysis of the BRICS: Theme 6 – innovation technology and competitiveness”, Revista de Administração e Inovação, Vol. 14, Issue 1, pp. 79–89, doi: 10.1016/ j.rai.2016.10.001.
Gujarati, D. N. (2004) Basic Econometrics, 4th ed. Boston: The McGraw-Hill
Companies.
Gupta, V. (1999) SPSS for Beginners, s.l.: VJBooks Inc.
Hervas‐Oliver, J. L., Dalmau‐Porta, J. I. (2007) “Which IC Components Explain
National IC Stocks?“, Journal of Intellectual Capital, Vol. 8, No. 3, pp. 444–
469, doi: 10.1108/14691930710774867.
Jankowska, B., Matysek-Jędrych, A., Mroczek-Dąbrowska, K. (2017) “Efficiency of National Innovation Systems – Poland and Bulgaria in The Context of the
Global Innovation Index”, Comparative Economic Research, Vol. 20, No. 3, pp.
77–94, doi: 10.1515/cer-2017-0021.
Jovičić, M., Dragutinović Mitrović, R. (2011) Ekonometrijski metodi i modeli,
Beograd: Univerzitet u Beogradu, Ekonomski fakultet, Centar za izdavačku delatnost.
Käpylä, J., Kujansivu, P., Lönnqvist, A. (2012) “National Intellectual Capital
Performance: A Strategic Approach”, Journal of Intellectual Capital, Vol. 13,
No. 3, pp. 343–362, doi: 10.1108/14691931211248909.
Kostoska, O., Hristoski, I. (2017) “ICTs and innovation for competitiveness:
Evidence for Western Balkans vis-à-vis the European Union”, Zbornik radova
Ekonomskog fakulteta u Rijeci: časopis za ekonomsku teoriju i praksu/ Proceedings of Rijeka Faculty of Economics: Journal of Economics and Business, Vol. 35, No. 2, pp. 487–518, doi: 10.18045/zbefri.2017.2.487.
Kotnik, P., Hagsten, E. (2018) “ICT use as a determinant of export activity in
manufacturing and service firms: Multi-country evidence”, Zbornik radova
Ekonomskog fakulteta u Rijeci: časopis za ekonomsku teoriju i praksu/ Proceedings of Rijeka Faculty of Economics: Journal of Economics and Business, Vol. 36, No. 1, pp. 103–128, doi: 10.18045/zbefri.2018.1.103.
Kovačević, R. (2017) “Current Account determinants in Southeast European (SEE)
countries – panel approach”, Zbornik radova Ekonomskog fakulteta u Rijeci:
časopis za ekonomsku teoriju i praksu/Proceedings of Rijeka Faculty of Economics: Journal of Economics and Business, Vol. 35, No. 2, pp. 391–424, doi: 10.18045/zbefri.2017.2.391.
Krstić, B. (2014) Upravljanje intelektualnim kapitalom preduzeća, Niš: Ekonomski
fakultet.
Lin, C. Y.-Y., Edvinsson, L. (2008) “National intellectual capital: comparison of the
Nordic countries”, Journal of Intellectual Capital, Vol. 9, No. 4, pp. 525–545,
doi: 10.1108/14691930810913140.
Lin, C. Y.-Y., Edvinsson, L. (2013) “National Intellectual Capital in Israel and
Financial Crisis Impact”, International Journal of Knowledge-Based
Development, Vol. 4, No. 3, pp. 245–273, doi: 10.1504/IJKBD.2013.055872.
Lucas, R. E. (1988) “On the Mechanics of Economic Development”, Journal of
Mo-netary Economics, Vol. 22, No. 1, pp. 3–42, doi: 10.1016/0304-3932(88)90168-7. Majeed, M. T., Ayub, T. (2018) “Information and Communication Technology
(ICT) and Economic Growth Nexus: A Comparative Global Analysis”, Pakistan Journal of Commerce and Social Sciences, Vol. 12, No. 2, pp. 443–476.
Mehrara, M., Seijani, S., Karsalari, A. (2017) “Determinants of high-tech export in
developing countries based on Bayesian model averaging”, Zbornik radova
Ekonomskog fakulteta u Rijeci: časopis za ekonomsku teoriju i praksu/ Proceedings of Rijeka Faculty of Economics: Journal of Economics and Business, Vol. 35, No. 1, pp. 199–215, doi: 10.18045/zbefri.2017.1.199.
Mercan, M., Sezer, S. (2014) “The Effect of Education Expenditure on Economic
Growth: The Case of Turkey”, Procedia - Social and Behavioral Sciences, Vol.
109, pp. 925–930, doi: 10.1016/j.sbspro.2013.12.565.
Neycheva, M. (2010) “Does Public Expenditure on Education Matter for Growth in Europe? A Comparison between Old EU Member States and Post-Communist
Economies”, Post-Communist Economies, Vol. 22, No. 2, pp. 141–164, doi: 10.1080/14631371003740597.
Pelinescu, E. (2015) “The Impact of Human Capital on Economic Growth”, Procedia Economics and Finance, Vol. 22, pp. 184–190, doi: 10.1016/S2212-5671(15)00258-0.
Pilinkiene, V. (2015) “R&D investment and competitiveness in the Baltic States”, Procedia – Social and Behavioral Sciences, Vol. 213, pp. 154–160, doi: 10.1016/j.sbspro.2015.11.419.
Plummer, P., Tonts, M., Martinus, K. (2014) “Endogenous Growth, Local Competitiveness and Regional Development: Western Australia’s Regional Cities,
2001-2011”, Journal of Economic and Social Policy, Vol. 16, No. 1, pp. 1–29.
Radosevic, S. (2015) “Research and Development, Competitiveness and European
Integration of South Eastern Europe”, Europe-Asia studies, Vol. 61, No. 4, June
2009, pp. 621–650, doi: 10.1080/09668130902826212.
Romer, P. M. (1986) “Increasing Returns and Long-Run Growth”, Journal of
Political Economy, Vol. 94, No. 5, pp. 1002–1037.
Sekuloska, J. D. (2014) “Higher Education and Training as Crucial Pillars in
Creating the Competitiveness of Nation”, Procedia - Social and Behavioral
Sciences, Vol. 156, pp. 241–246, doi: 10.1016/j.sbspro.2014.11.182.
Seleim, A., Bontis, N. (2013) “National Intellectual Capital and Economic
Performance: Empirical Evidence from Developing Countries”, Knowledge and
Process Management, Vol. 20, No. 3, pp. 131–140, doi: 10.1002/kpm.1412. Sherwood, R. (1997) “Intellectual Property Systems and Investment Stimulation”,
IDEA: The Journal of Law & Technology, Vol. 37, No. 2, pp. 261–370.
South East Europe (2018), South East Europe Transnational Cooperation Programme, http://www.southeast-europe.net/en/about_see/participating_countries/
Ståhle, P., Ståhle, S. (2006) “Intellectual Capital and National competitiveness:
Conceptual and methodological challenges”, in Bounfour, A. ed., Capital
Immateriel, Connaisance et performance, pp. 415–430, Paris: L’Harmattan. Ståhle, P., Ståhle, S., Lin, C. Y. Y. (2015) “Intangibles and national economic wealth
– a new perspective on how they are linked”, Journal of Intellectual Capital,
Vol. 16, No. 1, pp. 20–57, doi: 10.1108/JIC-02-2014-0017.
Stewart, T. A. (2001) The Wealth of Knowledge - Intellectual Capital and the
Twenty-First Century Organization, New York: Currency.
Suri, T. et al. (2011) “Paths to Success: The Relationship between Human
Development and Economic Growth”, World Development, Vol. 39, No. 4, pp.
506–522, doi: 10.1016/j.worlddev.2010.08.020.
Užienė, L. (2014) “National Intellectual Capital as an Indicator of the Wealth of
Nations: The Case of the Baltic States”, Procedia - Social and Behavioral
Viedma Marti, J. M., Cabrita, M. R. (2012) Entrepreneurial Excellence in the Knowledge Economy: Intellectual Capital Benchmarking Systems. Basingstoke: Palgrave Macmillan.
Weziak, D. (2007) “Measurement of National Intellectual Capital: Application to
EU Countries” (IRISS Working Papers 2007-13), Differdange, Luxembourg:
CEPS/INSTEAD.
Zwolak, J. (2016) “Innovative undertakings in the Polish industry”, Zbornik radova
Ekonomskog fakulteta u Rijeci: časopis za ekonomsku teoriju i praksu/ Proceedings of Rijeka Faculty of Economics: Journal of Economics and Business, Vol. 34, No. 1, pp. 147–160, doi: 10.18045/zbefri.2016.1.147.
Utjecaj nacionalnog intelektualnog kapitala na gospodarski rast u zemljama
jugoistočne Europe
Tatjana Stevanović1, Maja Ivanović-Đukić2, Tamara Rađenović3, Ognjen Radović4
Sažetak
U suvremenim okolnostima, intelektualni kapital postao je pokretač ekonomskog, društvenog i kulturnog razvoja. Mobilizacija i korištenje intelektualnih resursa u poduzećima stvaraju vrijednost, čime se transformira i ubrzava razvoj nacionalnih ekonomija prema gospodarstvima temeljenim na znanju i inovacijama. Upravo iz tih razloga, najrazvijenija gospodarstva povećavaju ulaganja u obrazovanje, informacijske tehnologije i potiču inovativnost. S druge strane, manje razvijene zemlje nemaju mogućnosti za značajna ulaganja u stvaranje i zapošljavanje nacionalnog intelektualnog potencijala. To se ogleda u njihovim stopama gospodarskog rasta, kao u slučaju zemalja jugoistočne Europe (SEE). Stoga se u radu utjecaji obrazovanja, informacijskih tehnologija i inovacija istražuju kao odrednice nacionalnog razvoja intelektualnog kapitala na gospodarski rast zemalja JIE. Cilj ovog rada je utvrditi doprinos ključnih determinanta intelektualnog kapitala gospodarskom rastu i razvoju zemalja jugoistočne Europe i predložiti mjere čija provedba dovodi do daljnjeg razvoja prema gospodarstvima znanja i inovacija. Rezultati analize korelacije pokazali su pozitivnu i statistički značajnu korelaciju između BDP-a po stanovniku i primijenjenih mjera nacionalnog intelektualnog kapitala. Istraživanje je pokazalo da povećanje izvoza visoke tehnologije, porast broja istraživača za istraživanje i razvoj i broja pretplatnika mobilnih telefona imaju pozitivan i značajan utjecaj na gospodarski rast. Autori savjetuju pojačanu suradnju između poslovne zajednice, instituta i sveučilišta kako bi se postigli sinergijski učinci u stvaranju i korištenju nacionalnog intelektualnog potencijala.
Ključne riječi: intelektualni kapital, inovacija, informacijska tehnologija, ekonomski rast, mjerenje uspješnosti
JEL klasifikacija: I25, M40, O32, O34
1 Izvanredni profesor, Sveučilište u Nišu, Ekonomski fakultet, Trg kralja Aleksandra Ujedinitelja
11, 18000 Niš, Srbija. Znanstveni interes: računovodstvo, financije. Tel.: +381 18 528 666. E-mail: tatjana.stevanovic@eknfak.ni.ac.rs.
2 Izvanredni profesor, Sveučilište u Nišu, Ekonomski fakultet, Trg kralja Aleksandra Ujedinitelja
11, 18000 Niš, Srbija. Znanstveni interes: menadžment, financije. Tel.: +381 18 528 659. E-mail: maja.ivanovic@eknfak.ni.ac.rs.
3 Istraživač, Sveučilište u Nišu, Ekonomski fakultet, Trg kralja Aleksandra Ujedinitelja 11,
18000 Niš, Srbija. Znanstveni interes: makroekonomija, intelektualni kapital. Tel..: +381 18 528 659. E-mail: tamara.radjenovic@eknfak.ni.ac.rs.
4 Izvanredni profesor, Sveučilište u Nišu, Ekonomski fakultet, Trg kralja Aleksandra Ujedinitelja
11, 18000 Niš, Srbija. Znanstveni interes: informatika, financije. Tel.: +381 18 528 653. E-mail: ognjen.radovic@eknfak.ni.ac.rs.