PhD’s
Dissertation
201
7
Sustainability
A
nalysis of Alternative Fuel
Vehicles by using
Life Cycle
Assessment
a
nd Optimisation
Kamila Romejko
Supervisor
Masaru Nakano
September 20
17
Graduate S
chool of System Design and Management,
Keio University
SUMMARY OF
DOCTOR
AL
’
S
DISSERTATION
NameKamila Romejko
Title
Sustainability
A
nalysis of Alternative Fuel
Vehicles by using
Life Cycle Assessment
and
Optimis
ation
Abstract
In recent years, there has been an increasing interest in alternative fuel vehicles (AFVs), such as electric vehicles (EVs), fuel cell vehicles (FCVs) and compressed natural gas (CNG) vehicles, as a promising option for mitigating global warming and reducing energy consumption. Most studies in this area have been conducted on only a few types of powertrains, e.g. EVs and gasoline vehicles; to fill this gap, this study will cover FCVs, CNGs, hybrid electric vehicles, diesel hybrid electric vehicles and liquefied petroleum gas (LPG) vehicles. Moreover, most of the papers focus on the use phase of those vehicles and disregard the manufacturing part, which is energy and emission intensive. The indirect effects of emissions production include severe health problems such as chronic asthma or even mortality. Automakers and policy makers need to investigate the lifecycle emissions of vehicles in different regions. It is crucial to decide if governments should invite EV production into their country, or whether it would be more appropriate to import vehicles. This research is novel because it includes energy security aspects, uses multiple scenario analysis, and investigates FCVs and various stages of AFV’s lifecycle in different regions. The objective of the thesis is to systematically assess the sustainability of AFVs. Firstly, the economic pillar of sustainability is being investigated by carrying out optimisation. The optimal AFV portfolio, based
on different scenarios to sustain energy security in light of gas and petroleum restrictions until 2030, is being calculated. The Polish market is considered as a case for demonstrating the optimal model. Secondly, environmental and social pillar of sustainability is explored. Life cycle assessment (LCA) has been applied to this research in order to quantify greenhouse gas (GHG) and non-GHG emissions and health impacts of air pollution connected with AFVs. We assessed air pollution from vehicles in Japan, China, and the United Kingdom (UK) and additionally health impact for Poland.
This research help automakers and policymakers recognise investment possibilities and it provides numerical findings for multiple stakeholders such as governments, energy, and automotive companies. The findings from scenario analysis can be used to create government policies and proposals, which was already studied in conventional studies. The results from LCA are crucial for strategic decision making on investment in EVs.
Chapter 1 presents the background and subject of the research, previous studies deliverables, originality, motivation, and objective of the study. In Chapter 2 methods of the thesis are briefly described. Chapter 3 provides qualitative analysis of AFV and insights into automotive industry and energy sectors of the case studied country. The results from interviews suggest that environmental issues are neglected in Poland; the price of the vehicle is the most important reason influencing the purchase. Moreover, the introduction of incentive system for AFVs for both companies and private entities might spur the sales of the cars again.
Chapter 4 elucidates the optimization model, and constraints, variables, and results for vehicle portfolio analysis. The results indicate that it is crucial to introduce all types of powertrains to achieve both economic and energy security objectives. The projected diffusion of FCVs will be more pronounced than that in previous studies, owing to the expected rapid decline in the cost of
both infrastructure and purchase price of cars.
Case study for shale gas revolution and vehicle portfolio analysis is illustrated in Chapter 5. The results of this study suggest that due to shale gas revolution and decrease of gas prices, the portfolio of AFVs improves. Moreover, the results show that increased use of shale gas engenders the high consumption of water. Even though shale gas might improve the AFV portfolio the drawbacks of high water consumption and safety threads might hinder the positive aspects of implementing it in a long run. Water safety measures such as water recycling, reusing and disposal; technology choice; establishing the plants in low-density areas; are crucial while considering investment in shale gas.
Chapter 6 explains the LCA method, scenarios, and data used in the calculations for two case scenarios. Government and automotive companies can use created a model to make crucial decisions while setting up the location of the production plant. The results of the LCA simulations are provided in Chapter 7. Results for the LCA: GHG and non-GHG emissions indicate that EVs do not necessarily decrease pollutant emissions. Only in the UK the environmental cost of GHG and non-GHG emissions for EVs is lower than for GVs. EVs are more environmentally intensive than GVs. The substantial difference between those two is attributed to battery manufacturing EVs produce less CO2 during use phase, but other emissions are still high. However, a high decrease of the cost is projected in the Technological Advancement Scenario, especially for China. The results of the second case study LCA: Health effects imply that the total cost of health issues is lower when import of EVs is from the nearby countries, which generate electricity from clean energy resources or when it is produced in a low emission country locally. Surprisingly, maritime transportation accounts for a substantial portion of the total emissions, because ships use diesel oil. That is why one of the recommendations is to switch from diesel oil ferries to LNG ships. Moreover, in 2025, the monetary cost of health diseases drops dramatically due to significant
technology improvements such as increases in energy efficiency and production, increase in the share of renewable sources in the electricity mix, stricter air emission standards. Finally, conclusions and limitation of the study are presented in Chapter 8.
Key Word(5 words)
Sustainability analysis of Alternative Fuel
Vehicles by using Life Cycle Assessment
and Optimisation.
Kamila Romejko
THE GRADUATE SCHOOL OF SYSTEM DESIGN AND MANAGEMENT, KEIO UNIVERSITY KYOSEI BUILDING, 4-1-1, HIYOSHI, KOHOKU-KU, YOKOHAMA, KANAGAWA, 223-8526, JAPAN
Abstract
In recent years, there has been an increasing interest in alternative fuel vehicles (AFVs), such as electric vehicles (EVs), fuel cell vehicles (FCVs) and compressed natural gas (CNG) vehicles, as a promising option for mitigating global warming and reducing energy consumption. Most studies in this area have been conducted on only a few types of powertrains, e.g. EVs and gasoline vehicles; to fill this gap, this study will cover FCVs, CNGs, hybrid electric vehicles, diesel hybrid electric vehicles and liquefied petroleum gas (LPG) vehicles. Moreover, most of the papers focus on the use phase of those vehicles and disregard the manufacturing part, which is energy and emission intensive. The indirect effects of emissions production include severe health problems such as chronic asthma or even mortality. Automakers and policy makers need to investigate the lifecycle emissions of vehicles in different regions. It is crucial to decide if governments should invite EV production into their country, or whether it would be more appropriate to import vehicles. This research is novel because it includes energy security aspects, uses multiple scenario analysis, and investigates FCVs and various stages of AFV’s lifecycle in different regions. The objective of the thesis is to systematically assess the sustainability of AFVs. Firstly, the economic pillar of sustainability is being investigated by carrying out optimisation. The optimal AFV portfolio, based on different scenarios to sustain energy security in light of gas and petroleum restrictions until 2030, is being calculated. The Polish market is considered as a case for demonstrating the optimal model. Secondly, environmental and social pillar of sustainability is explored. Life cycle assessment (LCA) has been applied to this research in order to quantify greenhouse gas (GHG) and non-GHG emissions and health impacts of air pollution connected with AFVs. We assessed air pollution from vehicles in Japan, China, and the United Kingdom (UK) and additionally health impact for Poland.
This research help automakers and policymakers recognise investment possibilities and it provides numerical findings for multiple stakeholders such as governments, energy, and automotive companies. The findings from scenario analysis can be used to create government policies and proposals, which was already studied in conventional studies. The results from LCA are crucial for strategic decision making on investment in EVs.
Chapter 1 presents the background and subject of the research, previous studies deliverables, originality, motivation, and objective of the study. In Chapter 2 methods of the thesis are briefly described. Chapter 3 provides qualitative analysis of AFV and insights into automotive industry and energy sectors of the case studied country. The results from interviews suggest that environmental issues are neglected in Poland; the price of the vehicle is the most important reason influencing the purchase. Moreover, the introduction of incentive system for AFVs for both companies and private entities might spur the sales of the cars again.
Chapter 4 elucidates the optimization model, and constraints, variables, and results for vehicle portfolio analysis. The results indicate that it is crucial to introduce all types of powertrains to achieve both economic and energy security objectives. The projected diffusion of FCVs will be more pronounced than that in previous studies, owing to the expected rapid decline in the cost of both infrastructure and purchase price of cars.
Case study for shale gas revolution and vehicle portfolio analysis is illustrated in Chapter 5. The results of this study suggest that due to shale gas revolution and decrease of gas prices, the portfolio of AFVs improves. Moreover, the results show that increased use of shale gas engenders the high consumption of water. Even though shale gas might improve the AFV portfolio the drawbacks of high water consumption and safety threads might hinder the positive aspects of implementing it in a long run. Water safety measures such as water
recycling, reusing and disposal; technology choice; establishing the plants in low-density areas; are crucial while considering investment in shale gas.
Chapter 6 explains the LCA method, scenarios, and data used in the calculations for two case scenarios. Government and automotive companies can use created a model to make crucial decisions while setting up the location of the production plant. The results of the LCA simulations are provided in Chapter 7. Results for the LCA: GHG and non-GHG emissions indicate that EVs do not necessarily decrease pollutant emissions. Only in the UK the environmental cost of GHG and non-GHG emissions for EVs is lower than for GVs. EVs are more environmentally intensive than GVs. The substantial difference between those two is attributed to battery manufacturing EVs produce less CO2 during use phase, but other emissions are still high. However, a high decrease of the cost is projected in the Technological Advancement Scenario, especially for China. The results of the second case study LCA: Health effects imply that the total cost of health issues is lower when import of EVs is from the nearby countries, which generate electricity from clean energy resources or when it is produced in a low emission country locally. Surprisingly, maritime transportation accounts for a substantial portion of the total emissions, because ships use diesel oil. That is why one of the recommendations is to switch from diesel oil ferries to LNG ships. Moreover, in 2025, the monetary cost of health diseases drops dramatically due to significant technology improvements such as increases in energy efficiency and production, increase in the share of renewable sources in the electricity mix, stricter air emission standards. Finally, conclusions and limitation of the study are presented in Chapter 8.
Table of contents
Abstract ... 7 Table of contents ... 10 Index of figures ... 14 Index of tables ... 16 Abbreviations ... 19 1. Introduction ... 21 1.1. Research background ... 211.2. Literature review, motivation and research objectives ... 25
1.3. Structure of research ... 28
1.4. Published papers ... 30
2. Methods ... 32
2.1. Qualitative analysis ... 32
2.2. Optimisation ... 32
2.3. Life Cycle Assessment ... 34
3. Qualitative analysis ... 38
3.1. Chapter introduction ... 38
3.2. Methodology ... 40
3.3. Stakeholder analysis, interviews, statistical and literature analysis ... 41
3.3.1. Stakeholder analysis ... 41
3.3.2. Results of interviews ... 42
3.3.2. Statistical, literature analysis and discussions ... 45
3.4. Summary ... 56
4.1. Chapter introduction ... 58
4.2. Methods ... 63
4.2.1. Model ... 63
4.2. Data, variables and preconditions ... 68
4.2.1. Vehicle type (j) ... 68
4.2.2. Volume of new vehicle registrations (xjk) ... 69
4.2.3. Number of possessions (Sjk) ... 70
4.2.4. Average tenure of use (Uj) ... 71
4.2.5. Fuel consumption ... 71
4.2.6. Vehicle price (Vjkb) ... 72
4.2.7. Energy price (Eikb) ... 75
4.2.8. Infrastructure cost (Tj) ... 79
4.2.9. Power demand composition ... 80
4.2.9. Annual average mileage (Aj) ... 81
4.2.10. Setup of restriction values (D, H) ... 82
4.4. Simulation results with Optimisation ... 82
4.4.1 Total vehicle fleet ... 82
4.4.2 Passenger vehicles ... 84
4.4.3 Lorries ... 86
4.4.4 Buses ... 87
4.4.5 Discussions and summary ... 88
5. Vehicle Portfolio Analysis and Life Cycle Assessment with Shale Gas Revolution ... 91
5.1. Chapter introduction ... 91
5.2. Methods ... 93
5.2.1. Model ... 93
5.3. Simulation Results with Optimisation and Life Cycle Assessment ... 98
5.3.1 Vehicle portfolio ... 98
5.3.2 Water usage ... 101
5.3. Summary and discussion ... 102
6. Model for air emissions by Life Cycle Assessment ... 104
6.1. Chapter introduction ... 104
6.2. LCA model ... 109
6.2.1 Case study 1: GHG and non-GHG emissions ... 112
6.2.2 Case study 2: Health impact of air pollution ... 114
6.3. Vehicle assumptions and data analysis ... 117
6.3.1 Basic vehicle assumptions ... 117
6.3.2. Electric mix and emission cost ... 118
6.3.3. Manufacturing ... 122
6.3.4. Use phase ... 123
6.3.5. End of life ... 127
6.3.6. Transport ... 128
6.3. Summary ... 128
7. Simulation results with LCA Model ... 130
7.1. Case 1 with environmental issues ... 130
7.1.1. Life cycle assessment for vehicles produced in 2016 ... 130
7.1.2. Life cycle assessment for vehicles produced in 2025 ... 136
7.1.3. Total cost of emissions ... 140
7.2. Case 2 with social issues ... 140
7.3 Discussions and summary ... 145
8.1. Key findings and recommendations ... 149
8.2. Contributions ... 153
8.3. Limitations and further work ... 154
Acknowledgments ... 156
Index of figures
Figure 1 Number of HEV cars sold in Poland between 2007-2012. ... 21
Figure 2 Research problem outline ... 24
Figure 3 Research structure ... 29
Figure 4 Optimisation model outline ... 33
Figure 5 Optimisation model outline ... 34
Figure 6 Outline of the LCA. ... 36
Figure 7 Outline of the LCA. ... 37
Figure 8 Research process ... 41
Figure 9 CVCA analysis ... 41
Figure 10 Number of cars sold for business activity in Poland in 2012. ... 49
Figure 11 Optimisation model outline ... 64
Figure 12 Outline of methods ... 94
Figure 13 Estimated volume of new vehicle registrations through 2030 [thousands of units] 70 Figure 14 Estimated passenger vehicle prices through 2030 for Scenario 1 – BAU, Scenario 2 – Energy Security and Scenario 3 – Low Petroleum Price [PLN] ... 74
Figure 15 Estimated lorry price through 2030 for Scenarios 1 – 4 [PLN] ... 74
Figure 17 Estimated energy prices until 2030 [PLN] in Scenario 1 – BAU, Scenario 2 –
Energy Security and Scenario 4 – Subsidy. ... 78
Figure 18 Estimated energy prices until 2030 [PLN] in Scenario 3 – Low Petroleum Price .. 78
Figure 19 Power demand composition until 2030 [PLN] ... 81
Figure 20 Annual average millage ... Error! Bookmark not defined. Figure 21 Transition of overall vehicle fleet (old vehicles + new registrations) from 2014 to 2030 for PVs, lorries and buses for Scenario 2 – Energy Security [Million units] ... 84
Figure 22 Total sales projected between 2015 and 2030, by type of PV, for Scenarios 1, 2, 3 and 4 [units] ... 85
Figure 23 Transition of total lorry fleet from 2014 through 2030 in Scenario 2 – Energy Security [Million units] ... 87
Figure 24 Transition of total bus fleet from 2014 through 2030 in Scenario 2 – Energy Security [units] ... 88
Figure 25 Total vehicle possession of the AFVs. ... 99
Figure 26 Changes in total vehicle portfolio between 2016 and 2030 ... 100
Figure 27 Total sum of units sold between 2016 and 2030 by type of vehicle ... 100
Figure 28 LCA1 and LCA2 - water consumption of shale gas in billions of liters between 2016 and 2030 ... 101
Figure 29 Outline of LCA ... 113
Figure 31 EV emissions for 10,000 km for Tech. Adv. scenario between 2016 and 2025. .. 135
Figure 32 CO2 emissions for Tech. Adv. scenario. ... 136
Figure 33 NO2, PM emissions for Tech. Adv. scenario. ... 137
Figure 34 SO2 emissions for Tech. Adv. scenario. ... 138
Figure 35 CO2 emissions for Tech. Adv. scenario and BAU scenario. ... 139
Figure 36 Total health cost associated with EV production, transportation and use (production in 2016) ... 141
Figure 37 Total health cost associated with EV production, transportation and use (production in 2025) ... 141
Index of tables
Table 1 Survey of conventional studies 27
Table 2 Conventional studies on AFVs 39
Table 3 Government view on AFVs problems 43
Table 4 Automakers view on AFVs problems 43
Table 5 Prius price analysis 44
Table 6 Registered car data for 2012 46
Table 7 Generation of net electricity divided by fuels [TWh] 53
Table 9 Numbers of units owned in 2014 71
Table 10 New car real running fuel consumption [MJ/km] 72
Table 11 Infrastructure cost per unit sold [PLN] 80
Table 12 Water consumption during shale gas transportation is minimal and amounts to 0.01l
per 1m3 of shale gas 97
Table 13 Parameters concerning LCA and shale gas production 98
Table 14 Health impact of pollutants 104
Table 15 Survey of conventional studies 107
Table 16 Characteristics of vehicles 117
Table 17 Electricity mix in BAU scenario 118
Table 18 Electricity mix in Tech. Adv. scenario in 2025 120
Table 19 Emissions cost in € 121
Table 20 Emissions from GVs in BAU scenario 124
Table 21 Emissions from coal power plants 124
Table 22 Emissions from electricity production 125
Table 23 Emissions from GVs in Tech. Adv. scenario 125
Table 24 Emissions from coal power plants in 2025 126
Table 26 Total LCA for 10 years of use for vehicles produced in 2016 in BAU - Japan 130 Table 27 Total LCA for 10 years of use for vehicles produced in 2016 in BAU – China 130 Table 28 Total LCA for 10 years of use for vehicles produced in 2016 in BAU – UK 131 Table 29 Total LCA for 10 years of use for vehicles produced in 2016 in Tech. Adv. Scenario
- Japan 131
Table 30 Total LCA for 10 years of use for vehicles produced in 2016 in Tech. Adv. scenario
– China 132
Table 31 Total LCA for 10 years of use for vehicles produced in 2016 in Tech. Adv. scenario
- UK 132
Abbreviations
AFV - Alternative Fuel Vehicle
CNG – Compressed Natural Gas Vehicle, CO2 – Carbon dioxide
CVCA - Customer Value Chain Analysis DHEV – Diesel Hybrid Electric Vehicle, DV – Diesel Vehicle,
EV –Electric Vehicle, FCV – Fuel Cell Vehicle,
GHG - Greenhouse Gas Emissions GV – Gasoline Vehicle,
HEV – Hybrid Electric Vehicle, IEA - International Energy Agency LNG - Liquefied Natural Gas Vehicle LPG – Liquefied Petroleum Vehicle, MSD - Medium Speed Diesel Vessel NGV - Natural Gas Vehicle
PM - Particulate Matter RORO - Roll On Roll Off SO2 - Sulfur dioxide UK - United Kingdom
1. INTRODUCTION
1.1. Research background
The total global energy demand has almost doubled since 1980 and studies have estimated that approximately 20% of the global energy is consumed by the transportation sector (OECD and International Transport Forum (ITF) 2015).
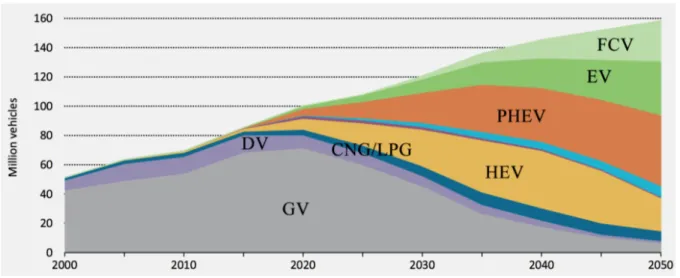
It has been suggested that the volatility of petroleum prices and rapid technological developments are making Alternative Fuel Vehicles (AFVs) an increasingly promising option for decreasing energy consumption, GHG emissions, diversifying energy portfolio and maintaining energy security (IEA, 2015). The Figure 1 below present the fast spread of AFVs in the future.
Figure 1 Forecast of the spread of AFVs. a Source : (IEA, Energy Technology Perspectives 2015)
AFVs can be defined as vehicles operating exclusively on an alternative fuels (e.g. electricity or compressed natural gas (CNG)) or on a hybrid of alternative and traditional fuels (U.S. Energy Information Administration 2013). The AFVs investigated in this study are fuel cell vehicles (FCVs), hybrid electric vehicles (HEVs), diesel hybrid electric vehicles (DHEVs), electric vehicles (EVs) and CNG vehicles. Liquefied petroleum gas (LPG) vehicles and diesel vehicles (DV) are not generally considered to be AFVs. It is projected that between 2012 and 2040, the total volume of road vehicles will double; however, research has consistently shown that the adoption of more efficient technologies and switching to alternative fuels will slow the increase in demand for fuel relative to past periods (IEA, 2015). The demand on transportation is projected to be rising and it triggers the increase in CO2 emissions. Road transport emissions will increase by around 70% between 2015 and 2050. Even though the energy efficiency and average CO2 intensity of transport decreases substantially in this time period, the heavy increase in transport demand impede the positive trend (OECD and International Transport Forum (ITF) 2017). Moreover, the world will be faces with fossil fuel depletion. Production of oil from existing conventional fields is forecasted to fall by almost two-thirds by 2040. There is a need to supply the oil from not yet developed or not yet found sources. Furthermore, investment in alternative energy is crucial to lower emissions, global warming and improve energy security (International Energy Agency (IEA) 2015a).
Air pollution is one of the top greatest risk factors for human health. According to pundits, roughly 6.5 million premature deaths are the aftermath of air pollution (International Energy Agency 2016). The cost of the health problems originating from air pollution stood at $330-940B in 2010 for European Union (EC (European Commission) 2013). Industry, power plants, households, transport, agriculture and waste treatment are human-made sources of air pollution (International Energy Agency 2016). Inefficient and poorly regulated fuel combustion, residential heating, vehicles exacerbate the impact of emissions (Romejko and
Nakano 2017). Those activities cause emissions e.g. sulfur oxides (SO2), particulate matter (PM) and nitrogen oxides (NOx). More than a quarter of total energy-related emissions of SO2 are made in China (International Energy Agency 2016). Transportation attributes to over 50% of all energy-related emission of NOx. For instance, only in China, more than 1 million premature deaths were recorded due to outdoor air pollution caused by particulate matter. Various AFVs have been developed to reduce greenhouse gas (GHG) emissions, air pollution and move transport economies away from petroleum use. In addition to technological improvements, policy proposals are crucial to the market success of AFVs (Dong et al. 2014). Customers will not find AFVs attractive without an affordable price, easy access to spare parts and repair services and readily available fuel. Equally important, automakers, governments and energy producers will not invest in AFV infrastructure and technology without the anticipation of a sizeable market (Struben and Sterman 2008). According to Christensen (2011), manufacturers have developed many AFV prototypes but have produced only a few on a large scale. Orsato and Wells (2007) stated that large-scale production reaching 250,000 units per vehicle model is necessary to reduce the manufacturing cost and provide affordable products. Companies cannot invest in every technology and must, therefore, develop products most promising for the spread of AFVs.
The environmental benefits of AFVs have attracted the interest of several institutions into further research and development (Mimuro and Takanashi 2014). Governments in the United States (US) and European Union (EU) are implementing incentive systems and long-term introduction plans for alternative fuel vehicles as one of the solutions to environmental problems (Hawkins et al. 2013; International Energy Agency (IEA) 2015b).
Governments are willing to invite manufacturers to establish green production technologies and promote EVs in their countries with the goals of increasing investment, fighting
unemployment, promoting clean energy, decreasing energy dependency, creating an environment-friendly image, and meeting the conditions of international agreements on environmental issues. However, sometimes setting the green production technologies does not necessary results in environmental gains. In this study we consider environmental leakage, which happens when rich country imports dirty products from developing countries. This phenomenon leads to displacement of emissions abroad and often an increase in the global pollution (Fæhn and Bruvoll 2009).
Figure 2 Research problem outline
1.2. Literature review, motivation and research objectives
There have been plenty of previous studies carried out on Alternative Fuel Vehicles and future energy trends. According to International Energy Agency, the total global energy demand has almost doubled since 1980 and it is forecasted, that if the current trends continue unchanged, it will grow more by 85% by 2050 (International Energy Agency 2015).
M ul ti pl e Health G loba l st age s of L CA ef fe ct s suppl y c ha in ka (2010) X X X M ul ti pl e c . X X X . Chua (2013) X X X t e t a l. (2015) X X X X ri m ori (2012) X X X X A (2012) gl oba l X X X X X o (2012) X X X X X X (2010) X X X a (2013) X X X X X le r a nd H endri cks on (2015) X X X USA X X X ara s a nd M ei st erl ing (2008) X X USA X ey e t a l. (201 1) X X UK X X X he m e t a l.,(2015) X X X X X G erm any X X ki ns a nd G aus en, (2012) X X X X gl oba l X X X X X X USA X X X X X X X X X Chi na X ars ha ll e t a l., (2013) X X X USA X X X u a nd A li pra nt is (2013) X X USA X X X ai ny e t a l. (2009) X X X USA X ng Y ang (2016) X X X X Chi na X E le ct ri c P ow er Re se arc h ti tut e (2007) X X X X en a nd K ura ni (2013) X USA X X X ne r-M eye r (2007) X USA X X X dy a nd O ’M ahony (201 1) X X Ire la nd X ha m -row e e t a l., (2012) X ki a nd K orone os , (2013) X X X G re ec e X X e t a l., (2015) X X X it eki n e t a l., (2014) X is r es ear ch X X X X X X X X X X X X X E nvi ronm . le aka ge Cha rgi ng sc ena ri os Gas E ne rgy se curi ty Ta xa ti on F CV L orry , Bus PLDV M ul ti pl e Size M ul ti pl e AFVs non-G H G GHG L CA se arc h
Table 1 Survey of conventional studies
The conventional studies analysis was carried out and the results are presented in the Table 1.
The analysis of conventional studies shows that either the studies are focused only on one type of the AFVs e.g. EVs (Nakano and Chua 2011; Graham-rowe et al. 2012; Nanaki and Koroneos 2013; Yagcitekin et al. 2014; Yabe et al. 2015) or do not take into account buses or lorries. Moreover, in most of the papers, energy security is not investigated. Numerous researches have studied LCA, however most of them focused only on one stage of vehicle life (Brady and O’Mahony 2011; Howey et al. 2011; Jochem et al. 2015). Many studies investigate GHG emission, but disregard non-GHG emissions and health impact of the vehicles (Elgowainy et al. 2009; Nealer and Hendrickson 2015). Furthermore, there have been no studies, which analyze the impact of the shale gas revolution on AFV’s portfolio and its implications. Plenty of studies did not presented a systematic and broader view of the problem. The detailed analysis of the conventional studies can be find in Chapter 3, 4, 5 and 6.
That is why, the originality of this study is that it considers energy security issues, resource restrictions, multiple scenario analysis and takes into account the impact of different stages of AFVs’ use on environment, and society in different regions.
This research is motivated by the fact that, AFVs presents a promising option for future transportation systems. The motivation of this research is to improve the global energy, environment and production systems, while using AFVs and sustainable approach.
Question 1: What is the optimal portfolio of Alternative Fuel Vehicles?
Question 2: Where should the production site of Alternative Fuel Vehicles take place?
The objective of this study is to systematically assess the impact of AFVs on economy, environment and society by conducting optimisation and life cycle assessment simulation. This thesis contributes with insights from interdisciplinary research on Alternative Fuel Vehicles. These results can be used to advantage by automotive companies and national institutions for strategic decision making on transport, energy policy, investment, and for informing policies supporting introduction of AFVs (e.g. government subsidies or tax exemptions). This study would be also beneficial for potential shale gas investors, as it would provide numerical results on water usage. This could influence their decision on investing in shale gas production. Automakers and policy makers need to investigate the lifecycle emissions of vehicles in different regions. It is crucial to decide if governments should invite EV production into their country, or whether it would be more beneficial to import vehicles. The results might encourage switching to EVs, and in order to do that, governments can implement either subsidy or environmental tax deduction. For this purpose, governments need to create target for policy creation, which was already studied by (Nakano and Chua 2011; Nonaka and Nakano 2011).
1.3. Structure of research
This paper consists of eight chapters. Chapter 1 presents the background and subject of the research, previous studies deliverables, originality, motivation, and objective of the study. In Chapter 2 methods of the thesis are briefly described. Chapter 3 provides qualitative analysis of AFV and insights into automotive industry and energy sectors of the case studied country.
Chapter 4 elucidates the optimization model, and constraints, variables and results for vehicle portfolio analysis. Case study for shale gas revolution and vehicle portfolio analysis is illustrated in Chapter 5. Chapter 6 explains the LCA method, scenarios and data used in the calculations for two case scenarios. The results of the LCA simulations are provided in Chapter 7. Finally, conclusions and limitation of the study are presented in Chapter 8.
The detailed structure of the research is presented in the Fig 3.
1.4. Published papers
Periodically published articles (original articles related to main thesis):
1.K. Romejko, M. Nakano, Portfolio analysis of alternative fuel vehicles considering technological advancement, energy security and policy, Journal of Cleaner Production Vol. 142 (2016) pp. 39–49. doi:10.1016/j.jclepro.2016.09.029.
Impact Factor (JCR): 4.959 (2015) SCI: 1.721
2.K. Romejko, M. Nakano, Life Cycle Analysis of Emissions from Electric and Gasoline Vehicles in Different Regions, International Journal of Automotive Technology Vol.11 No.4. (2017)
Impact Factor (JCR):: 0.875 (2015)
International conference papers (full-length papers with peer review):
1.K. Romejko, M. Nakano, Introduction of Clean Energy Vehicles in Poland under energy security constraints, In: IFIP Advances in Information and Communication Technology: Advances in production management systems: innovative production management towards sustainable growth. Springer International Publishing, pp. 343-352, (2015). http://dx.doi.org/10.1007/978-3-319-22759-7_40.
2.K. Romejko, M. Nakano, Impact of shale gas revolution on a portfolio of alternative fuel vehicles and water usage: case study on the Polish market, International Proceedings of
Chemical, Biological and Environmental Engineering Vol. 98 (2016) pp.53–60. doi:10.7763/IPCBEE.
3.K. Romejko, M. Nakano, Health impact of Electric Vehicles considering environmental leakage. The case study on Japan, China, UK and Poland., In: IFIP Advances in Information and Communication Technology: Advances in production management systems: innovative production management towards sustainable growth. Springer International Publishing (to be published in September 2017)
2. METHODS
The research concerns market and data study, thus both qualitative methods and quantitative methods are being used. The research is based on three methods. In the beginning of the study, qualitative analysis is conducted. Secondly optimization is carried out. Finally, Life Cycle Analysis is performed.
2.1. Qualitative analysis
The first step is to qualitatively investigate the problem by intelligence gathering, analysis of literature, case studies, stakeholder analysis, statistical analysis and interviews with pundits. The stakeholder’s analysis was carried out by the use of Customer Value Chain Analysis (CVCA). Four, core stakeholders were identified i.e. government, manufacturers, energy companies and consumers. Taking into consideration the above, analysis of each of the stakeholders was conducted and interviews with those entities have been carried out. The purpose of Qualitative Analysis is to find causes that prevent popularity of AFVs.
2.2. Optimisation
Following that, qualitative findings were used and combined in quantitative analysis in order to analyze the development of AFVs by 2030. This study thus adopts optimisation model in quantitative analysis to uncover optimal portfolio of AFVs in 2030.
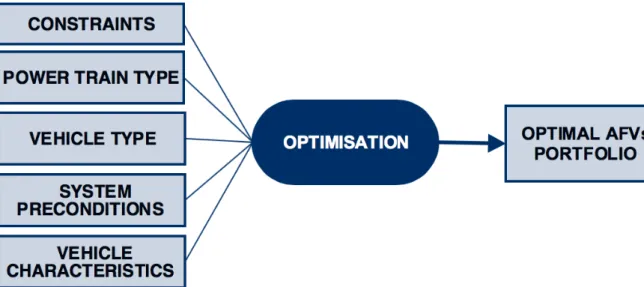
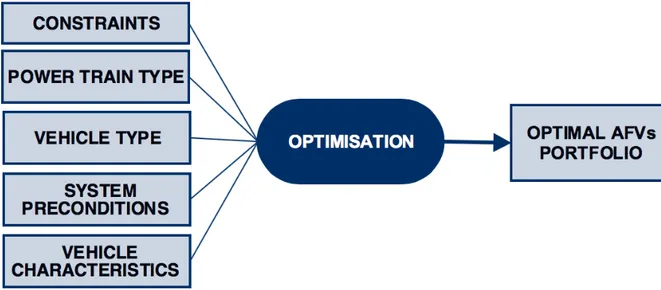
Qualitative analysis is computed from a systematic approach, including two parts: energy security constrains and economical efficiency. The model defines economical efficiency of the vehicle portfolio while considering oil and gas dependency rates. Fig. 4 presents an outline of the optimisation model. Three categories of vehicles are considered: passenger vehicles, buses and lorries. Moreover, 8 types of vehicles are taken into consideration based on engine platform variations (GV, DV, HEV, DHV, CNG, FCV, EV and LPG). The following model takes as input three groups of data: restriction values (gas and oil rates), vehicles characteristics (vehicle price, fuel consumption, average mileage, usage price, etc.) and other preconditions (energy prices, power supply composition, etc.). This data is input into the optimisation model and the output is the optimal volume of new vehicle sales of each AFV. Moreover, three costs are input into the model: infrastructure, vehicle and fuel; their sum creates a total AFV system cost.
2.3. Life Cycle Assessment
Life cycle assessment is a tool that has been used in most of the recent studies on the assessment and comparison of vehicles(Samaras and Meisterling 2008; Nonaka and Nakano 2010; Ou et al. 2010; Brady and O’Mahony 2011; Faria et al. 2013). Life cycle assessment can identify the environmental impact of a product.
LCA is used three times in this study. Firstly, it is used to assess the impact of shale gas revolution. The outline of the model is presented in Fig 5.
Figure 5 LCA model outline for shale gas revolution
The results from optimization for the second case study are input into the LCA. The model includes water consumption of shale gas on different stages of production for two scenarios. This model is used in Chapter 4.
Secondly, LCA is used to quantify air pollution from EVs and GVs during their lifecycle under two technology scenarios. Three stages are considered i.e. manufacturing, use and end-of-life, the outline of the LCA is presented in Fig 6. This LCA model is used in Section 6.1
Figure 7 Outline of the LCA for health effects.
Thirdly, LCA is employed to quantify health impact of EVs and is presented in the Fig.7. This LCA considers four stages i.e. manufacturing, transportation, use and end-of-life. The import, export and transportation part of the model are presented in the Fig.8.
3. QUALITATIVE ANALYSIS
3.1. Chapter introduction
Along with increasing crude oil prices, a high pressure is put all over the world for the proliferation of AFV (AFVs), to reduce not only CO2 emissions, but also energy consumption in the automotive sector to provide apt energy security. The transportation sector accounts for approximately 20% of total worldwide energy consumption (International Energy Agency (IEA) 2012). Throughout the years, there have been various types of AFVs developed in order to reduce greenhouse gas emissions and move our economy away from petroleum in transportation.
Despite abundance of the choice, Poland is still lagging behind with sales of AFVs. In 2011, there were only 897 hybrid vehicles registered (Polish Automotive Industry Association 2013). When it comes to ensuring energy security, the situation does not look bright too. 98.2% of Poland’s crude oil consumption and 72.4% of Poland’s natural gas consumption are being satisfied from import supplies (International Energy Agency (IEA) 2014). Transport sector itself is responsible for over 60% of crude oil consumption in Poland (International Energy Agency (IEA) 2013).
There have been plenty of studies carried out on the AFVs portfolio and future energy trends. The scopes of them were gathered in the Table 1.
Nonaka (Nonaka and Nakano 2011) researched carbon taxation by using LCA and have conducted life cycle cost analysis of AFV cars in order to create a carbon taxation aiming at encouraging customers to choose lower CO2 emission AFVs. However, the analysis was
focusing only on assessment of passenger cars, excluding bus and trucks in the research. Most of the conventional studies do not include those types of vehicles.
The objective of S. Chua’s research (Nakano and Chua 2011) under the title: “Design of Taxation to Promote Electric Vehicles in Singapore”, was to conduct LCA to reach decisions that will have a minimum or no impact to the environment.Nonetheless, this paper examines only EVs and other AFV cars are not taken into consideration.
Only, Arimori’s research (Arimori and Nakano 2012) incorporated data concerning bus and trucks. However, far too little attention has been paid to that type of vehicles and results show that those cars have little impact on the final results. In order to construct an optimal portfolio passenger cars, trucks and buses has to be included in the research. What is more, various types of fuel type engines should be also examined in pursuance of a high quality research. There is a necessity for introduction of all range of AFV also in trucks and buses and there influence on fuel consumption cannot be disregarded. In addition to that, most of the researches are mainly focusing on CO2 emissions, forgetting energy security issues. Arimori’s research however, does include oil restriction, but is not taking into consideration gas restriction. Moreover, it is written in Japanese.
Table 2 Conventional studies on AFVs
Research Passenger Vehicle All types of AFVs restriction Oil restriction Gas Truck& Bus
IEA (2012) X X X
Y. Arimori (2012) X X X X
H.Choi (2010) X
S. T. Chua (2013) X
In the case of European countries like Poland, gas is an important source of energy, also in terms of automotive usage. Thus, the model should not be created without incorporating gas restrictions. In line with the above, the originality of this study is, that it includes gas security restrictions due to huge LPG market in Poland and possible proliferation of CNG vehicles in the future.
Section 3.2 explains the methodology and Section 3.3 describes results of qualitative analysis.
3.2. Methodology
In the beginning of the study, intelligence gathering was conducted and research objective and questions were formulated: Why AFVs are not popular in Poland and what policy should be introduced to change the situation? The purpose of Qualitative Analysis is to find causes that prevent popularity of AFVs. Data, potential problems and opportunities were identified in this chapter through collection and analysis of literature, case studies, survey researches, statistical analysis, stakeholder analysis and interviews with pundits. In order to achieve economic goals, a qualitative analysis of both the automotive and energy sector in Poland was carried out. Firstly, stakeholder analysis was carried out by using Customer Value Chain Analysis (CVCA). CVCA is a tool that enables to identify relevant stakeholders, their relationships with each other, and their role in the product’s life cycle [10]. Later interviews with stakeholders were conducted. By using this methodology research questions were verified.
Qualitative findings were used and combined in quantitative analysis in order to analyse the development of the AFV market in Poland in the following Chapter 4.
The whole thesis concerns policy, market and data study, which is why both qualitative and quantitative methods are used. The study is conducted in line with the Fig.9.
Figure 9 Research process
3.3. Stakeholder analysis, interviews, statistical and literature analysis
3.3.1. Stakeholder analysis
Fig. 10 presents the analysis of stakeholders and their relationship that was carried out with CVCA. Four main stakeholders were identified: consumer, car manufacturer, government and energy company. The most important stakeholder is government. It receives TAX from other stakeholders and its role is to provide subsidies and policy support.
3.3.2. Results of interviews
The first interviewee is an expert from Department of Innovation and Industry from Ministry of Economy. He believes that when it comes to terms with governmental stakeholder it is the Ministry of Finance is reluctant on creating an incentive system, rejecting proposals in order to protect the yearly budget. Forgetting that those aids can bring income from other sources. The interviewee believes that change in policy is essential to change the situation. His recommendations include i.e. establishing new scrap incentive system based on the previous experience in Germany. Unless the government introduces aid for customers to buy AFVs, the number of sales will still stand at a minor level. Furthermore, new tax system is crucial to change the situation. The next stakeholders considered in this interview are automakers. Automakers aim at collaborating with local government, which is more willing to achieve aforementioned goals. Low sales means less investment from other countries and less people employed. Moreover, the pundit confirmed the fact that individuals do not wish to buy AFVs because of high prices and prefer to buy used cars, or just cheaper makes. Confusing car tax policy means that buyers postpone their decision on a purchase of a new vehicle.
Another interviewee is Sales Managing Director in Automotive Company in Poland. He stated that government and its policy discourage buyers from purchasing new cars, favoring more affordable non-efficient ones. Furthermore, European policy created an easy access to affordable used cars from Germany. There are numerous problems concerning consumers. Poles are not concerned with environmental issues. There is low affordability of AFVs in Poland. Consumers tend to buy cheaper, not environmental friendly cars. Used cars are changed into LPG-driven vehicles or are using non-efficient diesel engines, which are cheap but not powerful. Polish people have very little knowledge of AFVs. Poles do not know about hybrid and technologies. There is a need to educate consumers, giving them a
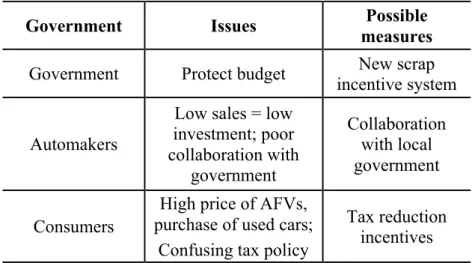
fresh and realistic view of AFVs. Since people travel for long distances and use cars for many years, AFVs seem like a good investment if people know that they should take into consideration life cycle cost of a vehicle and not only the initial cost. From the pundit point of view automakers expect a higher volume of vehicle sales in Poland. High demand on new vehicles, close proximity of component factories, low turnover of employees and cost of employees are the factors that influence decision on establishing a new vehicle plant. Moreover, the drop in price, could give customers incentive to purchase a AFV. The Tables 3 and 4 sum up the results of interviews with stakeholders.
Table 3 Government view on AFVs problems
Government Issues Possible
measures Government Protect budget New scrap
incentive system Automakers
Low sales = low investment; poor collaboration with government Collaboration with local government Consumers
High price of AFVs,
purchase of used cars; Tax reduction incentives Confusing tax policy
Table 4 Automakers view on AFVs problems
Automakers Issues Possible measures
Government
Easy access to used cars from Germany
AFVs subsidies Policy and rules discourage purchase of new car
Automakers A higher volume of sales is expected
Higher demand on vehicles; Proximity of factories;
Consumers
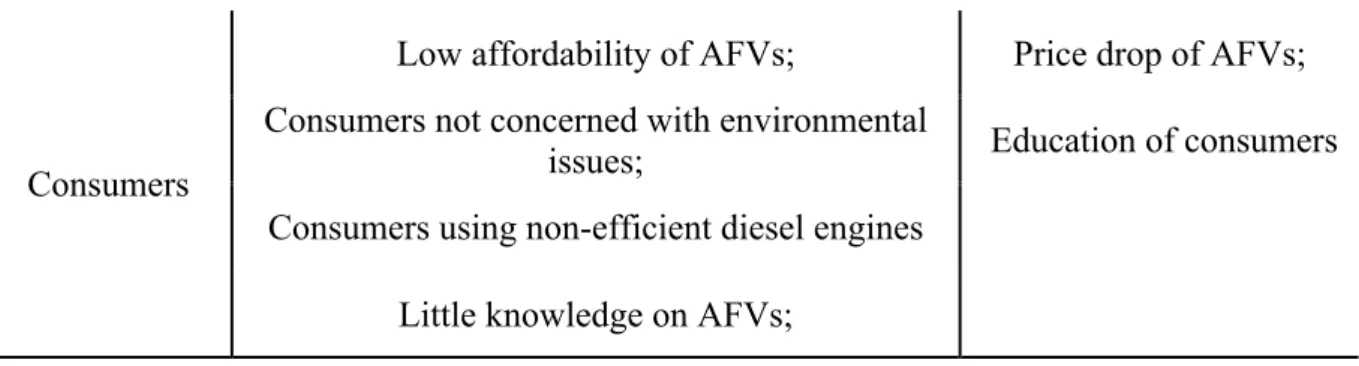
Low affordability of AFVs; Price drop of AFVs; Consumers not concerned with environmental
issues; Education of consumers
Consumers using non-efficient diesel engines Little knowledge on AFVs;
Furthermore, Prius price analysis was conducted as shown in Table 5 and was approved by the second interviewee. Price of Prius in Poland is very high, that is why I have examined the reason behind that. The results prove that the premium consists most of the taxes applied by Polish government and not market premium of a Japanese producer. The parameter 1.0 amounts to 2 1700 00YPY.
Table 5 Prius price analysis
Item Value
Market price of Prius in Japan 1
Cost of Prius in Japan without TAX (8%) 0.95
Transport cost 0.01
Customs - 10% 1.06
Excise TAX - 18,6% 1.25
TAX in Poland - 23% 1.54
Cost of Prius in Poland according to calculations 1.54
Market price of Prius in Poland 1.57
3.3.2. Statistical, literature analysis and discussions
Current Status of the Automotive Industry in Poland
Automotive is of great importance to the Polish economy. It is estimated that in 2010 the value of exports of Polish automotive industry (vehicles and parts) exceeded 17 billion euro (Polish Automotive Industry Association 2015). Already 16% of Polish exports come from the automotive industry (Polish Automotive Industry Association 2013).
According to GUS data, in automotive areas of Polish automotive sector 381,500 people were employed in 2011, close to two-thirds of which (228,700) in trade and services, and more than one third (152,800) in manufacturing (Central Statistical Office (GUS)). The last figure is accompanied by five positions in industries around automotive. Participation of involvement of Polish automotive industry in GDP creation is steadily growing and in 2013 it amounted to around 6% (PWC 2015). However, in recent years there have been cuts in the sector due to the crisis, which is another problem that Polish people will face in next years to come.
What is more, if we look closely at the data concerning car park in 2012 in Table [1] we can easily notice other concerns. There is an obvious issue with obsolete cars and low purchase of new cars, especially by individuals. As a result, 15 years is a statistical age of a vehicle registered in our country (Polish Automotive Industry Association 2013). That is why more than 98% of cars produced in Poland in 2010 were exported (Polish Automotive Industry Association 2013). The economic climate in recent years did not encourage customers to buy new cars.
The main problems are drops both in car sales and production. In 2012, Polish manufacturers produced 540,000 passenger cars, 27.1% less than in 2011. Poland recorded drops in sales of
cars in both individual and companies purchase. In recent years there have been cuts in the sector due to the aftermaths of the economic difficulties of the past 5 years that have strongly affected EU consumers’ demand for new vehicles. Data indicate that in 2012 the Polish authorities registered 312,096 new passenger cars and LCVs – less by 8,025 (2.5%) than the year before (Central Statistical Office 2014).
Table 6 Registered car data for 2012
Characteristics Values
Number of cars 17,2 m
Average age of a car 15,5 y
New cars registered 270 584 unit
Used cars registered 1,5 m
Average age of used imported car 10,2 y Average life of a car used by the
company 4 y
Percentage of petrol fuelled cars 61% Percentage of diesel fuelled cars 22% Percentage of LPG fuelled cars 14,37% Percentage of cars fuelled by other
sources ~1%
Percentage of HEV cars ~0.3%
a Based on: (Polish Automotive Industry Association 2013; Central Statistical Office 2014)
As a result of those trends, the international role of Poland as an automotive manufacturer has been on decline. The automotive sector is also one of the most important areas of Poland’s economy in terms of its role in foreign trade. As global manufacturing capacity
increases, automakers have to address excess production seriously. The global automotive market is predicted to be overbuilt by 20-30% by 2016 (KPMG 2015). That are other problems that Polish people will face now and in next years to come, which are drops in production, cuts in working force, preferring locating FDI in other countries than Poland. In order to change the situation, demand on cars has to be at least stable or has to be increased. Manufacturers locate their investment when local demand is high and they have perspectives in the future and at present there is none of the above available. That is why increasing sales or even maintaining them is crucial problem and by conducting my research I can estimate consumer preference and utility functions and later combine them with future scenarios that can support policy makers while making their decision on applying policy to increase car sales in Poland.
On the other hand there is an opportunity for introduction of AFV in Poland since domestic coal reserves are of vital importance for the Polish economy. However, the situation for import of oil and gas is undoubtedly different than it is for coal. That is why Poland should treat introduction of AFV as an opportunity to become more independent from fuel imports and as a way of spurring automotive industry in Poland.
Polish government has recently showed first signs of interest towards AFVs and is considering this area as a future investment. Domestic coal reserves are of vital importance for the Polish economy. However, the situation for the importation of oil and gas is undoubtedly different than it is for coal. That is why Poland should treat the introduction of AFVs as an opportunity to become more independent from fuel imports, and as a way of spurring automotive industry in Poland.
Roots of low car sales
In Poland, the average person earns 17 8204 USD a year, less than the OECD average of 29 016 USD a year, in Japan, the average person earns 27 323 USD a year (OECD 2017). Therefore the first problem recognized while doing the analysis is the affordability of AFV in Poland.
Every year there is around 1.5mln cars registered, but only 270 584 of them are new cars (Polish Automotive Industry Association 2013). The share of new cars registrations stands at only 18%. In 2012, there were 153 905 new cars bought by companies and 116 679 purchased by individuals. Therefore the ratio is 57% in favour for business, the structure and numbers of cars sold for entities are visible in Fig.11.
Figure 11 Number of cars sold for business activity in Poland in 2012.
a Based on: : (Central Statistical Office (GUS); Polish Automotive Industry Association 2015)
Except for different power purchase price, there are other roots of the problem that cause low volume of new cars sold. Easy access to cheap, used cars from Germany is definitely highly influencing the decision to switch to older cars.
Current Status of the Energy Sector in Poland
Energy security issues are becoming another preeminent topic, especially after considering recent political developments in the Russian-Ukrainian dispute. Energy resources security is a crucial concern for a developing country. Energy security definitions have already been researched by plenty of pundits. The most widely used definition of energy security is provided by International Energy Agency. It defines energy security as ‘the uninterrupted physical availability at a price which is affordable, while respecting environment[al] concerns’ (International Energy Agency (IEA) 2012).
However, the conception of energy security varies depending on the role of a given actor in the system (e.g. energy distributor).
Poland is mainly an energy importer and a consumer of Russian energy supplies, that's why for the purpose of this research, an application of consumer-oriented definition is needed. A country is vulnerable to interruptions in the physical availability of energy supplies or to unforeseen price hikes when state dependents on imports for a considerable share of its energy supply. Those circumstances are perceived as ‘energy dependency’.
According to Balmaceda (Sharples 2012), the definition of energy dependency is as follows: 1.more than one-third of a country’s total energy supply comes from foreign sources; 2. more than 50% of a country’s annual consumption of a single major energy source comes from foreign sources
3. a country depends on a single external provider for more than 60% of its imports of a major energy source for that country or more than 45% of its consumption of that energy source.
Energy policy in Poland
Polish energy policy’s issues are described in a document under the title: “Energy Policy of Poland until 2030”, which was prepared by Ministry of Economy and adopted by the Council of Ministers on 10 November 2009 (Ministry of Economy 2009a) .
This resolution presents the strategy of the Polish state, which aims to address the most important challenges that the power industry must face, both in the short and in the long run, until 2030 (Ministry of Economy 2009a).
Within the document, primary directions of Polish energy policy have been set. The ones that are important to this research have been listed below:
- to improve energy efficiency;
- to enhance security of fuel and energy supplies;
- to diversify the electricity generation structure by introducing nuclear energy; - to develop the use of renewable energy sources, including biofuels.
The main objective of energy policy in the field of improving security of fuels and energy supplies is to ensure energy security by:
1.Enhancing the diversification level of crude oil, gas and liquid fuels supply sources, understood as obtaining crude oil and gas from various regions of the world, from different suppliers, using alternative transport routes;
2.Building crude oil and liquid fuels storage facilities of capacity, which ensures continuity of supplies, particularly in crisis.
The measures set in order to achieve those objectives are plentiful, e.g.: building a terminal for receiving liquefied natual gas (LNG), diversification of supplies by building a transmission system for natural gas supplies from the north, west, and south, as well as building connections to primarily meet the requirement of supply sources diversification; appropriate tariff policy encouraging investment in gas pipeline infrastructure; building infrastructure to allow transport of crude oil from other regions of the world, inter alia from the Caspian Sea region within the Euro-Asian Oil Transportation Corridor project; lifting barriers to development of fuel infrastructure and supporting investment projects in infrastructure with the use of European funds; ensuring fuel transport by sea.
It is not stated however, how much should energy security be improved. The progress in the energy policy implementation will be monitored in particular on the basis of indicators set by various ministries.
Maximum share of total natural gas and crude oil imports from a single direction in the domestic consumption of both those resources has to fall down by 15% till 2030 from the 2007 level. There is no benchmark stating how much should energy security increase, only indicators stated above are directly connected with energy security issues.
Energy mix in Poland
Concurrently, the dominant source of primary energy is coal, followed by oil, natural gas, and minor share of renewables. Nuclear energy is not being produced now in Poland (International Energy Agency (IEA) 2013).
In 2009, 94.0% of Poland’s crude oil imports came from Russian suppliers. The remaining portions of crude oil were imported mainly from Algeria (around 2% of the total), the United Kingdom and Norway (around 1% of the total). During the same time period, 82% of gas imports came from Russia, 11% from Germany and small part from Belarus and Ukraine (Ministry of Economy 2009b).
Maintaining an energy structure mix with coal as a main source of supply results in substantial emissions of air pollution, lower efficiency and higher prices of energy. It is important to note that Polish GDP growth was almost always higher than the average EU one in last decade, however we managed to decrease greenhouse gas emission. Moreover, Polish economy is expected to be growing in next years to come as well and in spite of projected 11% increase in demand for final energy between 2006 and 2020, there is a significant, 15% decrease projected in CO2 emissions (Ministry of Economy 2009b).
According to governmental policy stated in “Energy Policy of Poland until 2030: Projection of Demand for Fuels and Energy until 2030” (Ministry of Economy 2009b), the share of hard coal in demand for primary energy is supposed to be decreased in favour of renewable energy. The objectives of the EU targets for renewable energy will require the gross electricity production from renewable energy source at the level of about 18.8% of the total production in 2030. Gas demand is projected to rise by 18% in 2020 and by 43% in 2030 compared with 2010 (International Energy Agency (IEA) 2011). Table 7 shows the changes
in the generation of net electricity by fuels till 2030 (Ministry of Economy 2009b). It is forecasted that the net electricity production will moderately rise from the level of ca.140 TWh (2008) to more than 201 TWh (2030) (Sadowski and Romancza 2013).
Table 7 Generation of net electricity divided by fuels [TWh]
a Based on: (Ministry of Economy 2009b)
The energy from wind power plants will have the largest share 8.2% of the forecast gross total production in 2030 (Ministry of Economy 2009b; Sadowski and Romancza 2013). Due to the environmental requirements set by EU, nuclear power plants will appear in the mix of electricity sources. It is assumed that the first nuclear power plant will appear in 2020. In total, three nuclear units power should operate with a net total capacity of 4,500 MW by 2030.
In line with the above, comparison of Polish situation with the basic energy dependency definition provided by Balmaceda, uncovers the fact, that Poland meets the three requirements of this definition. That is why the assumption is that Poland’s energy security is
not guaranteed. In case of Poland, there is a threat to security of crude oil supplies, as well as a threat of monopolistic price fixing. This is a result of the market being dominated by supplies from one direction only – Russia. In order to avoid such a situation, the level of supply diversification needs to be enhanced. In line with the government statement (Ministry of Economy 2009b), it is crucial not only to boost the number of suppliers, but at stake is to eliminate situation, where oil and gas comes from a single area, and its transmissions are controlled by a single entity.
Energy Use in The Transportation Sector
The transport Sector is responsible for 64% of the crude oil consumption in Poland. When it comes to the gas consumption by the sector, 37% of total demand is consumed by industry, followed by residential use, and transportation (International Energy Agency (IEA) 2011). In the time period between 1998 and 2012, demand for diesel grew by 70%, and demand for LPG almost doubled. Currently, diesel is used in the largest quantities, followed by gasoline and LPG. Trucks are using the largest amount of diesel fuel. However, 56% of total consumption is due to passenger vehicles (Chlopek et al. 2012).
Influence of Russian-Ukrainian dispute on energy security
Dependency on Russian energy supplies is often cited as a threat to Central European energy security. Imports to the EU from Russia are dominated by crude oil and gas. Cuts of gas importation have happened before, e.g in 2009 during Ukrainian-Russian gas dispute. Moreover, Russia introduced a ban on imports of fruits and vegetables from Poland in 2014, depriving it of a major export market. Along with increasing crude oil prices and unstable political situation in Ukraine, the Polish citizens and government have opened their eyes, and urge securing energy safety issues. Currently, Europe is dependant on Russian energy
supplies and if there are any further unpleasant developments of the Russian-Ukrainian dispute, Poland might find it severely difficult to secure basic energy demand for both private users and companies.
Shale gas in Poland
The expansion of shale gas has a remarkable impact on the growth of importance of natural gas in the world’s structure of primary energy sources and it is projected that there will be a significant drop of price of this fuel (Baranzelli et al. 2015). It has been known for many years, that Poland has rich shale deposits. However, it was the technological innovations that led to the shale gas revolution in North America that opened up the possibilities, for these reserves to be commercially exploited. There are three areas, where the potential for commercial exploitation is located in Poland: Podlasie Basin (east and east-central), the Baltic Basin (northern) and Lublin (southeast) (Johnson and Boersma). The US EIA estimated that technically recoverable shale gas resources are roughly 187 tcf (5300 bcm), or nearly 900 times Poland’s 2010 consumption of gas. However, the Polish Geological Institute released in 2012 a draft assessment stating that this amount is much lower, estimating 1920 bcm of shale gas, of which somewhere between 350 bcm and 770 bcm is likely recoverable. The infrastructure for gas in Poland is not well developed. Only 54.6% of households currently have access to the gas network (Johnson and Boersma). Furthermore, most of the pipelines are located in industrial area of southwest Poland and around the main urban areas, but not necessarily in the areas where shale gas would be produced (Johnson and Boersma). Supreme Audit Office in Poland (Naczelna Izba Kontroli) has recently assessed the functioning of public administration and the business undertaken in connection with the exploration and identification of shale gas in Poland. In the period covered by the audit, search and exploratory activities of shale gas deposits were based on 113 concessions
covering nearly 30 percent of Polish territory. However, geological works performed by entrepreneurs proceeded only on a small part of the granted concession area and were often delayed. The reason for the sluggishness was not only economic and financial situation, but mostly from improper government action. What is more the administrative proceedings led by Minister of Environment on granting concessions for prospecting or exploration of shale gas were very unreliable and sluggish. Decisions were issued with an average 132 days, when law stipulated only 30 days for these actions (Forbes Poland 2012).
Four powerful companies have already resigned of further shale search in Poland. Among others American: ExxonMobil and Marathon Oil, Canadian Talisman Energy and French Total. One of the reasons was bureaucracy and extending the work on the new regulations (Supreme Audit Office in Poland (Naczelna Izba Kontroli) 2014).
3.4. Summary
This chapter has examined both the automotive and energy sector in Poland. This study was designed to conduct detailed qualitative analysis of the problems associated with AFVs in Poland.
The stakeholders of the analysis are: government, manufacturers and individuals. The three, core stakeholders are highly influencing each other’s. Taking into consideration the above, analysis of each of the stakeholders was conducted and in order to research government and manufacturers interviews with those entities have been carried out.
All of the above interviews provided insight into Polish automotive sector and confirmed the problems that were found during the research. Environmental issues are neglected in Poland, price of the vehicle is the most important reason influencing the purchase. Moreover,
introduction of incentive system for AFVs for both companies and private entities might spur the sales of the cars again.

![Figure 13 Estimated volume of new vehicle registrations through 2030 [thousands of units]](https://thumb-ap.123doks.com/thumbv2/123dok/1867158.2662895/70.892.114.764.121.446/figure-estimated-volume-new-vehicle-registrations-thousands-units.webp)
![Table 10 New car real running fuel consumption [MJ/km]](https://thumb-ap.123doks.com/thumbv2/123dok/1867158.2662895/72.892.113.779.297.514/table-new-car-real-running-fuel-consumption-mj.webp)
