www.elsevier.com / locate / econbase
Searching for a Kuznets curve in environmental efficiency
using kernel estimation
*
Fatma Taskin , Osman Zaim
Department of Economics, Bilkent University, 06533 Bilkent, Ankara, Turkey
Received 12 July 1999; accepted 8 February 2000
Abstract
The paper constructs environmental efficiency indexes for a sample consisting of high- and low-income countries using nonparametric production frontier techniques and then establishes an environmental Kuznets relationship for environmental efficiency by Nadaraya–Watson kernel estimation methodology. 2000 Elsevier Science S.A. All rights reserved.
Keywords: Environmental Kuznets curve; Kernel estimation; Nonparametric methods
JEL classification: Q25; Q32
1. Introduction
The increased awareness on environmental issues have initiated many studies to analyze the relation between economic growth and environmental degradation. In their pioneering study, Grossman and Krueger (1993) have shown that an inverted U-type relationship exists between the levels of emissions and income (i.e., environmental Kuznets curve). This implies that environmental degradation increases with income at lower levels of income and then decreases once a threshold level of per capita income is reached. In the theoretical literature, existence of environmental Kuznets curves are attributed to the constant or declining marginal utility of consumption, constant or
1
increasing marginal pollution damage and rising abatement cost at higher income levels.
All empirical studies (Grossman and Krueger, 1993, 1995; Selden and Song, 1994; Shafik, 1994) presented the inverted U-curve relationship as an empirical phenomena between measures of environmental performance and income without investigating the underlying mechanism that
*Corresponding author. Fax: 190-312-266-5140. E-mail address: [email protected] (F. Taskin)
1
Gruver (1976) and Selden and Song (1995) are examples of such studies.
generates growth and emissions of pollutants. To show the existence (or non-existence) of an inverted U-type relationship the common methodology adopted has been a trial and error approach where different polynomial functional forms are estimated to depict the statistically significant fit between some crude measures of environmental performance and per capita income (together with some control variables). The results empirically support the existence of environmental Kuznets curve for air pollutants such as suspended particulates and sulphur dioxide. While for water pollutants the results are mixed, for the specific air pollutant, carbon dioxide, the relationship with per capita income has been found to be monotonic, implying that carbon dioxide emissions increase as per capita income increases. Another drawback is that, in examining the changes in environmental quality, even though the focus is on the per capita income variable most of these studies employ cross-section data
2
consisting of only high-income countries.
In re-examining the environmental Kuznets curve relationship, our study improves over the previous literature in three aspects. First, following the studies that give emphasis to the transforma-tion of the productransforma-tion process and aim at quantifying the opportunity cost of adopting environmental-ly more desirable production processes (i.e., Fare et al., 1989), we recognise the underenvironmental-lying production process which converts the inputs into outputs and pollutants. Second, by using nonparametric Kernel regression techniques which do not require the pre-specification of functional forms prior to estimation, we estimate and examine an unknown conditional mean of environmental efficiency and let the data determine the exact form of relationship between efficiency and income variables. Third our sample includes countries both from the high-income and from low- and middle-income ranges.
The paper is organised as follows: the following section presents the derivation of environmental efficiency indexes. The third section is allocated to the presentation of the data source and discussion of environmental efficiency results using nonparametric regression analysis. Finally section four concludes.
2. Model
In the theory of production, it is common to assume that outputs are strongly disposable which implies that the disposal of any output can be achieved without incurring any cost in terms of reduced production of other outputs. However, the symmetric treatment of outputs in terms of their disposability characteristics looses its justification if one or some of the outputs produced are undesirable goods. Especially in regulated environments, where producing units are forced to clean up the undesirable outputs that they produce or forced to reduce their levels of undesirable output production, one has to treat undesirable and desirable outputs asymmetrically in terms of their disposability characteristics.
The environmental efficiency indexes are developed by comparing the production processes under alternative assumptions on disposability of bad outputs. One such environmental efficiency index developed by Fare et al. (1989) adopts a hyperbolic graph efficiency approach which seeks the maximum simultaneous equiproportionate expansion for the desirable outputs and contraction for the inputs and undesirable outputs. The essence of the method is to compute the opportunity cost of
2
transforming the production process from one where all outputs are strongly disposable to the one which is characterized by weak disposability of undesirable outputs.
The computation strategy involves measuring hyperbolic graph measure of technical efficiency score of a producing unit with respect to two technologies with alternative assumptions on the disposability of bads. First, by assuming a constant returns to scale strongly disposable output set as the appropriate description of the technology, for each producing unit, a maximum expansion or a
]
Œ
contraction factor ( G) is computed as a solution to a linear programming problem. This is a scalar by which one can expand the desirable output and contract the undesirable outputs and inputs simultaneously and still remain in the feasible set. We then compute an alternative expansion or
]
Œ
contraction factor ( V) with respect to a technology whose output set is characterized by weakly disposable bads for each producing unit in the sample. Finally, the environmental efficiency index, which shows potential desirable output loss which stems from reduced disposability of undesirable
] ]
Œ
Œ
output, can be obtained from the ratio of these two efficiency scores as H5 G/ V(see Appendix A for a description of the relevant linear programming problems used for the computation of hyperbolic
] ]
Œ
Œ
graph measure of technical efficiencies G and V).
Note that this measure takes a value 1 only for those producing which lie at the common facets of output sets constructed with different assumptions on the disposability of bads or for those producing units whose hyperbolic expansion fall on these facets. For producing units whose H index is less than 1, the index indicates that there is an opportunity cost due to aforementioned transformation. The opportunity cost expressed in terms of the percentage desirable output to be given up due to the reduced disposability of undesirable output can be measured as 12H. Therefore H can safely be used
as a measure of environmental efficiency.
3. Data and discussion of results
3
While computing the environmental efficiency indexes for each country , we chose aggregate output measured by real gross domestic product (GDP) expressed in international prices (in 1985 $US) as the desirable output and CO emissions (millions of tons) as the only undesirable output. The2 two inputs considered are aggregate labor input measured by the total employment and total capital stock. The input and the desirable output data are compiled from the Penn World Tables (PWT 5.6) initially derived from the International Comparison Program benchmark studies, where cross-country and overtime comparisons are possible in real values. Pollution-related data are obtained from Carbon Dioxide Information Analysis Center.
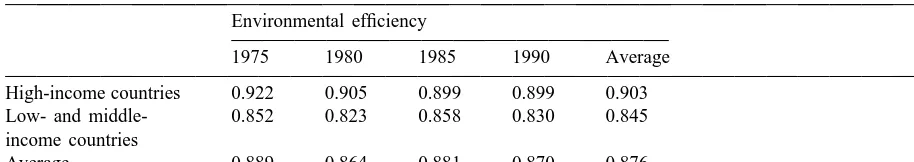
The environmental efficiency index is computed using the cross-section data on countries and this computation is repeated for each year between 1975 and 1990. The summary of the mean environmental efficiency scores for the selected years in Table 1 shows that there are differences in the environmental efficiency among the high-income countries and low- and middle-income countries. In accordance with the underlying hypothesis of environmental Kuznets curve, the high-income group found to be superior for all the years. The overall mean environmental efficiency index for high-income countries computed over the whole period, is 0.903, implying that the opportunity cost of
3
Table 1
Mean environmental efficiency indexes
Environmental efficiency
1975 1980 1985 1990 Average
High-income countries 0.922 0.905 0.899 0.899 0.903 Low- and middle- 0.852 0.823 0.858 0.830 0.845 income countries
Average 0.889 0.864 0.881 0.870 0.876
transforming the production process from one where all outputs (good or bad), are freely disposable to the one where pollution emissions are costly to dispose is 9.7% (1–0.903) of the average GDP in these countries. Corresponding figures for low- and middle-income countries are 0.845 and hence the opportunity cost of reduced disposability of bads is 15.5% of their average GDP. However, in terms of development overtime no significant change has been observed in neither of the groups.
In this study, the objective is to investigate if there exists an environmental Kuznets relationship between environmental efficiency scores and per capita income. Kernel nonparametric regression techniques, where no a priori restriction on the functional form and the degree of polynomial is imposed on the structure of the model, are utilized. Here, the assumption of a particular form for the conditional mean in the parametric estimation is replaced with the assumption that the conditional mean comes from a dense class of functional forms consisting of twice continuously differentiable
4
function. In this paper we use the Nadaraya–Watson nonparametric kernel estimator to depict the functional relationship between the environmental efficiency index H and per capita income.
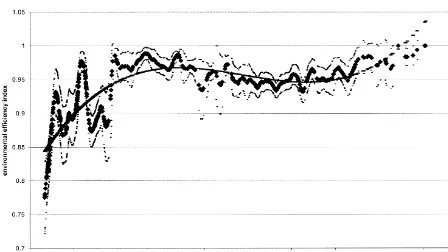
In the application of the nonparametric Kernel regression, we consider the environmental efficiency indexes, computed for 52 countries for 16 years, as the dependent variable and GDP per capita as the independent variable. Fig. 1 shows the results of the estimated conditional mean values of
5
environmental efficiency indexes obtained from nonparametric estimation. The curve has approxi-mately a third-order polynomial shape indicating improving environmental performance at the initial phases of growth (up to an income level of approximately $5000) which is followed by a phase of deterioration and then a further improvement once a critical level of per capita GDP (approximately $12 000) is reached. This is actually another representation of the environmental Kuznets curve relationship which mainly holds for countries at income levels of $5000 and over. For these countries the initial deterioration of environmental conditions and its improvement in latter stages of economic growth manifest itself as an initial decline and then an improvement of environmental efficiency as measured by our indexes. According to the figure, the variances of the estimated conditional mean values are lower at turning points which lead to narrower confidence intervals around threshold income levels and wider interval at other income levels.
4
In computing the nonparametric Kernel estimations, NPREG Versions 2.2 has been used. The program uses the Epanechnikov kernel for the kernel function (Racine, 1995).
5
6
Fig. 1. The estimated conditional mean of Kernel and cubic specification of the parametric regressions.
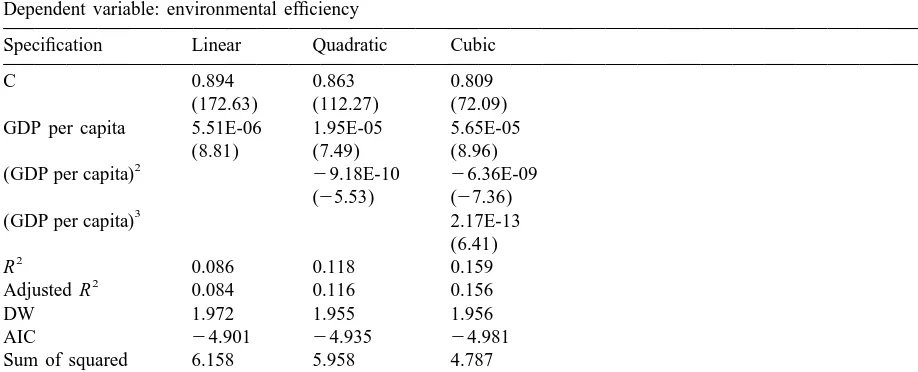
The most important advantage of the nonparametric estimation is to determine the shape of the functional form without going through a trial-and-error process. To provide a means of comparison, using the same data, we also conducted the parametric estimation of Kuznets curves for alternative functional form specification. Fig. 1 illustrates the fitted values of cubic parametric specification in addition to those obtained from kernel estimation. As can be seen from the graph and the regression
7
results reported in Table 2, cubic specification of the parametric regressions as was suggested by the
8
kernel method, describes the environmental efficiency the best. Note in Table 2 that, the statistically significant GDP per capita variables in all the alternative specifications may conceivably lead one to choose a form that is not correct if the choice criteria is solely based on the t-statistics.
4. Conclusion
In this paper, we first construct environmental efficiency indexes for a group of high-income and low- and middle-income countries between the years 1975 and 1990 by using a method proposed by Fare et al. (1989). We then establish the link between environmental efficiency and per capita income
6
The 95% lower and upper confidence bounds are plotted for estimated conditional mean of the Kernel estimation.
7
In the cubic specification of the Kuznets curve, the fitted values of efficiency are not bounded from above and are greater than one at the high end of the income spectrum as can be seen in Fig. 1. However, in kernel estimation the values of the estimated conditional means are bounded from above by unity in accordance with the theoretical formulations.
8
Table 2 GDP per capita 5.51E-06 1.95E-05 5.65E-05
(8.81) (7.49) (8.96)
2
(GDP per capita) 29.18E-10 26.36E-09 (25.53) (27.36)
Sum of squared 6.158 5.958 4.787 residuals
using the Nadaraya–Watson kernel estimator where there is no requirement for the choice of a particular form for the conditional mean. With this nonparametric regression estimation we are able to determine a cubic functional form for the relationship between environmental efficiency and GDP per capita without an a priori assumption.
Appendix A
] ]
Œ
Œ
For each producing unit k9, G and V can be computed as the solution to the two linear programming problems. For a technology that assumes strong disposability for the undesirable outputs the problem
W k9 k9 k9
F (x , y , w )g 5minV
subject to
T k
9
Z M$y T k9
Z J5Vw (LP 2)
T k9
Z N#Vx T K Z [R1
are solved. Notationwise, Z is an intensity vector; M, N, J are matrices of desirable output levels,
k k k
undesirable output levels and input levels whose k,i-th elements are y , w and x , respectively.k i i
References
Fare, R., Grosskopf, S., Lovell, C.A.K., Pasurka, C., 1989. Multilateral productivity comparisons when some outputs are undesirable. The Review of Economics and Statistics 71, 90–98.
Gruver, G.W., 1976. Optimal investment in pollution control capital in a neoclassical growth context. Journal of Environmental Economics and Management 5, 165–177.
Grossman, G.M., Krueger, A.B., 1993. Environmental impacts of a North American Free Trade Agreement. In: Garber, P. (Ed.), The US Mexico Free Trade Agreement, MIT Press, Cambridge, MA, pp. 165–177.
Grossman, G.M., Krueger, A.B., 1995. Economic growth and the environment. Quaterly Journal of Economics 110 (2), 353–377.
Racine, J., 1995, NPREG@ Version 2.2 Nonparametric Kernel Regression Software: Users manual mimeo, University of South Florida.
Selden, T., Song, D., 1994. Environmental quality and development: Is there a Kuznets curve for air pollution emissions? Journal of Environmental Economics and Management 27, 147–162.
Selden, T., Song, D., 1995. Neoclassical growth, the J-curve for abatement, and the inverted U-curve for pollution. Journal of Environmental Economics and Management 29, 162–168.
Shafik, N., 1994. Economic development and environmental quality: an econometric analysis. Oxford Economic Papers 46, 757–773.