Disturbance & Recovery of Forest Patch
Lilik B.PRASETYO1, Masayoshi TAKAHASHI2, and Hideki SAITO2
1) Forestry Faculty & Center for Environmental Research, Bogor Agricultural University, INDONESIA 2) Forestry & Forest Product Institute, JAPAN
Keywords : disturbance, forest recovery, land cover change, fragmentation, Leaf Area Index, hemispherical view
INTRODUCTION
Factors that contribute to wildlife extinction are forest habitat conversion and fragmentation (Pattanavibool & Dearden, 2002; Christiansen & Pitter, 1997; Kattan, Lopes and Giraldo, 1994).
Both of them is due to disturbances such forest fire, agricultural expansion, forest plantation, settlement development and infrastructure development. Recovery of fragmented forest or forest patch is depending on the magnitude and frequency of disturbance. Huge and often disturbance will have bigger impact on recovery then small and rare disturbance. The study aim at identifying disturbance and recovery process by using Landsat satellite data couple with field data and High resolution (Quick bird & Ikonos) data.
METHODOLOGY Study area
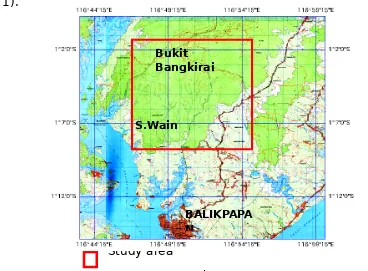
Study area is situated at S.Wain Protected forest & Bukit Bangkirai and its surrounding areas
(Fig. 1).
Study area
Figure 1. Study area BALIKPAPA N
Material
Data utilized were aerial photos taken in November 1981, Landsat data acquired in 11 February 1992, 26 January 1998, 11 February 1998, 11 December 1998, 13 January 2002, and 8 March 2007.
Flow of research
Disturbance & recovery process during the research period (1981-2007) was analyzed based on classification of aerial photos and Landsat satellite. As a reference, Quickbird & Ikonos image were used as well as ground truth data. The next step is to perform supervised classification, and spatial analysis to produce disturbance and recovery map of the area. Further analysis on vegetation diversity of surrounding patch with regard to LAI was performed (Fig.2). Transect line of vegetation inventory is presented in Fig.3.
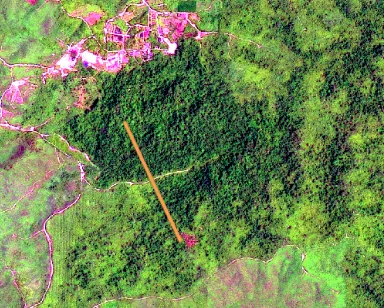
Inventory was directed to collect information on of species number along the transect and HemispericalView.
Transect line was situated across remnant forest and recovery forest (Fig.3).
Aerial
Ground Truth & Supervised Classification
Figure 2. Flow chart of study
RESULT AND DISCUSSION
a. Deforestation
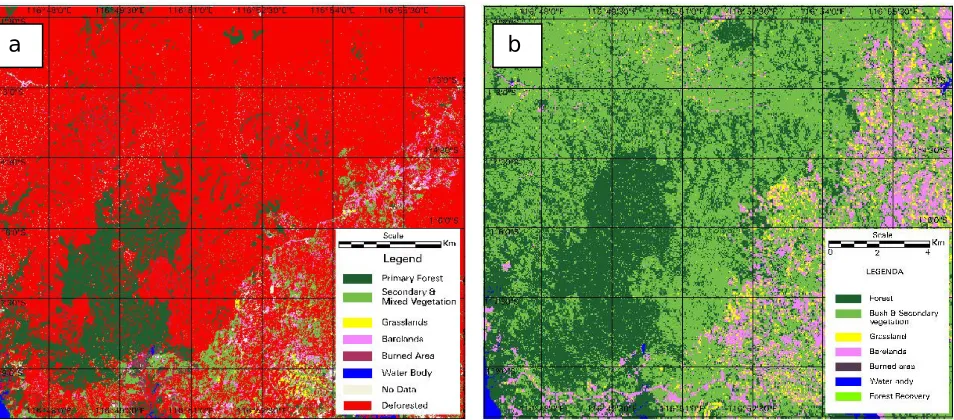
In 1981 most of the area dominated by primary forest, and then fragmented by Plantation forest and agricultural expansion. In December 1998 during the El Nino period huge fire have occurred and devastated most of remnant forest. As a result primary forest were reduced & fragmented. (Fig.4). In comparison with SPOT data in 2005, it looks that process of recovery is very slow. It is due to some probabilities, such as (a) there is no any seed left in the soil after forest fire, or (b) there is no any dispersal agent to disperse the seed (Fig. 5).
a
c
d
Figure 4. (a) Land cover in 1981, (b) Land cover in 1992, (c) Land cover in February 1992, (d) Land cover in December 1998.
a
b
Field data inventory analysis of burned forest patch area in 2008 showed that LAI derived from hemispherical view photographs (Fig. 6a) & species diversity were lower than remnant forest (undisturbed forest) (Fig. 6b). The result suggested that enrichment planting is urgently needed to speed up recovery process of burned area.
Reference
Christiansen & Pitter, 1997. Species loss in a forest bird community near Lagoa Santa, in South Easthern Brazil Biology Conservation, 80(1997) 23-32
Kattan, Lopes and Giraldo, 1994). Forest Fragmentation and Bird Extinctions: San Antonio Eighty Years Later. Conservation Biology, Pages 138-146, Volume 8, No. 1, March 1994 Pattanavibool & Dearden, 2002. Fragmentation and wildlife in montane evergreen forests,
northern Thailand. Biological Conservation 107 (2002) 155–164
Figure 5. (a) Deforested area between 1981 – 1998, (b) Recovery area between 1998 - 2005
a b
a b