SMALL NODULES LOCALIZATION ON CT IMAGES OF LUNGS
E. V. Snezhko a, S. A. Kharuzhyk b, A.V. Tuzikov a, V. A. Kovalev a
a
UIIP, United Institute of Informatics Problems, 220012 Minsk, Belarus – [email protected] b
N.N. Alexandrov National Cancer Centre of Belarus, Lesnoy, Belarus
KEY WORDS: Computed Tomography, Lungs, Solitary Pulmonary Nodules, Segmentation, Localization
ABSTRACT:
According to the World Health Organization (WHO) lung cancer remains the leading cause of death of men among all malignant tumors [1, 2]. One of the reasons of such a statistics is the fact that the lung cancer is hardly diagnosed on the yearly stages when it is almost asymptomatic. The purpose of this paper is to present a Computer-Aided Diagnosis (CAD) software developed for assistance of early detection of nodules in CT lung images including solitary pulmonary nodules (SPN) as well as multiple nodules. The efficiency of nodule localization was intended to be as high as the level of the best practice. The software developed supports several functions including lungs segmentation, selection of nodule candidates and nodule candidates filtering.
1. INTRODUCTION
During the last decades noninvasive observation methods of lung cancer based on X-ray radiology and Computed Tomography (CT) have led to substantial advance in diagnosis quality of oncological patients. Recent advances of mathematical methods of image processing and analysis have resulted in implementation of computer-assisted software for improved lesion detection in lungs. Such software provides a “second opinion” for radiologists reducing the time consuming and weary monotonous operations.
It is evident that the efficiency of lung cancer treatment may be improved by means of automation and advances of early diagnostics, integrating data collected on various stages of patients’ observations. This is especially the case for such noninvasive techniques as radiological observations [3, 4]. The main motivating stimuli for this work were the following: information-driven assistance of physicians’ practical activities, supporting biomedical investigations by advanced adequate mathematical methods and techniques, development of a computer-assisted tool for situation of uncertainty.
2. RELATED WORKS
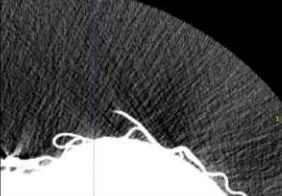
Computer-assisted tools for automated nodule detection have been developed during the past decades [5, 6]. Usual procedure for nodule detection and localization consists of to the following steps: image preprocessing (filtering), lungs segmentation, nodule candidates’ detection and nodules classification. The preprocessing step is mainly related with noise suppression, which could be not easy one if we consider radial noise caused by the Computed tomography equipment during imaging [7] (Figure 1).
Figure 1. Example of radial noise on CT
The lungs segmentation is the second standard step, which traditionally have been performed as a sequence of thresholding, masking and mathematical morphology operation. This approach will be described below. The other option became available recently is utilization of convolution neural networks, when a trained network is able to segment lungs in a few seconds [8].
Nodule candidates detection and candidates’ filtering is the area for research. Correct feature development and strategies for False Positives reduction remains the challenging task. That’s why a number of relevant Competitions being carried out during the last decade: ANODE09 [9], LUNA16 [10], Data Science Bowl 2017. We could note that DeepLearning approach becomes to be more popular for features extraction and candidates’ filtering due to availability of large public databases. Some of them are annotated, thus providing great resources for automated features extraction.
3. MATERIALS
In this study we used CT lung images of 87 patients with lung nodules collected at the N.N. Alexandrov National Cancer Centre of Belarus. CT scanning was performed on multi-slice scanners with the standard kV and mA settings during the one-breath hold. The voxel size of tomograms was in the range of 0.65-0.74 mm in the axial image plane with the slice thickness equal to the inter-slice distance varied from 1.25 mm to 3 mm. CT images contained from 104 to 407 slices. Target size of nodules varied from 4 mm to 56 mm. The expert radiologist found 173 nodules on these 87 CT scans. Solitary pulmonary nodules were present on 82 CT scans. Multiple nodules (from 7 up to 21) were present on 5 CT scans. No intravenous contrast agent was used before the acquisition of scan data.
4. LOCALIZATION OF NODULES 4.1 Lung segmentation
A number of modern lung image processing techniques utilize either manual segmentation or process the whole image without separation lungs from the outer tissues and other objects. Since CAD software for the particular task of nodule detection in lungs implies processing and analysis of considerably large volume of radiological images, fully automatic lungs segmentation is the prerequisite of all the process.
Commission II, WG II/10
The International Archives of the Photogrammetry, Remote Sensing and Spatial Information Sciences, Volume XLII-2/W4, 2017 2nd International ISPRS Workshop on PSBB, 15–17 May 2017, Moscow, Russia
This contribution has been peer-reviewed.
Main stages of lungs segmentation were described in [11]. The adaptive thresholding to the whole 3D CT image is applied at the first step. Adaptive thresholding computes thresholding level using an iterative process. Let i
T be a thresholding level at iteration
i
, andμ
b,μ
n are the mean values in Hounsfieldunits (HU) of the “inner” part (voxels with higher or equal values than i
T ) and “outer” part (voxels with lower values than
i
T
) of the image respectively. Then at iteration i+1 thresholdvalue is calculated as
2
1 b n
+
i = μ +μ
T . This procedure stops at
the iteration c when c c 1
T =
T . The initial value of
T
0 was set 10 HU. After termination of the iterative process the 3D image mask is obtained with values 0 corresponding to “outer” voxels of the CT image and 1 – to “inner” voxels of the image. The example of an initial CT image and the resulting image mask is depicted in Figure 2.Figure 2. Initial image (left) and the resulting image mask (right) after adaptive thresholding of the initial image
On the next step we invert values of the mask (ones to zeros and
vice versa, Figure 3, left) obtained after thresholding and fill holes of the mask. As a result of this operation the mask will contain several connected components, including the largest one corresponding to the body of a patient (Figure 3, right). The other connected components are removed on the next step of the segmentation process, when we extract only the largest component (Figure 3, bottom).
Figure 3. Extraction of body mask in a CT image
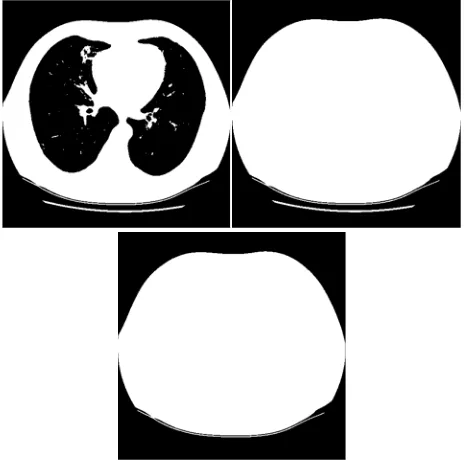
Applying AND logical operation to the inverted mask from Figure 3, bottom and the mask from Figure 1, right, one obtains the mask which corresponds only to the lungs on the initial CT image (Figure 4, top). However, this mask contains a lot of
small holes, scratches and other defects and therefore is not very appropriate for searching nodules. To improve the mask, mathematical morphology operations “opening” and “closing” were applied. The resulting mask is depicted on Figure 4, middle, and the lungs segmented on the initial CT image are shown on Figure 4, bottom.
Figure 4. Draft lungs mask (top); smoothed lungs mask (middle); segmented lungs on the CT image (bottom)
4.2 Detection of nodule candidates
Since “large” and “small” nodules manifest themselves on CT images in a bit different way, all the following stages of nodule candidates selection and further filtering are performed in two passes with different presets.
The initial selection of nodule candidates is performed by thresholding of the segmented lungs followed by morphological “opening” and “closing” operations. For “small” nodules the thresholding level was set to -400 HU, and the radius of a structuring element for morphological operations equals to 2 voxels. The corresponding presets for “large” nodules were equal to -150 HU and 3 voxels. Then connected components are extracted and labelled by their indexes. All the connected components are assumed as nodule candidates at this stage and are called “blobs”. The following geometry and intensity parameters are calculated for each candidate: volume (number of voxels related to blob); minimum and maximum coordinates of voxels along all three axis X, Y and Z; coordinates of blob centre; lengths of principal axes of inertia ellipsoid; ratio of blob volume to a bounding volume; number of voxels on the surface of a blob (surface area); ratio of surface area to the blob volume; average voxel intensity inside every blob; variance of voxel intensity inside every blob. All these parameters are necessary for further filtering of nodule candidates.
4.3 Nodule candidates filtering
The procedure of nodule candidates filtering is applied to the list of blobs having a number of precalculated geometry and intensity parameters. Filtering is based on a set of decision rules, which define thresholds for blob parameters. Thresholds were chosen differently for “small” and “large” nodule candidates. They relate to lower and upper blob volume values,
The International Archives of the Photogrammetry, Remote Sensing and Spatial Information Sciences, Volume XLII-2/W4, 2017 2nd International ISPRS Workshop on PSBB, 15–17 May 2017, Moscow, Russia
This contribution has been peer-reviewed.
lower lengths in axial plane, lower depth limit, lower limit for ratio of nodule volume to the volume of the estimated ellipsoid of inertia, lower limit for ratio of nodule surface area to the volume, lower limit for ratio of minimum to maximum radii of the ellipsoid of inertia, lower limit for average intensities of voxels related to a nodule. If one of these parameters for some nodule candidate is out of a corresponding threshold value being specified, then this blob is excluded from the list of candidates. Usually a several dozen nodule candidates of initially hundreds remain after this step.
After that region growing algorithm is applied for each of the remaining blobs. This is done to ensure that a part of some vessel or other large objects with irregular structure will not pass the filtering stage. So the additional blobs verification is performed: if volume of some blob increases more than 2.5 times, this blob is removed from consideration. Finally, we remove duplicates from the list of blobs, i.e. if any two blobs intersect, the smallest one is removed of the list.
After the filtering stage one gets a list of blobs with detailed information about them (voxel coordinates, geometry and intensity parameters) which could be used further at visualization and analysis stages.
5. IMPLEMENTATION AND RESULTS 5.1 Software implementation
The CAD software was implemented in C++ using fltk library for user interface, dcmtk library for DICOM series import/export and VTK library for data visualization in working windows.
During the working session a user should first import a DICOM series by selecting “File” →“Open DICOM series” menu items. After import a “Pulmonary Nodule” tab should be selected on the main panel. The corresponding elements will appear on the main panel, including the button “Run”. User should start the nodules detection procedure. The progress bar on the bottom of the main panel shows a current progress of the procedure. On completing of the detection procedure the list of the nodules localized will be shown on the main toolbar (Figure 5). User may perform the final correction of the list of localized nodule by removing the false positives. It should be noted from our experience that the number of false positive nodules candidates exceed the number of nodules of interest for the case of solitary pulmonary nodules and multiple nodules. Then a radiologist can verify the regions of interest proposed by the CAD software, and not the whole image volume what makes the observation process more efficient.
Figure 5. Main panel of the CAD software in “Nodule detection” mode
While doing manual nodules filtering it is possible to calculate the statistics on nodule parameters and estimate the probability of malignancy of localized nodules using a heuristic based not only on geometrical/texture features, but also on age, gender, family history, solidity etc. (Figure 6).
Figure 6. The dialog with nodule parameters and estimated probability of malignancy
5.2 Results
The algorithm on pulmonary nodules detection was tested on a set of 87 CT scans. An expert radiologist reviewed all the images carefully in advance and detected 173 nodules. The proposed algorithm detected 123 true positive (TP) and 179 false positives (FP) findings. Thus, sensitivity (recall) of the nodule detection algorithm was TPR=TP/( TP + FN )= 123/173 = 71.1%. Ratio of FP and TP findings was equal to 173/123=1.46. The most often reason for false positive findings were joins between nodules and pleura, mediastinal and peripheral vessels, mediastinal contour, and septum between lungs. At the same time, the algorithm found additional nodules on 10 CT scans which were not detected by the expert radiologist. As for the computational speed, the image processing of one CT scan typically took from 110 to 350 seconds depending on number of axial slices. The mean value of the image processing time was about 3.25 minutes.
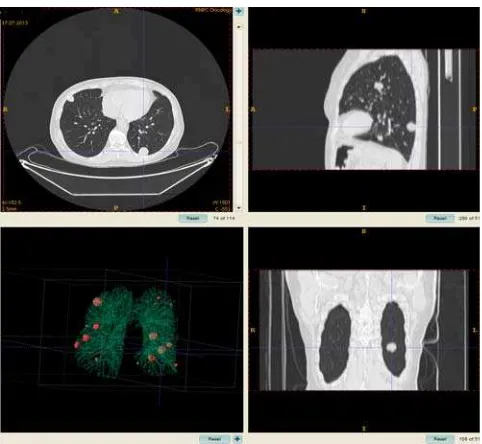
Figure 7. Example of multiple nodule detection on a CT scan using the algorithm proposed
The International Archives of the Photogrammetry, Remote Sensing and Spatial Information Sciences, Volume XLII-2/W4, 2017 2nd International ISPRS Workshop on PSBB, 15–17 May 2017, Moscow, Russia
This contribution has been peer-reviewed.
Due to significant difference in nodule number between different CTs which could be varied between 1 and 21 numbers, the two groups of CT scans were distinguished: the scans with small amount of nodules (from 1 to 4) and the ones with multiple nodules (from 5 and more). The 82 CT scans were included into the first group. The expert radiologist detected 115 nodules on these scans, and the proposed algorithm detected 89 TP findings and 177 FP findings. Finally, the sensitivity of the algorithm was TPR = 77.4%. The ratio of FP to TP findings was 1.98. There was also a subgroup of 60 scans with a solitary (single) pulmonary nodule. The statistics for this subgroup is as follows: TPR = 90.0%, FP/TP = 2.31. The multiple nodules (Figure 7) were present on 5 CT scans with 5, 6, 7, 19 and 21 nodules respectively, 58 in total. Finally, we may report that the proposed algorithm detected 34 TP and 2 FP findings, i.e. sensitivity on this group of scans was 58.6% and ratio of FP to TP findings was 0.06.
ACKNOWLEDGEMENTS
This work was supported by the National project IT11/4-04 (Belarus).
REFERENCES
Ferlay, J., [et. al.], 2013. GLOBOCAN 2012 v1.0, Cancer Incidence and Mortality Worldwide: IARC CancerBase, 11, Lyon, France: International Agency for Research on Cancer.
Siegel R, Ma J, Zou Z, Jemal A. Cancer statistics, 2014. Ca-Cancer J Clin. 2014;64:9–29.
van Ginneken, B. [et. al.], 2011. Computer-aided diagnosis: how to move from the laboratory to the clinic. Radiology, 261, pp.719–32.
Kharuzhyk, S. [et al.], 2011. Computer-assisted diagnosis of nodular lesions in the lung. Voprosi Onkologii, 57(1), pp. 25-35.
Ambrosini, V. [et al.], 2012. PET/CT imaging in different types of lung cancer: an overview. Eur J Radiol, 81, pp. 988-1001.
Madero Orozco H., [et. al.], 2015. Automated system for lung nodules classification based on wavelet feature descriptor and support vector machine. BioMedical Engineering, 14(9), ISSN 1475-925X (online).
Kak, A., Slaney, M, 2011. Principles of Computerized Tomographic Imaging: Chapter 5: Aliasing Artifacts and Noise in CT Images. Society of Industrial and Applied Mathematics. 344p.
Kalinovsky, A., Kovalev V., 2016. Lung Image Segmentation Using Deep Learning Methods and Convolutional Neural Networks. Proc. on XIII International Conference on Pattern
Recognition and Information Processing. Minsk,October 3-5,
2016.
van Ginneken, B. [et.al.], 2010. Comparing and combining algorithms for computer-aided detection of pulmonary nodules in computed tomography scans: the ANODE09 study. Medical
Image Analysis, 14, pp.707-722.
Setio, A. [et.al.], 2016. Validation, comparison, and combination of algorithms for automatic detection of pulmonary nodules in computed tomography images: the LUNA16 challenge. CoRR (online)
Hu, S. [et al.], 2001. Automatic Lung Segmentation for Accurate Quantitation of Volumetric X-ray CT Images. IEEE
Transactions on Medical Imaging, 20(6), pp. 490-498.
Revised March 30, 2017
The International Archives of the Photogrammetry, Remote Sensing and Spatial Information Sciences, Volume XLII-2/W4, 2017 2nd International ISPRS Workshop on PSBB, 15–17 May 2017, Moscow, Russia
This contribution has been peer-reviewed.