EXTENDING THE SCALABILITY OF ISTSOS WITHIN THE 4ONSE PROJECT
D. Strigaroa*, M. Cannataa, M. Cardosoa, M. Antonovica, M. Hoffmanna
a IST-SUPSI, Institute of Earth Sciences, University of Applied Sciences and Arts of Southern Switzerland, via Trevano CH-6952
Canobbio, Switzerland – (daniele.strigaro, massimiliano.cannata, mirko.cardoso, milan.antonovic, marcus.hoffmann)@supsi.ch
Commission IV, WG IV/4
KEY WORDS: istSOS, istSOS-proxy, EMS, WNS, Big data, SOS, scalability, 4onse
ABSTRACT:
An Environmental Monitoring System (EMS) is needed not only to prevent many natural risks such as droughts, flooding and landslides but also to provide information for a better management of water resources and crops irrigation and finally it helps to increase the reliability of weather and climatological models. In addition, a monitoring system can directly impact the economic, social and political spheres. Unfortunately, in most developing and low income countries, due to the high costs of hardware and software there is a lack of efficient monitoring systems. The aim of the 4onse project (analysis of Four times Open Non-conventional system for Sensing the Environment), funded by the Swiss National Science Foundation, is the development of a totally open solution to monitor the environment. As well as the hardware layer, a monitoring system needs a data management software usually hosted on a server structure. As a software platform which is SOS OGC compliant, istSOS is chosen to receive, manage, validate and distribute environmental data. In the following article a solution to support big data is presented to extend the istSOS capabilities. In fact, a sensors network can hardly stress a data management system because of the several concurrent users and sensors and the long time series which every weather station can easily produce. Thus, a software called istSOS-proxy is developed as a single access point over multiple instances of istSOS whose procedures are distributed to balance the total load. First results on the effectiveness of the solution are proved thanks to load testing simulations of different levels of concurrent users.
1. INTRODUCTION
The systematic sampling of air, water, soil and biota data, as well as the development of an Environmental Monitoring System (EMS) leads to information on the state of the environment and knowledge on hazardous processes (Artiola et al. 2004, Wierma, 2004). Thus, an EMS affects socio-economical aspects as well as the policy of the decision-makers (Kiker et al., 2005).
Most developing and low income countries have a poor, old or even totally absent monitoring systems mainly due to high costs of acquisition and maintenance process of hardware and software components (Snow, 2013). In addition, the conventional systems are characterized by proprietary and closed source components which reflect a low interoperability for the data transmission/exchange and poor flexibility for system customization.
The 4onse project (analysis of Four times Open Non-conventional system for Sensing the Environment) wants to develop a non-conventional solution with an high interoperability and low cost standards using open hardware and open source software to monitor and sense the environment for lowering the impact of natural hazards in developing countries. The project, funded by the Swiss National Science Foundation (SNSF) and coordinated by the Institute of Earth Science (IST) of the the University of Applied Sciences and Arts of Southern Switzerland (SUPSI), in collaboration with the University of Moratuwa (UoM), Sri Lanka and other international partners (see http://4onse.ch) tries to reach the project goal installing a fully operating monitoring system composed by 30 weather stations distributed in a test area in Sri Lanka. The Oya basin, the fourth largest river basin in Sri Lanka, has been selected as test area. At present, this area suffers from issues like floods and droughts. Due to the absence of real time, dense and continuous
meteorological data, disaster warning is truly a challenging task in this region.
The EMS consists of different layers: the hardware layer, composed by the sensor unit; the service layer, composed by the server architecture to store, validate and share data; the communication layer, which enables the data transmission between hardware and the software layer. This article focuses on the problems and solutions found during the design and development of the service layer.
prove the effectiveness of the whole system simulating different levels of concurrent users.
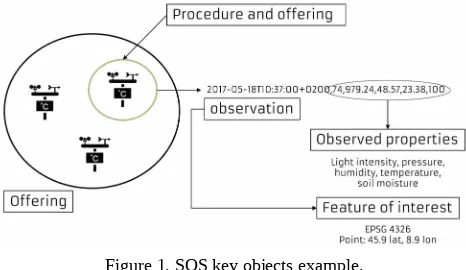
The paper is divided into three sections: 1) the description of the materials and methods used; 2) the presentation of the test standards applicable to an EMS. The standard is based on five key elements (Figure 1): the procedure is the SOS element that produces observations which are the values measured in a specific time instant related to a feature of interest (for example the position of the related procedure like the geolocalization of a weather station); the observed property defines the environmental parameter measured (e.g. air temperature, air humidity, etc.) and finally the offering, which is usually referred to a single procedure, but can be also a group of procedures with a common domain, specifies summary information.
Figure 1. SOS key objects example.
This standard defines a series of requests, divided in classes, to manage sensor networks and their observations. The Core main requirements class (Bröring et al., 2010) is composed by:
• the GetCapabilities operation: it provides access to the SOS general information such as the list of the operations implemented, the procedures, offerings, unit of measures available within the service, etc.;
• the DescribeSensor: it returns the description of a transactional operations to insert/delete a sensor or observation.
2.2 istSOS
The istSOS package provides a complete and tested platform to manage sensors data according to the SOS standard (Cannata et al., 2010). It is composed by a server and a client side. The server side of the application is entirely written in Python (Van Rossum, 2003) and relies on the Apache HTTP server (The Apache Software Foundation, 2013). The database structure is based on PostgreSQL with the PostGIS spatial extension. The client side of the application is completely written in Javascript and takes advantage of the ExtJS library
(https://www.sencha.com/products/extjs), the dygraph library (http://dygraphs.com) and CodeMirror 2 (http://codemirror.net). The istSOS package comprises a nested architecture (Figure 2) composed by three main components: 1) the istsoslib, the kernel of the system, enables the implementation of the SOS standard; 2) the walib offers the classes and functions required to build the web interface; 3) the wainterface is the user-friendly interface to manage the system.
Figure 2. The software architecture of istSOS.
2.3 Scaling techniques
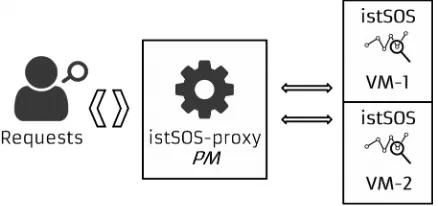
Big data are a great challenge to face off both for hardware and software components. For this reason, a system needs to adapt itself to increasing requests incorporating scaling in different forms (Singh et al., 2015). Two types of scaling could be considered: vertical and horizontal scaling. Vertical scaling means, basically, increasing the hardware specifications of the server (more and faster CPUs, RAM and storage units). The hardware configuration acquired and horizontal by applying a sharding method to split massive time-series across multiple guaranteed. To this end, in view of having a system capable to support large number of concurrent users and massive datasets while maintaining good performances, a lighting fast cascading proxy server, named istSOS-proxy, for multiple instances of istSOS is designed and developed. This solution integrates big data support with the abilities to scale horizontally over distributed databases of time series. It basically consists in a layer capable to redirect SOS requests and collect the responses to and from different istSOS instances in a cloud. The solution offers a unique access point to retrieve observations and metadata of different Wireless Sensor Networks (Figure 3). In addition, thanks to this layer, it is possible to handle several concurrent users by using non-blocking network I/O (solving tasks asynchronously) to scale many open connections. As a requirement, at this stage of development the mandatory SOS requests are supported.
The istSOS-proxy is composed by two main services:
• api : a RESTful service which can be used to configure the database connection and add istSOS instances;
• sos : a web service compliant with the SOS version 1.0.0 and 2.0.0 core profiles.
Figure 3. Schema of how istSOS-proxy works.
2.5 Load testing configuration
The solution proposed to support big data within istSOS is preliminary validated performing a number of load tests. The open source load testing python tool, called Locust.io (http://locust.io/), provides an effective way to simulate several simultaneous users and figure out how many concurrent users a system can handle.
As shown in Figure 4, three Virtual Machines (VMs) (VM-0, VM-1 and VM-2) with Ubuntu 16.04 64bit are built with the same hardware specifications (Table 1) and software components (Apache 2.4.18, PostgreSQL v9.5/PostGIS v2.2.1 , istSOS v2.3.1).
Hardware component Number/Size
CPUs 12
RAM 12 GB
Hard Disk 300 GB SSD
Table 1. Virtual machines hardware characteristics.
The first VM (VM-0) has a database composed by 130 procedures, 1 offering, 13 observed properties and 25 years of data for a total of 1.4 Billions of observations and 167 GB of database size. A copy of the database is then distributed into two more databases each hosted on a different virtual machine. The configuration process has, as result, the virtual machines VM-1 and VM-2 with 65 procedures each one and the same amount of offering and observed properties registered in the VM-0. The resulting databases have different sizes because the procedure created does not have the same amount of observations. The VM-1 has about 0.6 Billions of observations, the VM-2 0.7 Billions. This situation represents a real case study where even if the procedures are equally distributed on the istSOS instances, the amount of observations will be most probably different due to the heterogeneity of the sensors specifications (frequency of measures, lifetime interval, etc.).
Figure 4. Schema of the VMs built to run the load test.
Finally, the istSOS-proxy is installed on a fourth Proxy Machine (PM) using Ubuntu 14.04 64bit as operating system, an Intel® Core™ i7-5820k processor and 32 GB of RAM. Even if this is a very powerful machine, as described in the previous paragraph, istSOS-proxy does not require such powerful resources because it is composed by a light database and simple processes which basically validate the requests and forward them to the corresponding istSOS. Finally, the responses are parsed, mixed and sent to the client.
Thanks to the istSOS-proxy REST services, the software is configured to host the two istSOS instances, installed respectively on the VM-1 and VM-2, gotten by distributing the original database of the VM-0. The figure 5 shows an overview of the configuration.
Figure 5. istSOS-proxy configuration.
The load test is thought to have three load levels: 100, 200 and 500 concurrent users load. In this way, the simulated users are able to perform the SOS core requests (GetCapabilities,
DescribeSensor and GetObservation) on the basis of a predefined weight which defines the frequency of executing a specific request. The GetObservation request is executed 50 times more than a GetCapabilities, the DescribeSensor only 5 times more. The weights assignation helps to create a real scenario where observations are often requested instead of service or sensor description. The GetObservation is set to request a random week of data of a single procedure.
The three load levels are sequentially run both for the VM-0 and PM for a time interval of about one hour, in order to have statistically rigorous results.
3. RESULTS AND DISCUSSION
The load test results regard the SOS core requests:
GetCapabilities, DescribeSensor and GetObservation.
While the SOS version 2.0.0 is used for the GetCapabilities and
times lighter than the version 2.0.0 where observations are explicitly not aggregated in a time-series object which is lagerly less verbose. Each GetObservation request gets one casual week of data of a randomly selected procedure available within the istSOS instance.
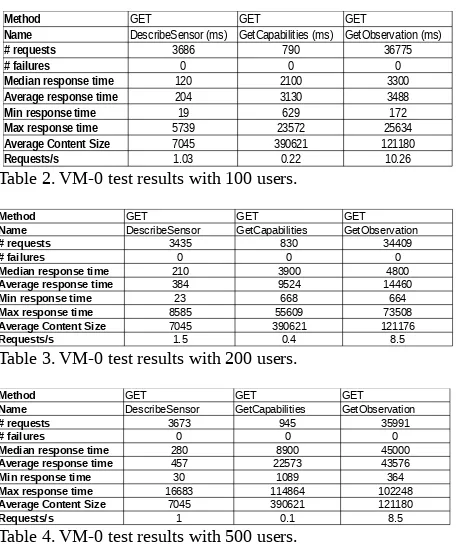
3.1 Results and discussion of VM-0 load test
The tables 2, 3 and 4 give an overview on the performances of the VM-0 (see the previous section for the configuration of this machine). In the first scenario using 100 concurrent users, the total requests have an average time of less than 3.2 seconds. The
DescribeSensor average response time is 0.2 seconds for 100 and around 0.4 both for 200 and 500 data users. It is the fastest request because the software can easily find the information of the procedure and send them back to the user, thanks to a partially pre-processed response. On the other hand,
GetCapabilities and GetObservation are more dynamic processes. The first has to retrieve the basic information of all the metadata procedures and the second has to perform queries on the bigger table of the database where all the procedure observations are archived.
From 200 concurrent users, the performances begin to significantly decrease in particular for the GetObservation
request which reaches an average response time of about 14 seconds, in the case of 200 concurrent users, and 43 seconds with 500 concurrent users.
The GetCapabilities time responses are, as expected, in between the DescribeSensor and GetObservation results.
Table 2. VM-0 test results with 100 users.
Table 3. VM-0 test results with 200 users.
Table 4. VM-0 test results with 500 users.
3.2 Results and discussion of PM load test
The results of the PM load test are shown in the Tables 5, 6 and 7. The GetCapabilities response time is extremely fast mainly because, once an istSOS instance is added, deleted or updated, it is built and stored in-memory by istSOS-proxy. For this reason, the response is much more reactive and help in decreasing the shared load over the instances of the other requests.
The DescribeSensor does not show any significant degradation, thus the mean response time is below 1.3 seconds also during
the test with 500 concurrent users. This procedure does not require hard processes and calculation to be performed, thus it maintains a good level of time responses even when the work load increases.
The GetObservation average time response is 0.6, 6.8 and 19.9 seconds respectively for 100, 200 and 500 users. The performances consistently decrease up to 500. In this case, the median is 23 seconds, about 3 seconds higher than the average, which confirms the high stress reached by the server structure with the hosted istSOS instances.
As for the VM-0 load test, there are no registered failures, which means a good software stability both for istSOS and istSOS-proxy.
Table 5. PM test results with 100 users (using istSOS-proxy).
Table 6. PM test results with 200 users (using istSOS-proxy).
Table 7. PM Test results with 500 users (using istSOS-proxy).
3.3 The comparison between VM-0 and PM results
Starting from the total number of requests solved by the two different configurations (Figure 6), it is possible to show that the PM resolves the SOS requests faster. In one hour, the VM-0 solves from 36000 simulating 100 data users to 42000 requests simulating 500 users, while the PM from 60000 to over 70000 when 500 concurrent users are simulated. The result is achieved thanks to the istSOS-proxy capability to scale better over multiple connections together with the faster request resolution of the istSOS instances due to the less work load.
The GetCapabilities (Figure 7 and 8) response time is extremely improved due to the cache system used only for this type of SOS request on the PM. The comparison between the VM-0 and PM is definitely won by the new proposed solution.
worse results are probably due to the tiny work load needed by this request. For this reason, the istSOS-proxy, adding its own algorithm, can decrease the performances of this request, even if, as previously written, not significance deviation can be marked.
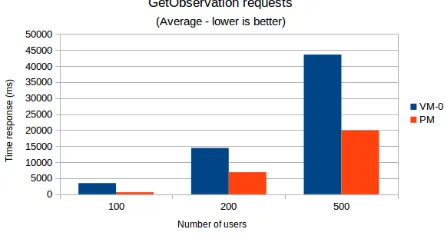
The GetObservation, together with the GetCapabilities, is the type of SOS request which take more advantage from the proposed solution. As shown in the Figure 11 and 12, the performances are almost doubled. The less work load, due to the improvements developed with the istSOS-proxy, brings the response time from 15 for the VM-0 to 6.9 seconds for the PM with 200 concurrent users. When 500 users are simulated, by the python load testing tool, the performances are improved by a factor of two (from 43 seconds average response time to 20).
Figure 6. Number of total requests with 100, 200 and 500 concurrent users both for the VM-0 and PM.
Figure 7. Median response time in milliseconds for the
GetCapabilities request with 100, 200 and 500 concurrent users both for the VM-0 and PM.
Figure 8. Average response time in milliseconds for the
GetCapabilities request with 100, 200 and 500 concurrent users both for the VM-0 and PM.
Figure 9. Median response time in milliseconds for the
DescribeSensor request with 100, 200 and 500 concurrent users both for the VM-0 and PM.
Figure 10. Average response time in milliseconds for the
DescribeSensor request with 100, 200 and 500 concurrent users both for the VM-0 and PM.
Figure 11. Median response time in milliseconds for the
GetObservation request with 100, 200 and 500 concurrent users both for the VM-0 and PM.
Figure 12. Average response time in milliseconds for the
4. CONCLUSIONS
The 4onse research project is focused on setting up a fully accessible, royalty free and low cost climate monitoring system based on open hardware, software and standards to study if non-conventional systems can empower developing countries with EMS.
Since and EMS is composed by three layer (hardware, service and communication layer), a solution to extend the istSOS capabilities is presented within the service layer. Large amount of sensors and several concurrent users may characterize an EMS. Thus, istSOS, while demonstrating good stability, needs to improve its ability to scale on increased amount of work caused by massive datasets and several I/O requests. To this end, the istSOS-proxy has been implemented. The tests conducted demonstrated that the adopted solution contributes in increasing EMS performance by distributing massive time-series database over different server machines. In addition, the used cache system can offer fast access to the static information and help in the decreasing of the general work load.
More tests are required, particularly to better understand the scaling gain under different configurations. Nevertheless, these preliminary results are very promising and confirm the effectveness of the adopted approach. This solution does not prevent the development of the istSOS itself, which needs to update the core component in order to effectively use new software technologies that better fit massive data processing. Next future developments of istSOS-proxy include a web user-friendly interface as well as some new features to further improve the performances and the strategy used to better handle big data. Once the stable version will be released, the istSOS-proxy source code is going to be published under the GNU General Public License (GPL).
5. REFERENCES
Artiola, J., Pepper, I. L., & Brusseau, M. L., 2004.
Environmental monitoring and characterization. Academic Press.
Bröring, A., Stasch, C., & Echterhoff, J., 2010. OGC ® Sensor Observation Service Interface Standard. Open Geospatial Consortium.
Cannata, M., & Antonovic, M., 2010. istSOS: investigation of the sensor observation service. In WebMGS 1st international workshop on pervasive web mapping, geoprocessing and services, Como, Italy (pp. 26-27).
Cannata, M., Antonovic, M., Molinari, M., & Pozzoni, M., 2013. istSOS sensor observation management system: a real case application of hydro-meteorological data for flood protection. In Proceedings of International Workshop of The Role of Geomatics in Hydrogeological Risk, Padua, Italy (pp. 27-28).
Kiker, G. A., Bridges, T. S., Varghese, A., Seager, T. P., & Linkov, I., 2005. Application of multicriteria decision analysis in environmental decision making. Integrated environmental assessment and management, 1(2), 95-108.
Singh, D., & Reddy, C. K., 2015. A survey on platforms for big data analytics. Journal of Big Data, 2(1), 8.
Snow, J. T., 2013. Non-Traditional Approaches to Weather Observations in Developing Countries.
Van Rossum, G., & Drake, F. L., 2003. Python language reference manual (p. 144).