SATELLITE BASED ESTIMATION AND VALIDATION OF MONTHLY RAINFALL
DISTRIBUTION OVER UPPER GANGA RIVER BASIN
Anoop Kumar Shukla a, *, C. S. P. Ojha a, R. D. Garg a
a
Department of Civil Engineering, Indian Institute of Technology, Roorkee, India – ([email protected], [email protected], [email protected])
Commission VI, WG VI/4
KEY WORDS: Kriging, Rainfall, Rain Gauge, Satellite Data, Statistical Indices, TRMM
ABSTRACT:
Water is one of the most precious natural resources for all living flora and fauna. 97.5% of water on the Earth is sea water, the remaining 2.5% is fresh water of which slightly over two thirds is frozen in glaciers and polar ice caps. The unfrozen fresh water is mainly found as groundwater, with only a small fraction present above ground or in the air. Since one of the main source of water is rainfall. Therefore, proper information on rainfall and its variability in space and time is required for better watershed planning and management and other applications. In Himalayan basin, the rain gauge network is relatively sparse with uneven distribution. Hence, there is lack of proper information on rainfall patterns of this region. The main advantage of satellite derived rainfall estimation over rain gauge derived rain data is that these provide homogenous spatio-temporal rainfall information over a large area e.g. Upper Ganga river basin region. Therefore, a better understanding of the rainfall patterns of this region is required for better disaster mitigation. The objectives of this study are to evaluate the reliability of Tropical Rainfall Measuring Mission (TRMM) 3B43 V7 derived high resolution satellite product to study the rainfall distribution over the Upper Ganga river basin. TRMM 3B43 V7 derived monthly rainfall data is analyzed and the monthly rainfall product is validated and correlated with IMD (Indian Meteorological Department) gauge station's rainfall data. The monthly rainfall data of 15 years i.e. from 1998 to 2012 is used in the study. Statistical indices can be used to evaluate, compare and validate satellite rainfall data with respect to gauge rainfall data. Statistical indices used in this study are Correlation Coefficient (r), Mean Square Error (MSE), Root Mean Squ are Error (RMSE), and Average Percentage Error (Avg. % Error). Most of the rainfall in the study area occurs in the months of June, July, August, September and October. The isohyets were prepared using gauge rainfall data and are matched with the spatially distributed rainfall surface prepared from TRMM satellite data for all the months of the rainy season of the study area. Kriging spatial interpolation method was used to generate the spatially distributed rainfall surface. From the results it was observe d that they matched fairly well with each other showing high spatial correlation. The monthly rainfall result showed that TRMM data is underestimated with low accuracy, though TRMM data and rain gauge data have positive correlation.
* Corresponding author.
1. INTRODUCTION
Rainfall is the most important forcing data for hydrological models and prime necessity of life on Earth. It is very difficult for hydrologists to simulate the water cycles over hilly regions with no or sparse precipitation gauge station networks, especially over complex hilly terrain or remote areas. Recently, the satellite precipitation products derived from methods such as TRMM Multi satellite Precipitation Analysis (TMPA) (Huffman et al., 2007), CPC Morphing technique (CMORPH) (Joyce et al., 2004), Precipitation Estimation from Remotely Sensed Information using Artificial Neural Networks (PERSIANN) (Sorooshian et al., 2000) and PERSIANN-Cloud Classification System (PERSIANN-CCS) (Hong et al., 2004) are starting to provide alternatives for estimating rainfall data and also pose new challenges for hydrologists in understanding and applying the remotely sensed information. The accurate rainfall estimation is a key factor in the context of water resource developments to develop a runoff model, flood forecasting, ground water recharge for agriculture purposes. The rainfall is highly dynamic and variable in the form of quantity and intensity over a complex hilly terrain. The traditional method of recording rainfall is through instruments,
which records accurate rainfall amount that falls over it, but determination of its spatial distribution is still a major limitation. To address the same, geospatial techniques can be used for accurate rainfall estimation by radiometer observation from satellite. The Tropical Rainfall Measuring Mission (TRMM) is one of the most useful missions for calculating rainfall over the earth. The TRMM satellite was developed by the National Aeronautics and Space Administration (NASA) Goddard Space Flight Center (GSFC), on November 28, 1997. It is a joint space mission between the NASA and the Japan Aerospace Exploration Agency (JAXA). In this research work TRMM 3B43 V7 is used for determination of the rainfall variations. It produces three hourly rainfall data at 0.25°×0.25° spatial resolutions. The satellite estimates rainfall and energy exchange on tropical and subtropical regions of the world based on the characteristics of cloud cover, cloud tops and temperature. (Kwaku et al., 2012) validated TRMM satellite data product with rain gauge station data for the Black Volta basin of Ghana in West Africa. They found that the TRMM rainfall data did not perfectly match with the rain gauge station data. (Waldo el al., 2009) compared the TRMM 3B43 product with rain gauge data over two sub basins. (Yunfei el al., 2003) derived seasonal characteristics of precipitation in 1998 over
East Asia. On the global scale comparison, the general overestimation of TMI derived rainfall was confirmed by (Kummerow et al., 2000). This study considered the general characteristics of rain rate derived from the TMI-2A12 and PR 2A25 algorithms. (Curtis et al., 2007) compared the basin scale rainfall estimation of TRMM with rain gauge using kriging geo-statistical interpolation method, during the 1999 Hurricane Floyd flood in eastern North Carolina, USA. (Kenneth et al., 2003) compared the TRMM rainfall with rain gauge station data from the TAO/TRITON buoy array and they found that the TMI has near-zero bias with respect to the rain gauges when compared across the climatologically different rain gauge station (dry to wet) and also found PR is biased about 30% skills in detecting rainfall at low elevation station as compared with high elevation that receive low intensity rain. Methods of rainfall estimation based on geomatics techniques can be classified into two groups: the direct and indirect methods (Carleton, 1991; Barrett and Beaumont 1994). In the indirect method, cloud characteristics (cloud cover, cloud-top temperature) as observed in visible (VIS) and infrared (IR) satellite imagery are used as indicators of the occurrence of rainfall. The direct method uses microwave (MW) techniques to obtain instantaneous rain rates. Surface-based remote sensing technology involves weather radar, though this is limited to relatively low synoptic view and is mainly used for forecasting and research purposes (Simmers, 2003).
2. STUDY AREA
The Ganga river is the longest river of India and ranks among the world's top 20 rivers by amount of water discharge. The Ganga begins at the confluence of the Bhagirathi and Alaknanda rivers, which meet at Dev Prayag in Tehri Garhwal district of Uttarakhand State of India within the mountain range of the Himalayas. The Bhagirathi river has been con-sidered as a true source of Ganga which rises at the foot of Gangotri Glacier, at Gaumukh.
Figure 1: Location map of Upper Ganga river basin
The Ganga River is divided into three zones, viz. Upper Ganga basin, Middle Ganga basin and Lower Ganga basin. The study area, Upper Ganga basin is located in Northern India which Uttarkashi. Around 60% of the basin is occupied by agriculture (main crop types include wheat, maize, rice, sugarcane, bajra, and potato), while 20% is covered by forests, mostly in the upper mountains, and approximately 2% in the mountain peaks is permanently covered with snow. The annual average rainfall in the Upper Ganga basin ranges between 550 and 2500 mm (Bharati and Jayakody, 2010), and a major part of the rains is due to the south-westerly monsoon that prevails from July to late September. The geographical location and other details of the study area Upper Ganga river basin are given in Figure 1.
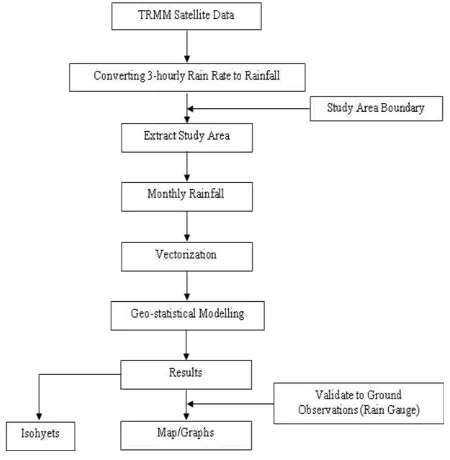
3. METHODOLOGY
In this research paper monthly rainfall TRMM 3B43 V7 data were downloaded from Giovanni, TRMM Online Visualization and Analysis System (TOVAS) of Goddard Earth Sciences, Data and Information Services Center (GES DISC), NASA.
Figure 2: Flow chart of methodology rainfall data are: rain rate, accumulated rain, and relative error. The monthly gauge (observed) rainfall data were collected from Indian Meteorological Department (IMD). The data is 10.2 software. On the basis of the latitude and longitude of the selected rain stations, the raster value is extracted to point locations using bilinear interpolation method. In this interpolation method, the value of a cell is calculated from the adjacent cells with valid values. This is done for each month
from January 1998 to December 2012. As the total days in each month are different, the default unit for TRMM monthly rain rate is mm/hr. TRMM 3B43 is a monthly average product. Hence for easy comparison, the rain rate in mm/hr is converted to mm/month. This conversion is done by simply multiplying the hourly rain rate with the total hours in that particular month.
Statistical indices can be used to evaluate, compare and validate satellite rainfall data with respect to gauge rainfall data. They help to understand the existing co-relationships, trends and error propagations between the two types of datasets. In this study, the following four statistical indices are used: (1) Correlation Coefficient (r), (2) Mean Square Error (MSE), (3) Root Mean Square Error (RMSE), and Average Percentage Error (Avg. % Error). In Uttarakhand, most of the rainfall occurs between the months of June to October. Therefore, raster surface i.e. rainfall distribution maps are generated for June, July, August, September and October months using the TRMM rainfall data of the respective months. These maps are generated on Arc GIS 10.2 software using kriging, which is a powerful spatial interpolation technique. Further, applying the same method, the isohyets are generated for each of these months using gauge rainfall data. Isohyets are type of rainfall contour maps, formed by connecting the points having equal rainfall during a specific period of time. These isohyets lines are overlaid on rainfall distribution maps. The detailed methodology is expressed in Figure 2.
4. RESULTS AND DISCUSSION
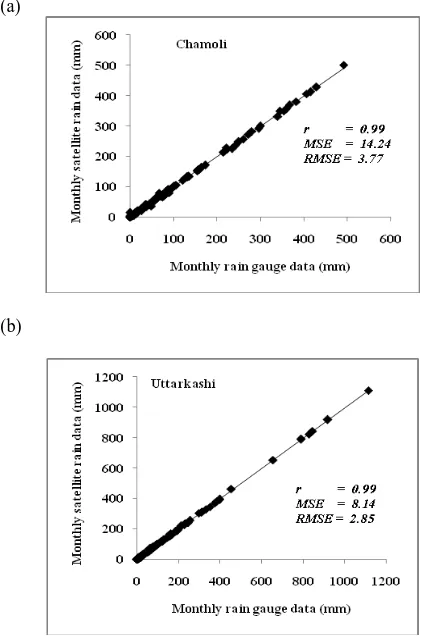
TRMM satellite derived monthly rainfall data over the period of January 1998 to December 2012 is compared with the gauge rainfall data of two rain stations (Chamoli and Uttarkashi) across the Upper Ganga river basin lying in Uttarakhand state, India. Statistical indices viz. Correlation Coefficient (r), Mean Square Error (MSE), Root Mean Square Error (RMSE), and Average Percentage Error (Avg. % Error) estimated for all two stations are summarized in Table 1. It can be seen from Table 1 that at all the stations, TRMM 3B43V7 monthly rainfall data is significantly correlated with gauge rainfall data. The correlation coefficient of 0.99 is found at all two stations viz. stations is that both the correlation coefficient and the average % error increase with total rainfall. The monthly statistical indices are estimated for rainy season in Upper Ganga river basin Uttarakhand state. The rainy season in Upper Ganga river basin covers the months of June, July, August, September and October. It can be seen from Table 2 that again maximum correlation coefficient of 0.9 is observed for all two stations during rainy season (Figure 3). A maximum average % error of 3.5% and 5.5% is observed for Chamoli and Uttarkashi rain stations respectively. Therefore, it is evident from Table 2 that during rainy season a very high agreement exists between the TRMM based satellite rainfall data and gauge rainfall data. To validate the TRMM rainfall data with gauge rainfall data, a study of the existing relationship between them is required. A
good relationship is observed between the two types of rainfall datasets (Figure 4). For further validation and to have a better representation of the relationship GIS based analysis is used.
(a)
(b)
Figure 3: Co-relationship between TRMM monthly data and ground data for stations located in Upper Ganga river basin (a) Chamoli rain station (b) Uttarkashi rain station
Stations Long. Lat. r MSE RMSE Average %
Error
Chamoli 30.40 79.33 0.99 14.24 3.77 5.47
Uttarkashi 30.73 78.45 0.99 8.14 2.85 6.16
Table 1: Locations of the rain stations and satellite data validation parameters for monthly rainfall from the period from January 1998 to December 2012
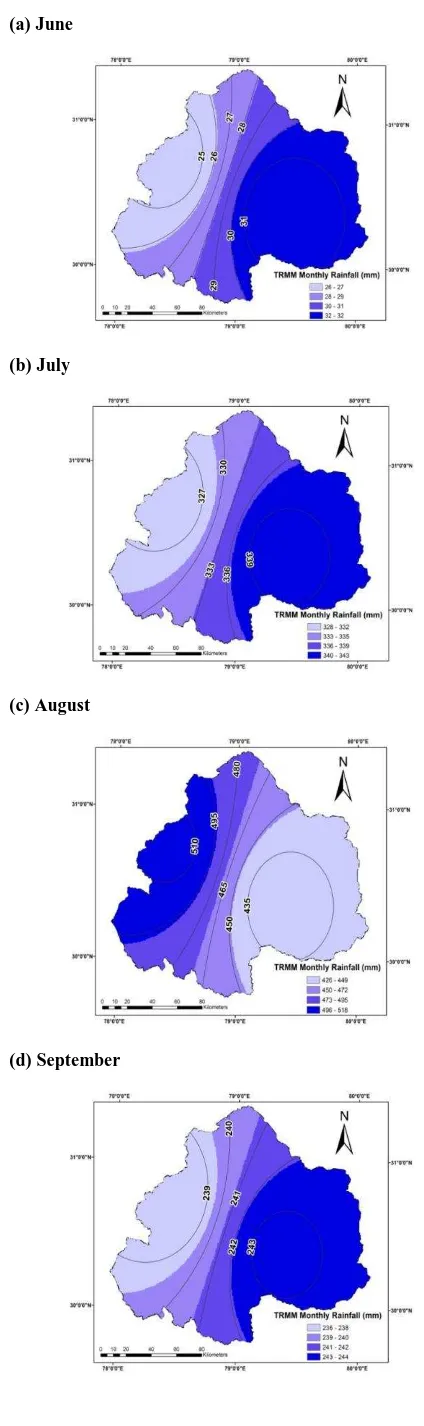
A comparison of the spatial distribution of TRMM monthly rainfall data with gauge monthly rainfall data (isohyets) is done for the following months: (a) June, (b) July, (c) August, (d) agreement between the data. The results illustrate a very good matching between the satellite and gauge rainfall datasets. Hence, validation of TRMM satellite data with gauge rainfall data shows a very good overall agreement.
Stations June July August September October
a b c d a b c d a b c d a b c d a b c d
Chamoli 0.9 11.1 3.3 2.9 0.9 22.8 4.8 1.3 0.9 12.9 3.6 1.2 0.9 24.7 4.9 3.5 0.9 2.6 1.6 4.5
Uttarkashi 0.9 9.2 3.0 3.2 0.9 20.0 4.5 1.3 0.9 12.5 3.5 0.8 0.9 12.3 3.5 1.9 0.9 3.4 1.9 5.5
Where, a= r, b= MSE, c= RMSE, d= Average % Error
Table 2: Statistical indices for validation of the TRMM monthly satellite data with respect to gauge rainfall for the rainy season in Upper Ganga river basin
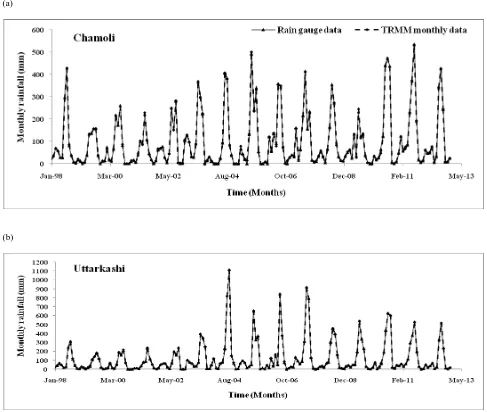
(a)
(b)
Figure 4: Time series monthly TRMM and gauge data for stations located in Upper Ganga river basin (a) Chamoli rain station (b) Uttarkashi rain station
(a) June
(b) July
(c) August
(d) September
(e) October
Figure 5: Comparison of the spatial distribution of TRMM monthly rainfall data with gauge monthly rainfall data (isohyets) for the following months: (a) June, (b) July, (c) August, (d) September, and (e) October
5. CONCLUSIONS
This study employed four statistical indices viz. Correlation Coefficient (r), Mean Square Error (MSE), Root Mean Square Error (RMSE), and Average Percentage Error (Avg. % Error). They were used to compare and validate the TRMM satellite derived rainfall data with gauge rainfall data of Upper Ganga river basin Uttarakhand, India which falls under sub-tropical zone. For two stations, the correlation coefficient of 0.99 is estimated and the maximum average % error estimated is 6.16% for Uttarkashi station. The isohyets, prepared using gauge rainfall data matched well with and the spatially distributed rainfall surface prepared by TRMM satellite data for months in the rainy season of the study area. As all the selected stations fall in the sub-tropical zone, a similar trend is observed in their comparison graphs. The correlation coefficient seems to increase with the total rainfall in the region.
A good agreement and relationship is observed on comparing the monthly TRMM satellite rainfall data with gauge rainfall data. The variation in satellite based rainfall and gauge rainfall may be due to the limited spatio-temporal coverage of TRMM satellite over a particular region. The satellite may miss few rainfall events. Other reasons can be the uncertainty and errors while sensing the rainfall parameters from satellite and during the raw satellite parameters processing using algorithms. These errors may affect the final rainfall products. Geospatial technologies such as remote sensing and GIS are promising tools for satellite based rainfall estimation. They can provide spatial distribution of rainfall data which is not possible with simple ground based rainfall measurements. TRMM rainfall data can be used well as inputs to the hydrological models for various watershed developmental related activities. The results also suggest that TRMM derived rainfall data could be used for the runoff simulation to the catchments where there is no precipitation station for early investigations.
ACKNOWLEDGEMENTS
Authors are thankful to Indian Meteorological Department (IMD), Government of India for providing the gauge rainfall data used for validation purpose. The satellite data used in this
study were acquired as part of the activities of NASA's Science Mission Directorate, and are archived and distributed by the Goddard Earth Sciences (GES) Data and Information Services Center (DISC). We are highly grateful towards GES DISC, NASA.
REFERENCES
Barros, A.P., Joshi, M., Putkonen, J. and Burdbank, D.W., 2000. A study of 1999 monsoon rainfall in mountainous region in central Nepal using TRMM product and rain-gauge observation. Geophysical Research Letters, Vol. 27, No. 22, pp. 3683-3686.
Barrett, E.C. and Beaumont, M.J., 1994. Satellite rainfall monitoring: an overview. Remote Sensing Review, Vol. 11, pp. 23-48.
Bharati, L. and Jayakody, P., 2010. A report on hydrology of the Upper Ganga river basin. International Water-Management Institute. Project report no: H043412. Available online at: http://publications.iwmi.org/pdf/H043412.pdf. Accessed on: June 01, 2014.
Carleton, A.M., 1991. Satellite Remote Sensing in Climatology. Bellhaven Press, London, pp. 291.
Curtis, S., 2007. A comparison of TRMM to other basin-scale estimates of rainfall during the 1999 Hurricane Floyd flood. Nat Hazards, Vol. 43, pp. 187–198.
Haddad, Z.S. and Meagher, J.P., 2004. Global variability of precipitation according to the Tropical Rainfall Measuring Mission. Journal of Geophysical Research, Vol. 109, D17103, doi: 10.1029/2004JD004607, 2004.
Hong, Y., Hsu, K.L., Sorooshian, S. and Gao, X., 2004. Precipitation estimation from remotely sensed imagery using an artificial neural network cloud classification system. J. Appl. Meteorol. Vol. 43 (12), pp. 1834–1853.
Huffman, G.J., Adler, R.F., Bolvin, D.T., Gu, G., Nelkin, E.J., Bowman, K.P., Hong, Y., Stocker, E.F. and Wolff, D.B., 2007. The TRMM Multisatellite Precipitation Analysis (TMPA): quasi-global, multiyear, combined-sensor precipitation estimates at fine scales. J. Hydrometeorol. 8 (1), pp. 38–55.
Ikai, J. and Nakamura, K., 2003. Comparison of Rain Rates over the Ocean Derived from TRMM Microwave Imager and Precipitation Radar. Journal of Atmospheric and Oceanic Technology, Vol. 20.
Joyce, R.J., Janowiak, J.E., Arkin, P.A. and Xie, P., 2004. CMORPH: a method that produces global precipitation estimates from passive microwave and infrared data at high spatial and temporal resolution. J. Hydrometeorol. Vol. 5(3), pp. 487–503.
Kenneth, P.B, Amy, B.P, and Gerald, R.N., 2003. Comparison of TRMM rainfall retrievals with rain gauge data from the TAO/TRITON buoy array. Geophysical Research Letters, Vol. 30, No.14, pp. 1757, doi:10.1029/2003GL017552, 2003.
Kummerow, 2000. The Status of the Tropical rainfall Measuring Mission (TRMM) after Two Years in Orbit, J. Appl. Meteor., Vol. 39(12), pp. 1965-1982.
Kwaku, A.A., Liliang, R., Emmanual, K.A., Kwabena, K.Y. and Albert, A.A., 2012. Validation of TRMM Data in the Black Volta Basin of Ghana, Journal of Hydrologic Engineering, pp. 647-654.
Simmers, I., 2003. A report on understanding water in a dry environemnt: Hydrological processes in arid and semi-arid zones. A. A. Balkema Publisher, Netherlands, pp. 36.
Sorooshian, S., 2000. Evaluation of PERSIANN system- satellite–based estimates of tropical rainfall. Bull. Am. Meteorol. Soc. Vol. 81(9), pp. 2035–2046.
Waldo, S.L.C., 2009. TRMM rainfall data estimation over the Peruvian AmazonAndes basin and its assimilation into a monthly water balance model. IAHS Publ., Vol. 333, PP. 245-252.
Yunfei, F.U., 2003. Seasonal characteristic of precipitation in 1998 over East Asia as derived from TRMM product. Advance in Atmospheric Sciences. Vol. 20, No.4, pp. 511-529.