APPLICATION OF MULTISPECTRAL SATELLITE DATA FOR GEOLOGICAL
MAPPING IN ANTARCTIC ENVIRONMENTS
Amin Beiranvand Pour *, Mazlan Hashim and Jong KukHong b
a Geoscience and Digital Earth Centre (Geo-DEC) Research Institute for Sustainability and Environment (RISE)
Universiti Teknologi Malaysia (UTM) 81310 UTM Skudai, Johor Bahru, Malaysia
b Korea Polar Research Institute (KOPRI) Songdomirae-ro,Yeonsu-gu, Incheon 21990, Republic of Korea
*Corresponding author: [email protected]
KEY WORDS: Multispectral satellite data; Geological mapping; Antarctic environments
ABSTRACT:
Remote sensing imagery is capable to provide a solution to overcome the difficulties associated with geological field mapping in the Antarctic. Advanced optical and radar satellite imagery is the most applicable tool for mapping and identification of inaccessible regions in Antarctic. Consequently, an improved scientific research using remote sensing technology would be essential to provide new and more complete lithological and structural data to fill the numerous knowledge gaps on Antarctica’s geology. In this investigation, Oscar coast area in Graham Land, Antarctic Peninsula (AP) was selected to conduct a remote sensing study using Landsat-7 Thematic Mapper (TM), Landsat-8 and the Advanced Spaceborne Thermal Emission and Reflection Radiometer (ASTER) data. Contrast-enhanced Red-Green-Blue (RGB) composites, band ratios and Relative Band Depth (RBD) image processing techniques were applied to Landsat-8 and ASTER dataset for establishing the spectral separation of the main lithologic groups exposed in the study area. The outcomes of this investigation demonstrated the applications of SWIR and TIR bands of the multispectral remote sensing datasets to identify lithological units and producing geological maps with suitable accuracy of ice-free rock regions in the Antarctic Peninsula. The results could be extended to map coverage of non-investigated regions further east and validated previously inferred geological observations concerning other rocks and mineral deposits throughout the Antarctica.
1. INTRODUCTION
Antarctica remains a remote and logistically difficult region in which to conduct geological fieldwork, making the data collected there of significant value. This is predictable considering the size of the continent and the changing tectonic processes, environments and climates that it has experienced over geological era (Veevers, 2012; Salvatore et al., 2013). Antarctica’s geology is not identified in detail because of the extensive ice cover. Our perception of the rocks and geological structures beneath the ice must be inferred from limited area of rock exposures (approximately 0.4% of the continent) at the surface as well as remote sensing technologies using advanced optical and radar satellite imagery, seismic and gravity investigations (Jezek et al., 1998).
In fact, many parts of the continent still remain poorly known in regional geological scale and structural architecture. Remote sensing imagery is capable to provide a solution to overcome the difficulties associated with field mapping in the Antarctic. Advanced optical and radar satellite imagery is the most applicable tool for mapping and identification of inaccessible and exposed regions in Antarctic. Remote sensing imagery has been used extensively for lithological mapping, structural analysis and mineral exploration in arid and semi-arid and tropical regions around the world (Pour and Hashim, 2011,
2014 a,b, 2015). Consequently, an improved scientific research using remote sensing technology would be essential to provide new and more complete lithological and structural data to fill the numerous knowledge gaps on Antarctica’s geology. The objective of this investigation is to evaluate the application of multispectral satellite data such as Landsat-7 Thematic Mapper (TM), Landsat-8 and the Advanced Spaceborne Thermal Emission and Reflection Radiometer (ASTER) for geological mapping inAntarctic environments.
2. MATERIALS AND METHODS
2.1 Geology of the Antarctic
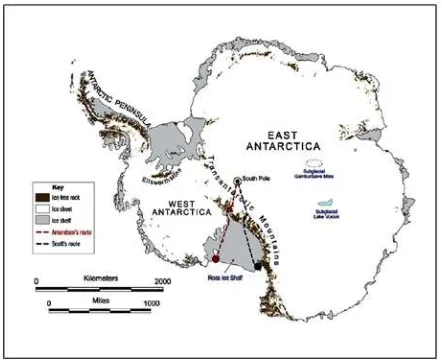
Antarctica from West Antarctica with peaks that rise over 4 km above sea level. Crustal thickness estimates under the Transantarctic Mountains vary between 20 and 45km (Kanao et al., 2002; Bannister et al., 2003).
Figure.1. General geologic map of the Antarctic continent (modified from Talarico and Kleinschmidt, 2009).
The Antarctic Peninsula (AP) is the most accessible region of West Antarctica, which occurred along the southeast Pacific continental margin (Yegorova et al., 2011). The AP consists of a number of large domains and is the largest tectonic block of West Antarctica. The AP has been traditionally regarded as a magmatic arc formed along the palaeo-Pacific margin due to Gondwana breakup (Storey and Garret 1985). Recent geophysical and geological studies suggest that the AP is a composite magmatic arc comprising two or three separate terranes that were accreted and sutured along the Gondwana margin in the mid-Cretaceous. The two suspect terranes (the Western and Central Domains) have faulted contacts with continental Gondwana margin rocks (Eastern Domain), suggesting that any docking between the former domains and the Gondwana margin was probably dextral-oblique (Vaughan et al. 2002).
2.2 Remote sensing data
In this investigation, Landsat-7 Thematic Mapper (TM), Landsat-8 and theAdvanced Spaceborne Thermal Emission and Reflection Radiometer (ASTER)data were obtained from the U.S. Geological Survey’s Earth Resources Observation System (EROS) Data Center (EDC). They were acquired on December to February during summer season with low cloud cover and more rock exposures for the Antarctic Peninsula (AP) and surrounding areas. The datasets were processed using the ENVI (Environment for Visualizing Images) version 5.1 and Arc GIS version 10.3 software packages.
2.3 Data processing
Prior to spectral analysis of the satellite data an atmospheric correction model (Fast Line-of-sight Atmospheric Analysis of Spectral Hypercube, FLAASH) was applied to the datasets. Due to areas of snow, ice, sea and cloud in Antarctic environment, only convinced image processing tasks could be restricted to just areas of rock exposure (sunlit rock in the case of the reflective data) (Hall et al., 1995). Contrast-enhanced Red-Green-Blue (RGB) composites were applied to Landsat-7 Thematic Mapper (TM), Landsat-8 and ASTER dataset for
establishing the spectral separation of the main lithologic groups exposed in the study area prior to band ratios and Relative Band Depth (RBD) image processing techniques. Band ratio is a technique where the digital number value of one band is divided by the digital number value of another band. Band ratios are very useful for highlighting certain features or materials that cannot be seen in the raw bands. High digital number values in the scene indicate spectral signatures similar to those of the particular materials (minerals) they were designed to map (Pour and Hashim, 2011). Relative Absorption Band Depth (RBD) is a useful three-point ratio formulation for detecting diagnostic mineral absorption features. For each absorption feature, the numerator is the sum of the bands representing the shoulders, and the denominator is the band located nearest the absorption feature minimum. Relative Absorption Band Depth (RBD) is a useful three-point ratio formulation for displaying Al-O-H, Fe, Mg-O-H, and CO3 absorption intensities (Pour and Hashim, 2014b).
3. RESULTS AND DISCUSSION
Figure 2 shows mosaic RGB colour-composite of visible and shortwave infrared bands (3, 5 and 7) of Ladndsat TM at regional scale for West Antarctica. The RGB colour-composite reveals details about the glaciologic and geologic structures in the West Antarctica. Major geological and glaciological features are recognizable in the Ladndsat TM image such as mountain ranges and ice shelves. The textural characteristic of mountain ranges particularly strong paralleling the flanks of the Transantarctic, Pensacola and Shackelton Mountains and extending deep into adjacent portions of the East Antarctic Plateau are distinguished in the south-western and western parts of the image. Ellsworth Mountain and associated Vinson Massif are appeared as curvilinear features with distinctive texture in the central north of West Antarctica. Ronne-Filchner Ice Shelf, Rose Ice Shelf and Larsen Ice Shelf demonstrated different textural patterns in comparison with Marie Byrd Land, Ellsworth Land, Palmer Land and Graham Land in West Antarctica and Antarctic Peninsula (AP) (Fugure 2).
Figure 3 shows Antarctic Peninsula (AP) as mosaic RGB colour-composite of visible and shortwave infrared bands (3, 5 and 7) of Landsat-7 TM at regional scale. Antarctic Peninsula has significant areas of exposed rock, varying surface slope and texture that are observable in Figure 3. The rocks of the Antarctic Peninsula in many ways resemble the Andes Mountains, which is dominated by volcanic and plutonic rocks. Different textural patterns are manifested associated with ice shelfs and rocky land background. Larsen Ice Shelf and other ice shelves (George Vi and Wilkins) with smooth to semi-smooth feature are easily recognizable from rough pattern of rocky land background in the image. Palmer Land, Graham Land, Trinity Peninsula and several islands such as South Okrney Islands, South Shetland Islands, James Ross Island Anvers Island, Adelaide Island and Alexander Island have rocky background features, which show different pattern compere to ice shelves (Figure.3).
characteristics of rocky background, structuralfeatures, glacier, ice shelves and sea water are observable at regional scale. Rock exposure areas appear in greenish blue colour especially in eastern segment of Figure 4. Ice shelves and glacier show different structural features and manifest as purple to light whitish blue areas. Sea water is recognizable as dark blue colour in the western part of the image.
Figure 2. RGB colour combination of bands 3, 5 and 7 derived from orthorectified Landsat 7 mosaic image of West Antarctica.
Figure 3. RGB colour combination of bands 3, 5 and 7 derived from Landsat 7 mosaic image for Antarctic Peninsula (AP). Black cube shows Landsat-8 coverage for Oscar coast area in
Graham Land.
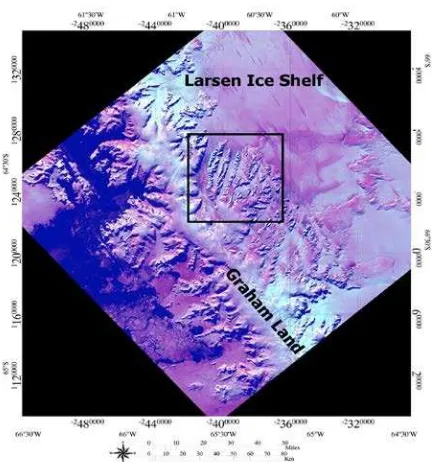
Figure 4. RGB colour combination of bands 5, 6 and 7 of Lansat-8 for Graham Land, Antarctic Peninsula (AP). Black
cube shows ASTER coverage for the study area and rock exposure zone.
TIR bands of Landsat-8 have improved the quality and applicability of the Landsat data in a variety of earth-based and atmospheric phenomenon. Two thermal infrared bands (bands 10 and 11) of Landsat-8 have spectral coverage in 10.30-11.30
μm and 11.50-12.50 μm, respectively (Pour and Hashim, 2014 b). The energy measured by TIR bands from the Earth’s surface is a function of temperature as well as the emissivity of the target, which is dependent on its chemistry and texture. In polar context, rock exposure is much warmer than surrounding snow, ice or sea as well as overlying cloud and is readily discriminated due to its high thermal radiance values. Moreover, silicate minerals exhibit spectral features in the TIR. The silica emissivity curve shows significant variation in 8.5 μm to 9.30
μm and 10.30 to 11.70 μm. There are clear minima in 8.5 μm to 9.30 μm while higher emissivity values can be seen in 10.30 to 11.70 μm (Pour and Hashim, 2011, 2014b).
RGB color combination image can be produced for band 10 (10.30-11.30 μm), 11 (11.50-12.50 μm) and 7 (2.100-2.300 μm) of Landsat-8 at a regional scale. In this study, band 7 has been selected for RGB color combination image as representative of rocks absorption features in SWIR region due to Al–OH, Fe, Mg–OH, Si–O–H and CO3 in their compositions. Figure 5 shows image map of TIR bands+SWIR band of Landsat-8 for eastern segment of Graham Land. This image map shows variety of thermal radiance values and discriminate different geological features such as sea water, glacier, ice shelves and rock exposures.
low value emissivity zones (pink colour) in the image map (Figure 5).
Figure 5. Image map of TIR bands+SWIR band of Landsat-8 for eastern segment of Graham Land. RGB color combination image was produced from band 10, 11 and 7 of Landsat-8.
Band ratios derived from image spectra of ASTER data were used to map rock exposure in the eastern part of the Figure 4 (black cube). Because ASTER has 14 spectral bands, many permutations of ratio images, and thus more lithologic and mineralogic indices can be derived from ASTER data (Pour and Hashim, 2014 b). An image map was produced (Fugure 6), using VNIR+SWIR bands of ASTER to map iron oxides and hydroxides mineral (band1/band2), clay minerals (band4+band7/band6) and FeOH/MgOH minerals (band7+band9/band8). Rock exposures are manifested as red, purple and light green colures in a grey ice-background (Fugure 6).
The ratio for ferrous iron (band1/band2) records absorption in the VNIR region associated with the Fe ion that is present in mafic minerals such as chlorite and epidote. The band ratio for the AlOH absorption feature (band4+band7/band6) centred on ASTER band 6 was used to map clay minerals and micas such as smectite, muscovite, and illite. The FeOH/MgOH band ratio (band7+band9/band8) that records the absorption feature centred on ASTER band 8 was used to discriminate minerals such as chlorite, hornblende, and epidote (Pour and Hashim, 2011a,b). Accordingly, it seems that intermediate/mafic rocks such as diorite/gabbro, andesite/basalt and chlorite-bearing sediments are dominated in the study area (Fugure 6).
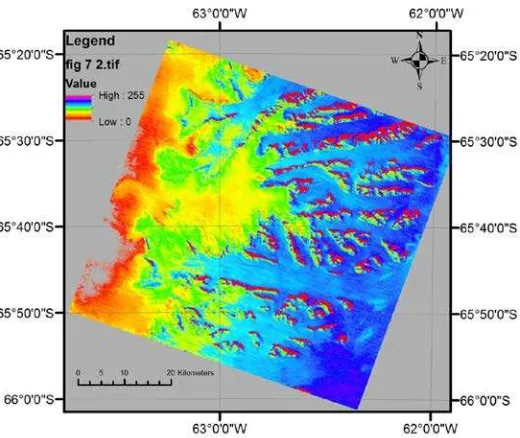
Spectral analysis of rock outcrops in the TIR bands of ASTER was undertaken using quartz index (band11*band11/band10* band12), carbonate index (band13/band14), mafic index (band12/band13) as RGB colour composites. Figure 7 shows the resultant image map for the study area. Rock outcrops in the eastern part of the image show highest emissivity value because of silicate and carbonate constituents. Glacier bed and glacier and ice shelf and high altitude inland ice regions show low value emissivity zones in the image map (Fugure 7).
Figure 6. Image map of (band1/band2=R), (band4+band7/band6=G) and (band7+band9/band8=B) of
ASTER VNIR+SWIR bands.
Figure 7. Image map of (band11*band11/band10*band 12=R), (band13/band14=G) and (band12/band13=B) of ASTER TIR
bands.
4. CONCLUSIONS
will enable important revisions to be made to the existing geological map of Antarctic Peninsula and non-investigated regions further east.
ACKNOWLEDGEMENTS
This study was conducted as a part of Yayasan Penyelidikan Antartika Sultan Mizan (YPASM) research grant (Vote no: R.J130000.7309.4B221), Sultan Mizan Antarctic Research Foundation, Malaysia. We also would like to express our great appreciation to KOPRI (Korea Polar Research Institute) Asian Polar Science Fellowship Program 2016 for their great support during this research. We are thankful to the Universiti Teknologi Malaysia for providing the facilities for this investigation.
REFERENCES
Bannister, S., Yu, J., Leitner, B., & Kennett, B. L. N. (2003). Variations in crustal structure across the transition from west to east Antarctica, southern Victoria Land. Geophys. J. Int., 155, 870–884.
Hall, D.K., Riggs, G.A., Salomonson, V.V., 1995. Development of methods for mapping global snow cover using moderate resolution imaging spectroradiometer data. Remote Sensing of Environment, 54, 127–140.
Jezek, K.C., Sohn, H.G., Noltimier, K.F., 1998. The RADARSAT Antarctic mapping project. IEEE 2462-2464.
Jensen, J.R. (2005). Introductory Digital Image Processing: A remote sensing perspective. Pearson Prentice Hall, Upper Saddle River NJ 07458. Third edition, p: 276-287.
Kanao, M., Shibutani, T., Negishi, H., Tono, H., 2002. Crustal structure around the Antarctic margin by teleseismic receiver function analyses. In: J. A. Gamble, D. N. B. Skinner, & S. Henrys (Eds). Antarctica at the Close of a Millennium, Wellington. R. Soc. N. Z., 35, 485–491.
Pour, A.B., Hashim, M., 2015 Structural mapping using PALSAR data in the Central Gold Belt Peninsular Malaysia,
Ore Geology Reviews, vol.64, pp. 13-22.
Pour, A.B., Hashim, M., 2014a. Structural geology mapping using PALSAR data in the Bau gold mining district, Sarawak, Malaysia, Adv. Space Research, vol.54 (4), pp. 644-654.
Pour, B. A., Hashim, M., 2014b. ASTER, ALI and Hyperion sensors data for lithological mapping and ore mineral exploration. Springerplus, 3(130), 1-19.
Pour, B. A. and Hashim, M., 2011. The Earth Observing-1 (EO-1) satellite data for geological mapping, southeastern segment of the Central Iranian Volcanic Belt, Iran. International Journal of the Physical Sciences, 6(33), 7638-7650.
Salvatore M.R., Mustard J.F., Head J.W., Cooper, R.F., Marchant, D.R., Wyatt, M.B (2013). Development of alteration rinds by oxidative weathering processes in Beacon Valley, Antarctica, and implications for Mars. Geochimica et Cosmochimica Acta 115, 137-161.
Schowengert, R.A.m, 2007. Remote sensing: models and
methods for image processing,” 3rd ed, Burlington, M.A,
Academic Press, Elsevier. pp. 229-243.
Storey, B., Garrett, S. 1985. Crustal growth of the Antarctic Peninsula by accretion, magmatism and extension. Geological Magazine, 122, 5–14.
Talarico, F. M., Kleinschmidt, G., 2009. The Antarctic continent in Gondwanaland: A tectonic review and potential research targets for future investigations. Developments in Earth & Environmental Sciences, 8 F. Florindo and M. Siegert, (Editors) 2009 Elsevier B.V. All rights reserved. DOI 10.1016/S1571-9197(08)00007-4.
Veevers, J.J., 2012. Reconstructions before rifting and drifting reveal the geological connections between Antarctica and its conjugates in Gondwanaland. Earth-Science Reviews 111, 249– 318.
Vaughan, A.P.M., Pankhurst, R.J., Fanning, C.M., 2002. A Mid-Cretaceous age for the Palmer Land event, Antarctic Peninsula: implications for terrane accretion timing and Gondwana paleolatitudes. Journal of Geological Society London, 159(2), 113–116.