A LOW-COST MARKERLESS TRACKING SYSTEM FOR TRAJECTORY
INTERPRETATION
Apostolos Laggis, Nikolaos Doulamis *, Eftychios Protopapadakis, Andreas Georgopoulos
Laboratory of Photogrammetry, School of Rural and Surveying Engineering, National Technical University of Athens - [email protected], [email protected], [email protected], [email protected]
Commission II
KEY WORDS: Kinect sensor, Trajectory Estimation, Noise Removal
ABSTRACT:
The tracking abilities of 1st generation Kinect sensors have been tested over common trajectories of folk dances. Trajectories related
errors, including offset, curve shape, noisy points are investigated and mitigated using well-known signal processing filters. Low cost depth trackers can contribute towards the remote tutoring of folk dances, by providing adequate data to instructors and explicit details to the trainees which segments of their dance trajectories need more work.
1. INTRODUCTION
According to UNESCO's 2003 'Convention for the Safeguarding of the Intangible Cultural Heritage, the Intangible Cultural Heritage (ICH) is the mainspring of cultural diversity and a guarantee of sustainable development. The Convention proposes five broad ‘domains’ in which intangible cultural heritage is manifested. One important domain is the domain of the performing arts which includes traditional music, theatre and dance. Availability of a digitized technological framework is a critical aspect for the preservation of the intangible cultural heritage content.
Although, ICH content, especially traditional folklore performing arts, is commonly deemed worthy of preservation by UNESCO and by the EU Treaty, most of the current research efforts focus on tangible cultural assets. The primary difficulty stems from the complex structure of ICH, its dynamic nature, the interaction among the objects and the environment, as well as the emotional elements, i.e. the way of expression and dancers' style. For this reason, the European Union recently approved a research project, namely TERPSICHORE, with the main purpose of researching, implementing and testing an innovative framework for digitization, 3D modelling, and archiving, choreographic performing arts (“Terpsichore: Transforming Intangible Folkloric Performing Arts into Tangible Choreographic Digital Objects,” 2017).
Currently, simple AV recordings have been used for digitizing folklore performances. However, such digitization technology offers no possibility to extract important symbolic characteristics that represent human creativity and the respective geometry. Therefore, it is difficult to preserve the way (styling) of a dance, the way of expression and the human feelings. The recent advances in hardware engineering have stimulated a boost in stereoscopic digitization technologies with the ability to capture stereo video data in real-time. Again, these methods fail to programme for developing a tele-immersive architecture (Nahrstedt et al., 2007) for capturing the intangible attributes of dances. The purpose of these works is to design a symbiotic creativity framework for choreography based on LMA-Laban Movement Analysis (Guest, 2014). However, the main research objective was the creation of a collaborative virtual environment instead of modelling, preserving and enriching human creativity in the framework of intangible cultural folklore performing arts.
A 3D archiving system for traditional performance arts has been presented in (Hisatomi et al., 2011) focusing on Japanese traditional performing arts. The system generates sequences of 3D actor models of the performances from multi-view video by using a graph-cut algorithm. However, the work mainly focuses on the 3D digitization of folklore performance arts instead of transforming the captured visual signals into a set of symbolic representations.
One of the first approaches for extracting symbolic information from a dance performance, i.e., transforming the dance into Laban movement attributes, is presented in (Smigel et al., 2006). However, this method is based on a manual annotation, making the whole process arduous. In the same context, the Labanwriter graphical user interface has been developed in (Wilke et al., 1932). To address the limitations of the manual annotation, the work of (Hachimura and Nakamura, 2001) introduces an automatic generation of Laban notation, exploiting motion data properties, while the work of (Chen et al., 2005) proposes a scoring system using a marker-based motion capturing architecture.
Recently, the work of (Chen et al., 2013) generates automatic Labanotation using hierarchical data presentations from the motion attributes of dances. A computer aided tool for automatically generating Labanotation scores has been proposed in (Choensawat et al., 2015), by analyzing body motions. The main limitation of the aforementioned approaches is that they are usually based on a marker-based motion capturing system which The International Archives of the Photogrammetry, Remote Sensing and Spatial Information Sciences, Volume XLII-2/W3, 2017
is an expensive hardware sensing interface. Furthermore, such systems require an expert installation workflow procedure making their operation, calibration and setup a difficult and costly task.
3. PROPOSED METHODOLOGY
In this paper, low-cost sensors are considered based on the Microsoft Kinect device. The idea is that an easy to install and use sensor can provide adequate tracking abilities, allowing its utilization for remote sessions of folk dance lessons. The apprentice, without living home, will record his/her movements, providing adequate information to a distant instructor or appropriate software for comments, suggestions and advices.
However, possible sensor limitations are related to inaccuracies regarding the coordinates of the captured 3D data, especially for short and long range distances (Yang et al., 2015). To address these difficulties, in this paper, we introduce a methodology which exploits the spatiotemporal coherency of a human movement in order to compensate the depth inaccuracies of the Kinect sensor. In order to achieve this, we exploit innovative methodologies from photogrammetry and computer vision.
Initially, the 3D information extracted from the skeletal tracking (Shotton et al., 2011) is projected onto the 2D surface of the dancer’s movement. Since these 2D surface points are noisy, due to depth inaccuracies of Kinect, we compensate their coordinates assuming a smooth movement trajectory of the dancer. First, a low-pass filter is applied onto the projected 2D surface points with the aim of minimizing their spatial-temporal variations. In this way, the algorithm compensates the coordinates of a point in a way that: i) the captured 3D information from the Kinect sensor is trusted as much as possible, while simultaneously ii) the variations among consecutive points are minimized. Error performance scores are obtained from comparing the coordinates, estimated by the Kinect, as projected onto the 2D surface with ground truth data. The adopted methodology steps are shown in fig 2.
3.1 Kinect sensor
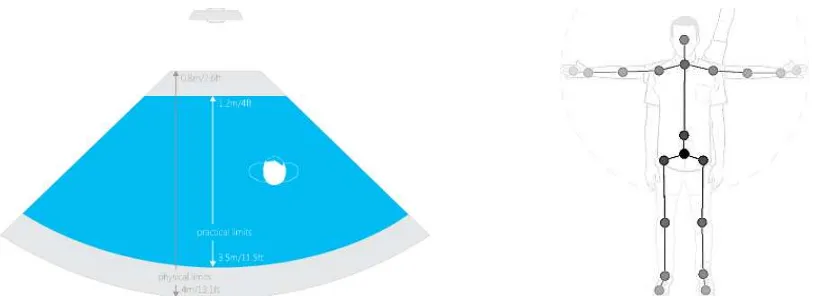
The Kinect sensor is a markerless motion tracking architecture capable of extracting human motion attributes under real-time constraints. It also provides skeletal tracking information modelling the human joints as 3D data representations (Zhang, 2012), as illustrated in fig. 1. The device features an "RGB camera, depth sensor and multi-array microphone running proprietary software", which provide full-body 3D motion capture, facial recognition and voice recognition capabilities.
The depth sensor consists of an infrared laser projector combined with a monochrome CMOS sensor, which captures video data in 3D under any ambient light conditions. The sensing range of the depth sensor is adjustable, and Kinect software is capable of automatically calibrating the sensor based on gameplay and the player's physical environment, accommodating for the presence of furniture or other obstacles.
3.2 Joint’s analysis related limitations
We were interested in hip joint trajectory tracking. However, in order to follow the floor trajectories, a person has to change his body posture; i.e. bend a little. Minor course deviations were also expected due to movement speed variations.
The possibility of missteps should also be considered. The dancer could slightly deviate his course and instantly correct the position. Such cases result in non-smooth areas of sensor’s calculated trajectories.
3.3 Trajectories smoothing
In order to smooth trajectory peaks, well-known techniques from the signal processing field are adopted (Orfanidis, 1995). The finite impulse response (FIR) filters is defined as:
� [ ] = ∑ � ⋅ [ − ]
=
(1) Figure 1. Kinect vertical Field of View in default range (left) and the corresponding tracked body joints (right).
Figure 2. Trajectory assessment, using Kinect sensor, adopted steps.
St
where [ ] are the initial trajectory values, � [ ] is the smooth value for the -th point, is the filter order and � is a weight factor.
Another possible smooth operator is the Infinite impulse response (IIR) filter, defined as:
� [ ] = 1
� (∑ � ⋅= [ − ]− ∑ � ⋅ [ − ]= ) (2)
The IIR filter is a combination of feed forward and feed back filters where , are the corresponding orders, and � , � the corresponding coefficients.
Finally, the Savitzky-Golay (SG) smoothing filter, a smoothing polynomial filter, has been applied. The filter is actually a generalizations of the FIR average filter that can preserve better the high-frequency content of the desired signal, at the expense of not removing as much noise as the average. An illustration of the filter outputs, for trajectory no 4, is shown in fig. 4.
4. EXPERIMENTAL SETUP
A Kinect sensor has been utilized for motion capturing in pre-defined trajectories. The sensor position was at the edge of a flat surface 0.84m from the ground floor. Although the placement position has been marked, minor displacements (few mm) are considered. The entire analysis has been done on an ordinary pc, using MATLAB software.
There was no special hardware requirements, except from the use of Kinect. The actual data trajectories are given as inputs, during the initialization of the system using a few points; Less than 5 in case of linear segments (in order to consider noise in measurement) and the radius in case of circular segments.
4.1 The monitoring area
The monitoring area was a flat surface; i.e. the floor of a room. All trajectories were designed in accordance to sensor capture area capabilities (fig. 3). The nominal limits, as given by Microsoft are for the default range between 0.8 meters and 4.0 meters, suggesting a practical range of 1.2 to 3.5 meters. Another important aspect was that the entire body of a person should appear on the generated depth maps, while following the designated trajectories.
Trajectory Number of points Actual points variance Kinect points variance Trajectory
ID Actual Kinect x axis y axis x axis y axis description
1 4 212 0,32683 0,00008 0,32683 0,00224 4-3-2-1
2 5 164 0,30648 0,00016 0,30648 0,00082 11-10-6-9-8
3 4 164 0,31472 0,00012 0,31472 0,00014 17-16-15-14
4 5 212 0,34436 0,06613 0,34436 0,06486 17-12-6-7-1
5 5 208 0,30338 0,07203 0,30338 0,09915 4-5-6-13-14
6 - 230 0,41415 0,01025 0,41415 0,01411 circular segment
Table 1. Designed (actual) trajectories related information. Additional information regarding the distribution of the Kinect’s projected trajectory points is provided.
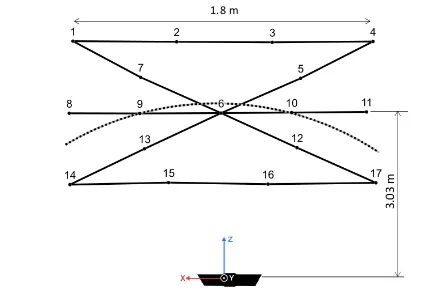
Figure 3. Designed trajectories illustration and the Kinect sensor corresponding position.
1.8 m
3
.0
3
m
Figure 4. Illustration of Kinect output projections compared to actual points of trajectory No 4. The effect of all four applied filters, on projection, is demonstrated. Measured distances for y values are meters (m).
4.2 Trajectories definition
Two types of trajectories were marked on the floor, using color tape: straight lines and curves. The lines were placed in order to form a grid with three almost horizontal and diagonal segments. Additionally, we established a cyclical segment at a radius of 1.79 m from Kinect mounting point projection on the floor. A brief description of the designed trajectories is provided in table 1.
4.3 Dancer actions
A person wearing tight-fitting clothing, in order to avoid miscalculations of the joints’ position, was asked to follow the trajectories on the floor, by stepping on them. A total of six tracks were planned along each of the five 5 line segments and one in the cyclical arc. Person’s movement’s speed varied slightly. An illustration of the test implementation is shown in fig. 5.
4.4 Data processing
At first raw data, from one out of the 20 recorded body joints, are extracted (i.e. hip joint). Data are mapped to the ground floor level in order to generate a 2D trajectory. Prior to any kind of curve analysis / comparison various issues, related to tracking capabilities had to be dealt with.
Trajectory redundant points trimming. We check if the trajectory starting (end) point coincides to the actual starting (end) point of our trajectory. Kinect sensor provided a wider range of values, outside designed trajectories. As such, we had to identify corresponding points among trajectories.
In order to interpolate corresponding points between Kinect output and actual trajectories, we had to create explicit solution for each of the designed tracks. Then, given the -axis values from the sensor, we could calculate the corresponding values of the actual trajectories, making the tracks comparable. All �, ̂� pairs (Kinect output) who were outside actual trajectory limits [ � , � ] were discarded.
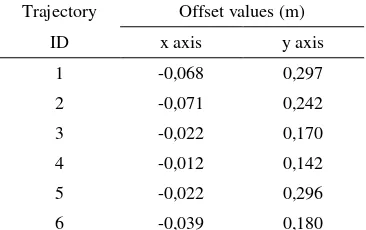
Trajectory Offset values (m)
ID x axis y axis
1 -0,068 0,297
2 -0,071 0,242
3 -0,022 0,170
4 -0,012 0,142
5 -0,022 0,296
6 -0,039 0,180
Table 3. Kinect generated trajectories starting points were always projected to 2D plane with an offset, compared to
specified trajectories position.
4.5 Performance metrics
Kinect’s captured trajectories were assessed in both curve similarity and corresponding points’ distance fields. Generally, we can describe the shape of a function through its moments. A moment is a specific quantitative measure of the shape of a set of points. The �-th moment is calculated as:
�=1∑ �� �=
(3)
where is the number of trajectory points over -axis.
Central moments are used in preference to ordinary moments, computed in terms of deviations from the mean instead of from zero, because the higher-order central moments relate only to the spread and shape of the distribution, rather than also to its location. In our case, moments up to sixth order were calculated. Figure 5. One of the main advantages of the system is the applicability at home, requiring minimal effort. The trajectories are
marked using tape (image left). The persons’ movement is recorded and projected to the ground, in order to perform the trajectory assessment and comparison process.
Traj Actual points Kinect points Errors
ID X0 Y0 X1 Y1 X2 Y2 X3 Y3 X0 Y0 X1 Y1 X2 Y2 X3 Y3 MSE MAE
1 -0,92 3,48 -0,92 3,48 0,88 3,45 0,88 3,45 -0,92 3,48 -0,92 3,48 0,88 3,32 0,88 3,32 0,0040 0,0507
2 -0,89 3,05 -0,89 3,05 0,90 3,01 0,90 3,01 -0,89 3,05 -0,89 3,05 0,90 2,98 0,90 2,98 0,0004 0,0172
3 -0,96 2,62 -0,96 2,62 0,89 2,58 0,89 2,58 -0,96 2,62 -0,96 2,62 0,89 2,59 0,89 2,59 0,0004 0,0179
4 -0,95 2,62 -0,95 2,62 0,89 3,45 0,89 3,45 -0,95 2,62 -0,95 2,62 0,89 3,51 0,89 3,51 0,0011 0,0276
5 -0,92 3,48 -0,92 3,48 0,89 2,58 0,89 2,58 -0,92 3,48 -0,92 3,48 0,89 2,51 0,89 2,51 0,0039 0,0548
6 -0,98 2,80 -0,98 2,80 0,97 2,79 0,97 2,79 -0,98 2,80 -0,98 2,80 0,97 2,73 0,97 2,73 0,0008 0,0187
Table 2. Comparison between actual and Kinect generated trajectories, illustration for four point pairs and the corresponding mean squared and absolute errors.
Prior to the moments calculation, traditional error metrics were employed to illustrate the differentiation between actual and Kinect curves.
The mean squared error (MSE) is defined as:
�� =1∑ ̂ −� �
�=
(4)
The MSE is a measure of the quality of an estimator—it is always non-negative, and values closer to zero are better. The MSE is the second moment (about the origin) of the error, and thus incorporates both the variance of the estimator and its bias.
The mean absolute error (MAE) is defined as:
�� =1∑|̂ −� �|
5 -996,5347 -995,2095 -996,1985 -995,2478 -996,2318
6 -139,9394 28,9507 -23,1350 10,5422 -3,7882
5 -999,9744 -1000,0000 -1000,0000 -1000,0000 -1000,0000
6 -141,8841 28,3000 -23,3184 10,2934 -3,7596
5 -999,9791 -997,0920 -999,8580 -996,4504 -999,4435
6 -142,6709 29,2597 -23,4983 10,4491 -3,7957
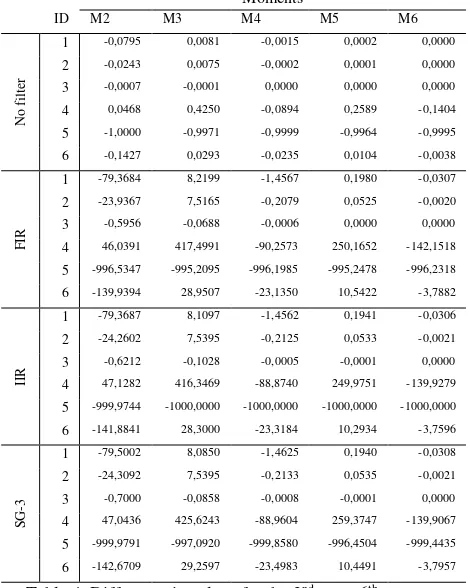
Table 4: Difference in values for the 2nd up to 6th moment
between the actual trajectory and the Kinect trajectory (no filter), including the corrected trajectories using the signal filters. For each moment the values were normalized and
multiplied by 1000 for illustration purposes.
The differences among various corresponding points between actual and Kinect’s trajectories projections on 2D planes have been evaluated using central moments. Table 4, presents the differences between original trajectories moments and the Kinect’s corresponding ones. Results table also include the moment after the application of described filters (see sec. 3.3).
Central moments of order 0 and 1 offered no additional information; i.e. their values were 1 and 0 respectively. Thus, the difference with actual moments was 0. The rest of the monuments, regardless of the applied filter appear minor differences. Consequently, the application of signal filtering should be considered in more complex trajectories, where missteps are more likely to occur.
5. CONCLUSIONS
The applicability of low cost depth sensors for the evaluation of moving patterns at home, has been investigated. Movement patterns are projected on a 2D plane and evaluated against predefined trajectories. Analysis of the trajectories provide significant data that can be utilized in many ways. Future work shall involve the transition from trajectories to Laban notation, in order to support remote tutoring and preservation of folk dances.
ACKNOWLEDGEMENTS
This work was supported by the EU H2020 TERPSICHORE project “Transforming Intangible Folkloric Performing Arts into Tangible Choreographic Digital Objects” under the grant agreement 691218.
REFERENCES
Chen, H., Miao, Z., Zhu, F., Zhang, G., Li, S., 2013. Generating Labanotation from Motion Capture Data, in: 2013 International Conference on Culture and Computing. Presented at the 2013 International Conference on Culture and Computing, pp. 222– 223. doi:10.1109/CultureComputing.2013.75
Chen, H., Qian, G., James, J., 2005. An Autonomous Dance Scoring System Using Marker-based Motion Capture, in: 2005 IEEE 7th Workshop on Multimedia Signal Processing. Presented at the 2005 IEEE 7th Workshop on Multimedia Signal Processing, pp. 1–4. doi:10.1109/MMSP.2005.248666
Choensawat, W., Nakamura, M., Hachimura, K., 2015. GenLaban: A tool for generating Labanotation from motion capture data. Multimed. Tools Appl. 74, 10823–10846. doi:10.1007/s11042-014-2209-6
Guest, A.H., 2014. Labanotation: The System of Analyzing and Recording Movement. Routledge.
Hachimura, K., Nakamura, M., 2001. Method of generating coded description of human body motion from motion-captured data, in: Proceedings 10th IEEE International Workshop on Robot and Human Interactive Communication. ROMAN 2001 (Cat. No.01TH8591). Presented at the Proceedings 10th IEEE International Workshop on Robot and Human Interactive Communication. ROMAN 2001 (Cat. No.01TH8591), pp. 122– 127. doi:10.1109/ROMAN.2001.981889
Hisatomi, K., Katayama, M., Tomiyama, K., Iwadate, Y., 2011. 3D Archive System for Traditional Performing Arts. Int. J. Comput. Vis. 94, 78–88. doi:10.1007/s11263-011-0434-2
Nahrstedt, K., Bajcsy, R., Wymore, L., Sheppard, R., Mezur, K., 2007. Computational model of human creativity in dance choreography. Urbana 51, 61801.
Orfanidis, S.J., 1995. Introduction to Signal Processing. Prentice-Hall, Inc., Upper Saddle River, NJ, USA.
Shotton, J., Fitzgibbon, A., Blake, A., Kipman, A., Finocchio, M., Moore, R., Sharp, T., 2011. Real-Time Human Pose Recognition in Parts from a Single Depth Image. Microsoft Res.
Smigel, L., Goldstein, M., Aldrich, E., 2006. Documenting Dance: A Practical Guide. Dance Heritage Coalition.
Terpsichore: Transforming Intangible Folkloric Performing Arts into Tangible Choreographic Digital Objects [WWW
Document], 2017. URL
http://cordis.europa.eu/project/rcn/199950_en.html (accessed 1.22.17).
Wilke, L., Calvert, T., Ryman, R., Fox, I., Bureau, D.N., 1932. From dance notation to human animation: The LabanDancer project. N. Y. Times.
Yang, L., Zhang, L., Dong, H., Alelaiwi, A., Saddik, A.E., 2015. Evaluating and Improving the Depth Accuracy of Kinect for Windows v2. IEEE Sens. J. 15, 4275–4285. doi:10.1109/JSEN.2015.2416651
Zhang, Z., 2012. Microsoft Kinect Sensor and Its Effect. IEEE Multimed. 19, 4–10. doi:10.1109/MMUL.2012.24