Dynamic patterns in the locomotion and feeding behaviors
by the placozoan
Trichoplax adhaerence
Tetsuo Ueda
a,*, Susumu Koya
a, Yoshihiko K. Maruyama
baResearch Institute for Electronic Science,Hokkaido Uni
6ersity,Sapporo060-0812,Japan
bGraduate School of Science,Kyoto Uni
6ersity,Kyoto,Japan
Received 21 June 1999; accepted 26 August 1999
Abstract
The placozoan Trichoplax adhaerence is one of the most primitive multi-cellular organisms, and moves about accompanying perpetual changes in its shape. Changes in position, locomotion velocity and the outer shape of the organism were monitored quantitatively with use of a computer image analysis, and their dynamic patterns in free locomotion and upon feeding were analyzed in terms of non-linear dynamics. The organism changed its behavioral patterns discontinuously in response to various concentrations of yeast extracts (food). (1) At low concentrations, the organism moved fast with perpetual random changes in shape. Both locomotion velocity and shape changes exhibited 1/f fluctuations. (2) At high concentrations, the shape of the organism as well as the locomotion exhibited oscillations with periods of about 8 min. These limit cycle oscillations bifurcated into the period 2 at the highest concentration tested. The organism flattened more strongly and the locomotion was more reduced on the whole at higher concentrations. (3) At the intermediate concentrations, two patterns as monitored above appeared: one pattern continued for a while and switched to the other abruptly. (4) The average square displacement of the organism increased linearly with time in all cases, indicating that the locomotion is a Brownian movement. In this way, the feeding behaviors by the placozoan are organized as successive co-operative transitions among non-linear dynamic states. © 1999 Elsevier Science Ireland Ltd. All rights reserved.
Keywords:Placozoan;Trichoplax; Feeding behavior; Nonlinear dynamics
www.elsevier.com/locate/biosystems
1. Introduction
The placozoan Trichoplax adhaerence F.E.
Schulze, 1883, is one of the most primitive multi-cellular organisms (Willmer, 1990). Typically the
organism takes a flattened form with a dorsal, protective and a ventral, nutritive epithelium en-closing an interspace with fiber cells (Grell and Benwitz, 1971; Behrendt and Ruthmann, 1986; Thiemann and Ruthmann, 1990, 1991). The or-ganism moves with cilial beating, and at the same time its outer shape changes perpetually. Morpho-logically this is attributed to co-ordinated contrac-tion in the fiber cell layer (Grell and Benwitz,
* Corresponding author. Tel.:+81-11-7062887; fax:+ 81-11-7064967.
E-mail address:[email protected] (T. Ueda)
1971; Ruthmann et al., 1986; Wenderoth, 1986; Thiemann and Ruthmann, 1989). Dynamical as-pects of the motile behavior, however, are yet unclear, although the periodic movement was no-ticed (Kuhl and Kuhl, 1966). Here we study the nature of the dynamic co-ordination in the feed-ing behavior by the placozoan. In the first place, we develop a fully-automated computer-assisted system to measure quantitatively changes in both the locomotion and outer shape. We show that the behavioral pattern exhibits discontinuous transitions among discrete dynamic states depend-ing on the nutrient concentrations: especially
oscillation emerges at high concentrations.
Bifurcation of the behavioral patterns and its physiological significance in comparison to those
in the multi-nucleate organism Physarum
plas-modium are discussed in terms of non-linear dynamics.
2. Material and methods
2.1. Culture of the organism
The placozoan T. adhaerence was collected at
the shore of Seto Marine Laboratory, Shirahama, Japan, and cultured in a petridish filled with artificial sea water at 20°C. Behavioral patterns in different nutrient concentrations were recorded as follows. The cover glass (24 – 32 mm) were pasted with successive dilutions of foods (prepared from Artificial Plankton B.P.; Nikon Haigou Shirhyo, Yokohama, Japan), the highest concentration
be-ing 1 g/ml. Each piece was submerged in a
sepa-rate petridish (f=5 cm) filled with artificial sea water. The organism under culture was sucked with a Pasteur pipette, washed and transferred to this chamber. The behavior of the organism was observed at 20 – 22°C under a microscope (Olym-pus, model TMD, Tokyo, Japan), and recorded with a time-lapse video recorder (Panasonic, model AG-6720, Osaka, Japan). After each mea-surement, the organism was transferred to the control solution (sea water) for about 30 min, and we confirmed that the behavioral pattern resumed to the control. Experiments were duplicated.
2.2. Measurements of shape changes and locomotion 6elocity
The video images were processed after transfer-ring to a microcomputer (Power Mac 8500, Apple Computer, USA), with use of Matrix Calculator supplied by Research Institute for Brain and Blood Vessels-Akita, Japan. The main procedures were as follows. The original image was two-val-ued at an appropriate brightness, which resulted in an image with rough boundary. The image was blurred and then two-valued again, which resulted in a smoothly connected image. Small dust spots were then eliminated. Sometimes, the inner part of original image was so bright that this part was erased by the above procedures. To eliminate this artefact, the boundary between two-valued image was position-valued, and inner part was elimi-nated, leaving the outermost boundary alone. The area and the center of gravity was then calculated. These procedures were repeated automatically, and we got time series data every 3 s. The loco-motion velocity was calculated from the variation of the center of gravity. The spectral analysis was performed with the FFT algorithm.
3. Results
3.1. Changes in the shape of the placozoan at different concentrations of nutrient
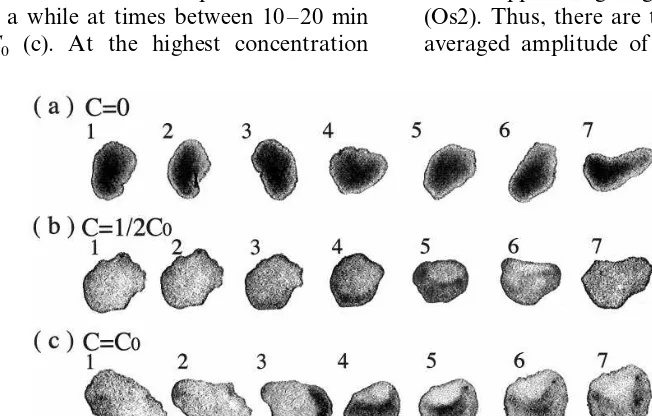
the similar oscillatory variations retained, the or-ganism flattened much strongly at certain phases (c 1 – 2, c 6 – 9, c 14 – 16). The nature of the oscilla-tory variations was analyzed later. The overall tendency (compare a, b and c) is that the surface area of the organism increases as the concentra-tion becomes high. This is desirable for the organ-ism to absorb nutrients efficiently.
3.2. Changing patterns in the outer shape of the organism
Time courses of the area of the organism at different concentrations are shown in Fig. 2. Two patterns are evident: small irregular fluctuations (a, b) and large regular oscillations (d, e) at low and high concentrations, respectively. The oscilla-tions seen in Fig. 2(c – e) have similar amplitudes and periods of about 8 min. At the intermediate concentrations both fluctuating and oscillatory variations seem to appear. The large variations
appeared once around 60 min at C=1/16C0 (b),
while the oscillations are interrupted and become irregular for a while at times between 10 – 20 min
at C=1/8C0 (c). At the highest concentration
tested, C=C0(f), the oscillations with the similar and much larger amplitudes are mixed, appearing almost alternately.
3.3. Concentration dependence of the amplitude in the area 6ariation of the placozoan
Fig. 3 shows the concentration dependence of the amplitudes in the area variation (see Fig. 2), where the averaged amplitudes are plotted against concentration in double logarithmic scale. At low concentrations, the amplitudes are small and re-main at the same level as that in the absence of nutrient. At certain critical concentrations, the amplitudes increased discontinuously by about 5-fold, and remained at this level with further in-crease in the concentration. Around the transition region, indicated by shade, the two states (Fl and Os1) coexist, switching back and forward discon-tinuously. The staying time at either state, how-ever, varies in a concentration dependent manner. At the highest concentration tested, another tran-sition appears, giving much large amplitudes (Os2). Thus, there are three states in terms of the averaged amplitude of area variation, each state
Fig. 1. Typical changes in body shape and size of the placozoanTrichoplax adhaerence. (a), (b), (c): at concentrationsC=0, 1/2C0
andC0, respectively.C0 , the highest concentration tested. The organism was allowed to move on slide glass pasted with various
Fig. 2. Time courses of the area variation in the outer shape of the placozoan at various concentrations of nutrients. Experi-mental conditions are the same as in Fig. 1. The variation exhibits only small fluctuations at lowconcentrations (a, b), but oscillates at higher concentrations than the threshold (c – f).
emerging stepwise as a function of the
concentration.
3.4. Dynamic states in terms of orbital geometry in phase space
Time courses in the area (Fig. 2) are analyzed
in terms of orbital geometry in the A(t+T0)−
A(t) space. HereA(t) is the difference in the area defined as A(t)=area(t+T1)−area(t), where area(t) is the original area data at timetandT1is taken as 4 min. This procedure eliminates slow drifting components. The typical trajectories are
shown in Fig. 4, whereT0 is taken as 3.5 min. At
low concentrations (a), the trajectory is almost a fixed point, although there are small fluctuations (see Fig. 2 a and b). At high concentrations (b), the orbit becomes a single closed circle (see Fig. 2 d and f). And at the highest concentration (c), the orbit splits into two circles, small and large ones appearing alternately (see Fig. 2 f). Thus, three states are characterized in terms of orbital geome-try, as stable point (a), limit cycle (b) and limit cycle period 2 (c).
3.5. Spectral characteristics in the changes of the outer shape of the organism: 1/f fluctuations and oscillations
The spectral characteristics in changes of area of the organism at low and high concentrations are shown in Fig. 5, where the power spectral density is plotted against frequency in double logarithmic scale. At low concentrations, where
Fig. 3. Dependence of the shape change of the placozoan on the concentration of nutrients. The amplitude in the area variations (Amp) is plotted against the concentration in double logarithmic scale. The dotted line shows the relative staying time on oscillatory state (Os1) or fluctuating state (Fl). The fluctuating state (Fl) exhibits a transition to oscillatory ones (Os1 and Os2) as the concentration increases.
Fig. 4. Orbital geometry in phase space of the feeding behavior by the placozoan. Variations of the areaA(t) as shown in Fig. 2 are plotted in the phase space ofA(t+T0) versusA(t) with T0=3.5 min. (a), (b), (c); at concentrationsC=0, 1/2C0and C0. The limit cycle oscillations appear and bifurcate to period
Fig. 5. The power spectral analysis of the area variations in the placozoan. The power spectral density (PSD) is plotted against frequency f in double logarithmic scale.(a) and (b): at low (C=0) and high (C=1/2C0) nutrient concentrations,
respec-tively. The variations in both cases exhibit 1/ffluctuations on the whole, and an oscillatory component becomes strong at high concentrations (b).
placozoan are shown in Fig. 6, where typical examples at three concentrations are shown. At low concentrations (a), the migration is fast, but the migration velocity fluctuates irregularly with large amplitudes. At high concentrations (c), the migra-tion is reduced, and exhibits oscillamigra-tions. Compar-ing Figs. 2 and 5, we notice that the phase where the organism ceases to move corresponds to the phase where the area becomes large. At the inter-mediate concentrations (b), the fast-moving fluctu-ating pattern turns abruptly into slow-moving oscillating pattern at about 50 min. In this way there are two patterns in the migration, switching with each other.
The concentration dependence of the mean mi-gration velocity is shown in Fig. 7. The mimi-gration remains at a high level (Fl) below a certain concen-tration, and jumps to a low level (Os) above the threshold concentration. At the transition region, two patterns coexist, appearing alternately. How long the each pattern continues depended on the concentration as shown by a dotted line: The higher the concentrations are, the longer the organism stays at slow-moving oscillatory states. Thus, we conclude that there are two states in migration as a function of the nutrient concentration.
3.7. The Brownian nature of the locomotion trajectory of the placozoan
The trajectory of the locomotion looks like that of a Brownian particle (Fig. 8b and c), and hence is analyzed in terms of random walk (Berg, 1993).
Fig. 6. Time courses of the locomotion velocity in the placo-zoan at various concentrations of nutrients. (a), (b), (c): at concentrations C=0, 1/16C0 and 1/2C0, respectively. The
large fluctuating variations (a, b) became small and oscillatory at higher concentrations thanC=1/16C0 (c).
Fig. 7. Dependence of the locomotion velocity on the concen-tration of nutrients in the feeding behavior by the placozoan. () and ( ): the locomotion velocity (V) averaged over 1 hour. (): fraction of staying time on fluctuating state (Fl) with respect to that on oscillatory state (Os).
the organism migrates fast, the power spectra
indicate that log PSD decreases linearly with logf
with a slope about −1. That is, the organism
exhibits 1/f fluctuations. At high concentrations, the oscillatory components with period of about 8 min become abundant, while the other frequency
components exhibit 1/f dependence as in low
concentrations.
3.6. Time courses of the migration 6elocity in the
placozoan
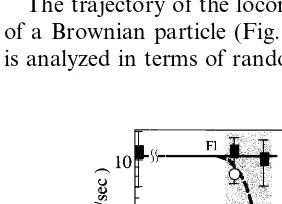
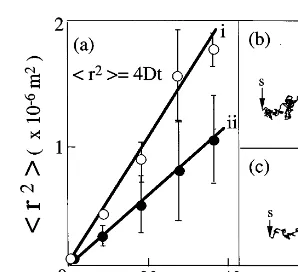
Fig. 8. The Brownian nature of the locomotion in the placo-zoan. (a): Linear relationship among square displacement (r2)
against timetat low (i) and high (ii) concentrations, respec-tively, (b) and (c): the trajectory of the organism at low (C=0) and high (C=1/2C0) concentrations, respectively. Points
where the organism started and finished are marked by s and f with an arrow, respectively.
organism exhibits the shuttle streaming of the protoplasm (Kamiya, 1959), but this is not intrinsic to the plasmodium. The vigorous rhythmic stream-ing emerges only when the size of the plasmodium exceeds a certain critical value (Koya and Ueda, 1998). Thus, the transition from a stable point to a limit cycle oscillation allows the flow of the protoplasm throughout the cell, making possible to keep the large multi-nucleate cell as a unified body. All these results suggest that the behavior of organisms is controlled co-operatively with use of non-linear dynamics when the size of the organism becomes large irrespective of the multi-cellular or multi-nucleate organisms.
References
Behrendt, G., Ruthmann, A., 1986. The cytoskeleton of the fiber cells of Trichoplax adhaerens(Placozoa). Zoomorphology 106, 123 – 130.
Berg, H.C., 1993. Random Walks in Biology? Princeton Univer-sity Press, Princeton.
Glass, L., Mackey, M.C., 1988. From Clocks to Chaos. Prince-ton University Press, PrincePrince-ton.
Grell, K.G., Benwitz, G., 1971. Die ultrastruktur vonTrichoplax adhaerensF.E. Schulze. Cytobiologie 4, 216 – 240.
Kamiya, N., 1959. Protoplasmic streaming. Protoplamatologia 8, 1 – 199.
Koya, S., Ueda, T., 1998. The onset of rhythmic streaming in the Physarumplasmodium: cooperative hierarchic organization of a multi-nucleate cell. ACH-Models Chem. 135, 297 – 304. Kuhl, W., Kuhl, G., 1966. Untersuchungen uber das
Bewe-gungsverhalten vonTrichoplax adhaerensF.E. Schulze. Z. Morpho. Okol. Tiere 56, 417 – 435.
Murray, J.D., 1993. Mathematical Biology. Springer Verlag, Berlin.
Ruthmann, A., Behrendt, G., Wahl, R., 1986. The ventral epithelium ofTrichoplax adhaerens(Placozoa): cytoskeletal structures, cell contacts and endocytosis. Zoomorphology 106, 115 – 122.
Thiemann, M., Ruthmann, A., 1989. Microfilaments and micro-tubules in isolated fiber cells ofTrichoplax adhaerens (Placo-zoa). Zoomorphology 109, 89 – 96.
Thiemann, M., Ruthmann, A., 1990. Spherical forms ofTricho -plax adhaerens(Placozoa). Zoomorphology 110, 37 – 45. Thiemann, M., Ruthmann, A., 1991. Alternative modes of
asexual reproduction in Trichoplax adhaerens (Placozoa). Zoomorphology 110, 165 – 174.
Wenderoth, H., 1986. Transepithelial cytophagy byTrichoplax adhaerens F.E. Schulze (Placozoa) feeding on yeast. Z. Naturforsch. 41c, 343 – 347.
Willmer, P., 1990. Invertebrate Relationships: patterns in ani-mal Evolution. Cambridge University Press, Cambridge.
The theory predicts that the mean square distance (r2) increases linearly with time, and that in 2D cases (r2)=4Dt, whereDis an apparent diffusion constant. The experimental results are shown in Fig. 8a, giving an expected linear relationship. The
values ofDare classified into two groups, and are
2.090.2×10−10 m2
/s and 0.8690.1×10−10 m2
/s at low and high concentrations, respectively. Thus, the organism changes its direction at random irrespective of its dynamic states.
4. Discussion
Non-linear dynamical systems far away from equilibrium exhibit series of bifurcations, giving rise a variety of spatio-temporal patterns (Murray, 1993). As applied to living systems such as hearts or brains, these transitions are often related to malfunctioning of the organs, and hence the name of ‘dynamical’ diseases is appropriate (Glass and Mackey, 1988). Contrary to these negative aspects, our results show a positive role of the bifurcation
in the feeding behavior by the placozoan Tricho
-plax adhaerence: Transitions to more expanded states in body shape and less motile state helps take in food material more effectively at higher concen-trations. Similar transitions are found in a giant