COMPARISON AND CO-REGISTRATION OF DEMS GENERATED FROM HiRISE AND
CTX IMAGES
Yiran Wang,Bo Wu*
Department of Land Surveying and Geo-Informatics, The Hong Kong Polytechnic University, Hung Hom, Kowloon, Hong Kong ([email protected], [email protected])
Commission IV, WG IV/8
KEY WORDS: Mars, DEM, HiRISE, CTX, Photogrammetry
ABSTRACT:
Images from two sensors, the High-Resolution Imaging Science Experiment (HiRISE) and the Context Camera (CTX), both on-board the Mars Reconnaissance Orbiter (MRO), were used to generate high-quality DEMs (Digital Elevation Models) of the Martian surface. However, there were discrepancies between the DEMs generated from the images acquired by these two sensors due to various reasons, such as variations in boresight alignment between the two sensors during the flight in the complex environment. This paper presents a systematic investigation of the discrepancies between the DEMs generated from the HiRISE and CTX images. A combined adjustment algorithm is presented for the co-registration of HiRISE and CTX DEMs. Experimental analysis was carried out using the HiRISE and CTX images collected at the Mars Rover landing site and several other typical regions. The results indicated that there were systematic offsets between the HiRISE and CTX DEMs in the longitude and latitude directions. However, the offset in the altitude was less obvious. After combined adjustment, the offsets were eliminated and the HiRISE and CTX DEMs were co-registered to each other. The presented research is of significance for the synergistic use of HiRISE and CTX images for precision Mars topographic mapping.
* Corresponding author
Tel.: +852 2766 4335; fax: +852 2330 2994. E-mail address: [email protected] (B. Wu). 1. INTRODUCTION
CTX and HiRISE are two imaging systems on board NASA’s MRO spacecraft. They have been widely used to derive Mars topographic products such as DEMs (Digital Elevation Models). Due to the complex environment during flight in space, the boresight parameters of the CTX and HiRISE cameras may change. These changes may lead to an inaccurate exterior orientation (EO) of the instruments and further result in inconsistencies between the 3D information obtained from HiRISE and CTX images.
Inconsistencies between the DEMs derived from the HiRISE and CTX images have been noted in the past. Kim and Muller (2009) showed that the DEMs from the CTX and HiRISE images had offsets of about 30 m. They proposed a flexible co-registration method to match the DEMs generated from HiRISE, CTX and HRSC images. Tao et al. (2014) further presented the inconsistencies among the DEMs generated from HiRISE, CTX and HRSC images. However, the inconsistency problem has not been systematically investigated in the past. Effective co-registration of the DEMs through directly adjusting the image orientation parameters has not been adequately studied.
This paper presents a systematic study of the inconsistencies between the HiRISE and CTX DEMs, and a co-registration method to eliminate the inconsistencies by improving the EO parameters of the images. Section 2 describes the specifications of the HiRISE and CTX camera, and the experimental datasets used in this research. Section 3 presents the discrepancies between the DEMs generated from HiRISE and CTX images.
Section 4 describes the co-registration method in detail. Section 5 reports the experimental analysis results. Finally, the findings are discussed and concluding remarks are presented in Section 6.
2. DATASET DESCRIPTION
The HiRISE camera features a large imaging sensor with 14 CCDs. Its effective focal length is 12 m. The camera is able to collect Martian surface images with a spatial resolution of about 0.25 m/pixel (McEwen et al., 2007). The CTX has a 350 mm focal length telescope with a 5.7° field of view. The CTX imagery has a spatial resolution of about 6 m/pixel (Malin et al., 2007).
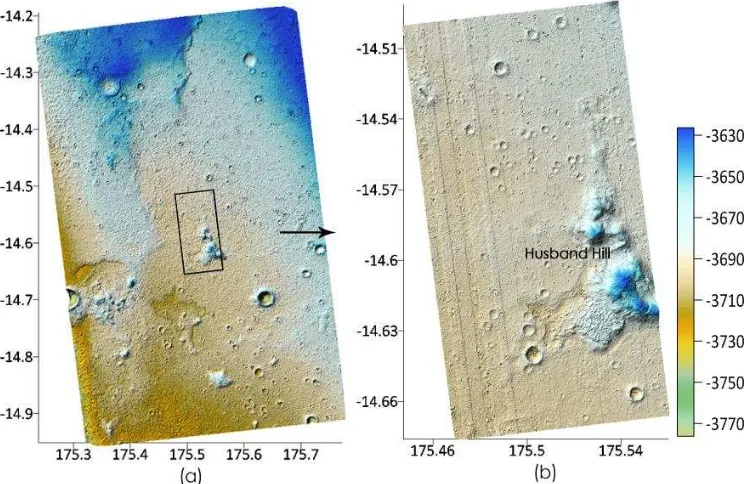
The datasets used in this research include three sets of stereo HiRISE and CTX data covering different regions of Mars. The CTX imagery has a larger coverage that is partly covered by the HiRISE imagery. Each set of data consists of two HiRISE stereo images and two CTX stereo images targeting the same objectives. The first dataset (named “Landing-Sites”) was collected from the landing site of the Mars Exploration Rover Spirit. The CTX data cover a region of 14.19° to 14.95° S and 175.24° to 175.77° E, while the HiRISE data cover 14.50° to 14.68° S and 175.45° to 175.56° E. There is an overlap of about 5% between the HiRISE and the CTX data. Figure 1 shows the CTX and HiRISE DEM of this area. The HiRISE DEM covers the central part of the CTX DEM, which is marked by a black frame in Figure 1(a). As marked in Figure 1(b), “Husband Hill” is located in the lower right-hand of the region. Spirit climbed this hill and spent the majority of its time there during the exploration mission. The other two areas are called “Possible -The International Archives of the Photogrammetry, Remote Sensing and Spatial Information Sciences, Volume XLI-B4, 2016
Fissure” and “Rayed-Crater.” “Possible-Fissure” is an area containing possible fissure sources for floodwaters. “Rayed
-Crater” is located in the Arcadia Region and contains a large impact crater. The detailed data specifications including image
ID, acquisition date, image size, resolution and the range of the HiRISE and CTX images are listed in Table1.
Name ID Acquisition
Date
Central Position
Image Size (Pixel)
(Colum Row)
Pixel Size (m/Pixel)
Emission Angle
Landing-Sites
CTX P01_001513_1654 22-Nov-2006 14.72°S 175.51°E 5056 30720 5.57 15.8° P02_001777_1653 12-Dec-2006 14.74°S 175.50°E 5056 7168 5.22 4.1° HiRISE PSP_001513_1655 22-Nov-2006 14.59°S 175.50°E 20048 80000 0.27 15.8°
PSP_001777_1650 12-Dec-2006 14.59°S 175.50°E 20048 40000 0.26 4.1°
Possible-Fissure
CTX B02_010361_1953 07-Jan-2008 15.33°N 163.37°E 5056 13312 6.11 18.1° P15_006788_1960 11-Oct-2008 16.01°N 163.27°E 5056 32768 5.60 2.6° HiRISE PSP_006788_1955 07-Jan-2008 15.31°N 163.34°E 20048 70000 0.28 2.6° PSP_010361_1955 11-Oct-2008 15.31°N 163.34°E 20048 60000 0.29 18.1°
Rayed-Crater
CTX G03_019590_2280 30-Sep-2010 48.01°N 196.86° 5056 46080 6.01 0.2° G05_020078_2267 08-Nov-2010 46.81°N 197.04° 5056 10240 6.70 19.5° HiRISE ESP_019590_2265 30-Sep-2010 46.31°N 197.09° 20048 30000 0.30 0.4°
ESP_020078_2265 08-Nov-2010 46.32°N 197.09° 20048 30000 0.32 19.4°
Table 1. Specifications of the CTX and HiRISE stereo images used in this research.
Figure 1. DEMs of the landing site of the Mars Exploration Rover Spirit. (a) DEM generated from CTX stereo pair, and (b) DEM generated from HiRISE stereo pair (it should be noted that the strip inconsistencies in the HiRISE DEM are due to the un-calibrated
CCD alignments, which is not emphasized in this research).
3. INCONSISTENCIES BETWEEN THE DEMS GENERATED FROM HIRISE AND CTX IMAGES
The processing of the images, including calibration and add-on components, was implemented using ISIS version 3 provided by the United States Geological Survey. The EO parameters of HiRISE and CTX were acquired through interpolating the
spacecraft’s trajectory and pointing vectors based on the observation time. A self-adaptive triangulation-constrained
image matching method (Wu et al., 2011, 2012; Zhu et al., 2007) was used to automatically obtain a large number of corresponding feature points (homogeneous points that represent the same texture) from the images. 3D coordinates of the matched points were then obtained by photogrammetric intersection using the image EO parameters, from which DEMs were interpolated. The resolutions of the DEMs were 1 m for the HiRISE DEM and 20 m for the CTX DEM.
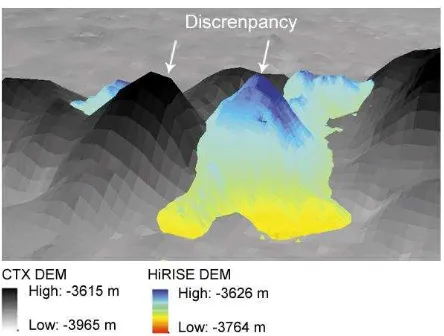
The comparisons of the CTX and HiRISE DEMs were carried out for the three selected areas as described previously. Corresponding feature points were identified from the CTX and HiRISE DEMs, and the differences between the corresponding points were used to indicate the offsets between the DEMs. Table 2 shows the statistics of the offsets between the HiRISE DEMs and the CTX DEMs. The general trends of the offsets can be observed in Table 2. For example, CTX DEMs always deviate from the HiRISE DEMs along the north-east direction. For the three cases, the offsets in the longitude (x) direction are from 140 m to 230 m, and in the latitude (y) direction from 380 m to 450 m. The offsets in the altitude (z) are not as obvious as those in the other two directions. Figure 2 shows an example of the discrepancies between the HiRISE and CTX DEMs in 3D view, where obvious shifts between the hill peaks can be observed.
Figure 2. Example of the discrepancy between HiRISE and CTX DEMs in 3D view
Table 2. Discrepancies between the DEMs generated from HiRISE and CTX images(CTX DEM minus HiRISE DEM).
4. CO-RESISTRATION OF HIRISE AND CTX DEMS
4.1 Overview of the Approach
A co-registration model was proposed to reduce the inconsistencies between the HiRISE and CTX DEMs by directly improving the EO parameters of the images. The co-registration method integrated HiRISE and CTX data according to a rigid mathematical method. Due to its relatively wider coverage and more stable sensor structure, the CTX data were regarded as reference data while the HiRISE data were regarded as slave data. Tie points were selected in the overlapping regions of the images. The EO parameters of the slave images (HiRISE images) were adjusted iteratively so that the 3D coordinates of the tie points derived from the HiRISE and CTX imagery could be matched to each other. The framework of the co-registration approach is shown in Figure 3.
Figure 3. Framework of the co-registration approach
4.2 Tie Point Selection
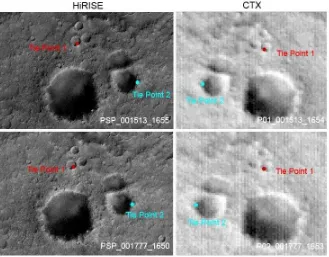
Tie point selection was an important step in this research. Due to the large differences (about 20 times) in the image resolution between the HiRISE and CTX imagery, it was difficult to automatically identify tie points from the imagery. Therefore, the tie points were marked manually. They normally represent distinctive features. Figure 4 illustrates the choosing of tie points. In Figure 4, the left side is the HiRISE stereo pair (PSP_001513_1655 and PSP_001777_1650) and the right side is the CTX stereo pair (P01_001513_1654 and P02_001777_1653). The differences in the resolutions of
Landing-Sites Possible-Fissure Rayed-Crater
x y z x y z x y z
Ave. (m) -142.81 392.59 5.50 -154.85 409.30 21.13 -225.60 431.25 -2.59
Min. (m) -154.09 379.29 -5.82 -165.94 391.14 -10.20 -242.98 408.92 -32.01 Max. (m) -130.38 408.92 18.71 -148.16 426.70 39.26 -201.50 456.33 17.03
Std. (m) 142.89 392.68 8.78 154.94 409.42 23.63 225.79 431.44 11.72
HiRISE and CTX are obvious, but the match points are still manually detectable.
To minimize error and for better convergence, 20 to 40 tie points were identified and used for each dataset.
Figure 4. Examples of identifying tie points in the HiRISE and CTX stereo images.
4.3 Co-registration Model
For the CTX and HiRISE stereo images, the relationships between image points ( , ) and their corresponding 3D ground points ( , , ) could be constructed by the following co-linearity equation:
(1)
(2)
Where ( , , ) are the coordinates of the camera perspective center, is the focal length and are the elements of a rotation matrix that is determined entirely by three rotation angles ( , , ).
The EO parameters of each line in the HiRISE and CTX images were different. These parameters could be retrieved by applying
a polynomial function by interpolating the spacecraft’s
trajectory and pointing vectors based on the observation time. The changes in the image EO parameters were approximately linear. Several interpolation approaches were attempted to model the changes. Compared with other models such as the Lagrange polynomial function and the third-order polynomial function, the second-order polynomial proved optimal as it could describe the changes relatively accurately with few parameters. The second-order polynomial function is as follows:
(3)
where is the row number of the image, , , , , and are the EO parameters of the image row r and ,..., ( = 0, 1, 2) are the coefficients of the polynomials.
The combined adjustment equation system includes the following two types of observation equations:
(4)
(5)
The first observation comprises the pseudo observations for the EO parameters of the slave image. is the vector of corrections for the image EO parameters. It should be noted that only the coefficients corresponding to the three rotation angles ( , and ; = 0, 1, 2) were adjusted during the co-registration process. is the vector of residual errors and is the observation vector of the corresponding EO parameters. The pseudo observations for the image EO parameters were selected from the initial image EO parameters, which were discrete samples along the row direction of the image. The refined EO parameters were assumed to fluctuate around them.
The second observation equation corresponds to the tie points identified from the images. The tie points connect the 3D ground points and their image measurements by the EO parameters of the images, as indicated in Equations (1) and (2). is the vector of corrections to the ground coordinates of the tie points. is the observation vector of the tie points. is the vector of residual errors for this observation equation. The adjustment process is based on a least-squares principle. The International Archives of the Photogrammetry, Remote Sensing and Spatial Information Sciences, Volume XLI-B4, 2016
5. EXPERIMENTAL RESULTS
Three datasets were used in the following experimental analysis: the HiRISE and CTX images collected at Landing-Sites, Possible-Fissure and Rayed-Crater.
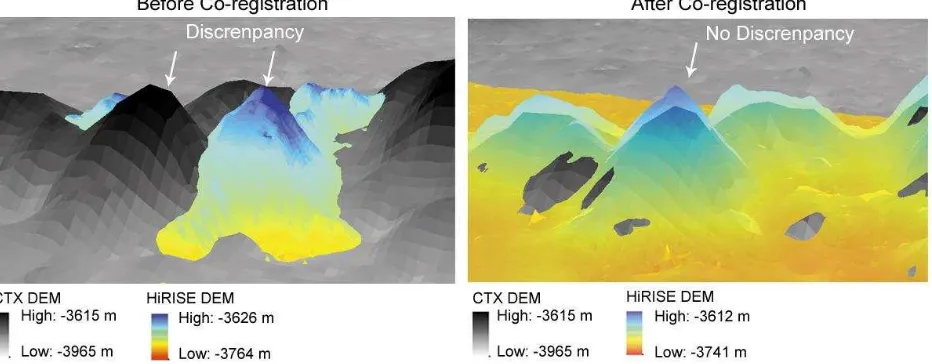
After the co-registration process, the new EO parameters of the HiRISE images were used to generate the co-registered DEM. The comparison results between the CTX DEMs and the co-registered HiRISE DEMs are summarized in Table 3. This table shows that the co-registered HiRISE DEMs were closely aligned with the CTX DEMs. The discrepancies in the longitude and latitude directions were almost removed and there were about 10 m offsets in altitude after co-registration. Taking into consideration that the resolution of the CTX DEM is 20 m and the resolution of the HiRISE DEM is 1 m, the approximately 10 m offset in altitude could have arisen from the DEM resolution differences. Compared with the offsets of several hundred meters before registration, the co-registration method was proven to be effective. Figure 5 shows
the 3D view of the co-registered DEMs, which shows that the offset between the hill peaks was removed.
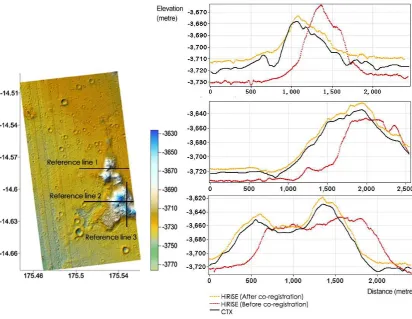
To further evaluate the performances of the co-registration algorithm, three reference lines were selected for profile analysis in the dataset of Landing-Sites. As shown in the left side of Figure 6, two east-west lines and one north-south line were selected around Husband Hill, where the DEM had the largest terrain fluctuation. Three profiles were derived for each reference line for comparison purpose, including two profiles interpolated from the original HiRISE DEM and the co-registered HiRISE DEM respectively, and one profile from the CTX DEM. Figure 6 shows that the HiRISE DEM had an obvious discrepancy when compared to CTX DEM before co-registration, while after applying the co-registration method, the differences were reduced significantly for all the three reference lines.
Detailed statistics of the three profiles derived from the CTX and HiRISE DEMs are listed in Table 4. According to the table, the discrepancies were effectively removed after the co-registration.
Landing-Sites Possible-Fissure Rayed-Crater
x y z x y z x y z
Ave. (m) -0.43 0.29 -10.01 -0.38 0.00 -7.48 -0.20 0.79 -9.96
Min.(m) -11.85 -11.85 -21.24 -11.85 -5.93 -41.60 -17.78 -11.85 -29.01
Max.(m) 11.85 17.78 1.92 5.93 5.93 12.16 23.71 11.85 4.44
Std.(m) 5.15 5.40 11.86 4.76 3.98 13.07 8.72 6.12 13.14
Table 3. Discrepancies between the CTX DEMs and the HiRISE DEMs after co-registration.
Figure 5. Comparison of HiRISE and CTX DEMs in 3D view. Left shows the 3D view of the DEMs before co-registration and right shows the 3D view after co-registration.
Figure 6. Profile comparison between the CTX and HiRISE DEMs before and after co-registration.
Ave. (m)
Max. (m)
Min. (m)
Std. (m) Reference line 1
CTX profile-HiRISE profile (before co-registration) 14.87 38.24 0.21 17.29 CTX profile-HiRISE profile (after co-registration) 6.16 13.51 0.21 6.68 Reference line 2
CTX profile-HiRISE profile (before co-registration) 18.98 61.29 0.47 24.47 CTX profile-HiRISE profile (after co-registration) 6.38 13.35 0.64 6.83 Reference line 3
CTX profile-HiRISE profile (before co-registration) 22.04 56.61 0.07 28.19 CTX profile-HiRISE profile (after co-registration) 7.75 12.95 1.65 8.24
Table 4. Statistics of the elevation differences between the profiles derived from the CTX and HiRISE DEMs.
6. CONCLUSIONS AND DISCUSSION
In this paper, a co-registration method is proposed to integrate the HiRISE and CTX DEMs. The performance of the developed approach was evaluated using HiRISE and CTX imagery in the Landing-Sites, Possible-Fissure and Rayed-Crater areas. The theoretical analysis and experimental validation showed that the co-registration method was able to co-register the HiRISE and CTX DEMs effectively. Before co-registration, the offsets between the CTX DEM and HiRISE DEM were about 140 m to 230 m in the longitude direction and about 380 m to 450 m in the latitude direction. After co-registration, the offsets were removed and the height discrepancies were also drastically reduced to the meter level.
This research permits the full comparative and synergistic use of HiRISE and CTX images for precision Mars topographic mapping.
ACKNOWLEDGMENTS
The work was supported by a grant from the Research Grants Council of Hong Kong (Project No: PolyU 5330/12E) and a grant from the National Natural Science Foundation of China (Project No. 91338110).
REFERENCE
Kim, J.-R., Muller, J.-P., 2009. Multi-resolution topographic data extraction from Martian stereo imagery. Planetary and Space Science 57, 2095-2112.
Malin, M.C., Bell, J.F., Cantor, B.A., Caplinger, M.A., Calvin, W.M., Clancy, R.T., Edgett, K.S., Edwards, L., Haberle, R.M., James, P.B., 2007. Context camera investigation on board the Mars Reconnaissance Orbiter. Journal of Geophysical Research: Planets 112.
McEwen, A.S., Eliason, E.M., Bergstrom, J.W., Bridges, N.T., Hansen, C.J., Delamere, W.A., Grant, J.A., Gulick, V.C., Herkenhoff, K.E., Keszthelyi, L., 2007. Mars reconnaissance orbiter's high resolution imaging science experiment (HiRISE). Journal of Geophysical Research: Planets 112.
Tao, Y., Muller, J., Willner, K., Morley, J., Sprinks, J., Traxler, C., Paar, G., 2014. 3D Data Products and Web-GIS for Mars Rover Mission for Seamless Visualisation from Orbit to Ground-level. The International Archives of Photogrammetry, Remote Sensing and Spatial Information Sciences 40, 249.
Wu, B., Zhang, Y., Zhu, Q., 2011. A triangulation-based hierarchical image matching method for wide-baseline images. Photogrammetric Engineering & Remote Sensing 77, 695-708.
Wu, B., Zhang, Y., Zhu, Q., 2012. Integrated point and edge matching on poor textural images constrained by self-adaptive triangulations. ISPRS Journal of Photogrammetry and Remote Sensing 68, 40-55.
Zhu, Q., Wu, B., Tian, Y., 2007. Propagation strategies for stereo image matching based on the dynamic triangle constraint. ISPRS Journal of Photogrammetry and Remote Sensing 62, 295-308.