ESTIMATION OF THE THICKNESS AND EMULSION RATE OF OIL SPILLED AT SEA
USING HYPERSPECTRAL REMOTE SENSING IMAGERY IN THE SWIR DOMAIN
G. Sicota∗
, M. Lennona, V. Miegebielleb, D. Dubucqb
a
SAS Actimar - 29200 Brest, France - (sicot, lennon)@actimar.fr
bTOTAL E&P - 64000 Pau - (veronique.miegebielle, dominique.dubucq)@total.com
KEY WORDS:hyperspectral, oil spill, thickness, emulsion rate
ABSTRACT:
The thickness and the emulsion rate of an oil spill are two key parameters allowing to design a tailored response to an oil discharge. If estimated on per pixel basis at a high spatial resolution, the estimation of the oil thickness allows the volume of pollutant to be estimated, and that volume is needed in order to evaluate the magnitude of the pollution, and to determine the most adapted recovering means to use. The estimation of the spatial distribution of the thicknesses also allows the guidance of the recovering means at sea. The emulsion rate can guide the strategy to adopt in order to deal with an offshore oil spill: efficiency of dispersants is for example not identical on a pure oil or on an emulsion. Moreover, the thickness and emulsion rate allow the amount of the oil that has been discharged to be estimated. It appears that the shape of the reflectance spectrum of oil in the SWIR range (1000-2500nm) varies according to the emulsion rate and to the layer thickness. That shape still varies when the oil layer reaches a few millimetres, which is not the case in the visible range (400-700nm), where the spectral variation saturates around 200µm (the upper limit of the Bonn agreement oil appearance code). In that context, hyperspectral imagery in the SWIR range shows a high potential to describe and characterize oil spills. Previous methods which intend to estimate those two parameters are based on the use of a spectral library. In that paper, we will present a method based on the inversion of a simple radiative transfer model in the oil layer. We will show that the proposed method is robust against another parameter that affects the reflectance spectrum: the size of water droplets in the emulsion. The method shows relevant results using measurements made in laboratory, equivalent to the ones obtained using methods based on the use of a spectral library. The method has the advantage to release the need of a spectral library, and to provide maps of thickness and emulsion rate values per pixel. The maps obtained are not composed of regions of thickness ranges, such as the ones obtained using discretized levels of measurements in the spectral library, or maps made from visual observations following the Bonn agreement oil appearance code.
1. INTRODUCTION
Oil spill detection at sea using remote sensing techniques is now used for monitoring of illegal discharges and accidents (Leifer et al., 2012). However the characterization of the spills is still a field of research. Nowadays oil spills are usually character-ized through a visual segmentation by using the Bonn agreement oil apparence code (Agreement Bonn Counter Pollution Manual, 1999). Hyperspectral remote sensing has shown some interesting results in the VNIR range (400 to 1000nm) for a rough estimation of thickness and the evaluation of volume at sea using airborne sensors (Lennon et al., 2006, Otremba and Piskozub, 2004, Wet-tle et al., 2009). During the Deepwater Horizon oil spill, Clark et al. (2010) have shown in (Clark et al., 2010) the high potential of hyperspectral data in the SWIR range (1000nm to 2500nm) for the estimation of high thickness ranges (over a millimetre) and emulsion rates. They proceed by associating shape parameters of reflectance spectra of the data to those from a spectral library. Here, we will present a method that prevents from the use of a re-flectance spectral library. That method also allows maps of thick-ness and emulsion rate values per pixel to be obtained. Those maps are then not composed of regions of thickness or emulsion rate ranges.
This study is part of a research and development project that aims to assess the ability of the hyperspectral imagery to detect, char-acterize, and identify the pollutants in an oil spill. The character-ization here consists in estimating the thickness of the pollutant layer and the emulsion rate of the mixture oil/water that compose the oil spill.
∗
Corresponding author
We will first recall the tools we have in hand: a spectral library and a model that simulate the reflectance spectra of a thin layer of an oil/water emulsion in the SWIR spectral range (Sicot et al., 2014). The laboratory measurements were performed with the parameters of the acquisition all under control. All those labora-tory measurements are collected in the spectral library that will be briefly presented in section 2. The model is presented in section 3. It shows that the size of water droplets in the emulsion is a key parameter that modifies the shape of the reflectance spectra. Un-fortunately that model appears complicated to invert and we will propose in section 4. another formulation to be used for the esti-mation of the thickness and of the emulsion rate of the oil layer. The method is applied on data obtained from airborne data ac-quisition campaigns and from the spectral library. Airborne data acquisition campaigns were carried out over real controlled oil spills at sea. Those oil discharges were organized off the coasts of Norway by the Norwegian Clean Seas Association for Operating Companies (NOFO). The last section is devoted to the analysis of the results on those data as well as on data from the Deepwater Horizon oil spill.
2. A SPECTRAL LIBRARY
those emulsions: some are produced using the polludrome (slow agitation), some using rotative flasks (slow to medium agitation), and some others using an ultra-turraxr(quick agitation). The re-flectance spectra are measured on the different emulsion types. The variation of the shape of the reflectance spectra with respect to the type of emulsion in the SWIR spectral range is put into evidence thanks to those measurements. Those observations lead us to the development of a simple radiative transfer model that intends to simulate the reflectance spectra. That model will be briefly described in the next section.
3. A RADIATIVE TRANSFER MODEL IN THE OIL LAYER
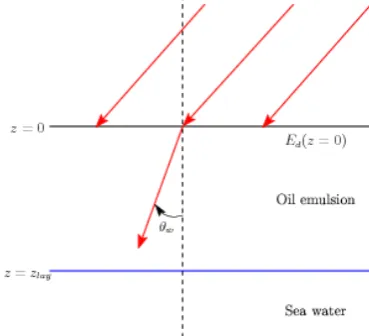
The development of the model is inspired by the models devel-oped in the water color domain (Mobley, 2010, Mobley, 1994, Morel, 1973). It is described by the illustration shown on the figure 1.
Figure 1: Illustration of the model developped in (Sicot et al., 2014) and the notations used
As shown on that figure, the model consists in a flat emulsion layer above a flat sea water surface. In the model, we consider that the sea water is clear, has an infinite depth and that the oil/ water emulsion layer is homogeneous. The model takes the as-sumption that the main reflective phenomena is due to the scat-tering of the light by water droplets in the emulsion layer. A res-olution of the radiative transfer equation can be found in (Sicot et al., 2014). Based on some approximation (the Quasi Single Scat-tering Approximation), a semi-analytic solution can be written as follows:
1
Three crude oils from West Africa, TOTAL Fluid Gazoil, SPRES Gazoil, SPRES bunker fioul, and the oil used by NOFO during the con-trolled discharge at sea
2
OSR 52 and OSR 62
3
palm oil and sunflower oil
4
A brown and a green algae
with
where rrsis the remote sensing reflectance
θ, φare the angles of acquisition
cis the diffuse attenuation coefficient
µ=cosθandµw=cosθw
zlayis the thickness of the layer
ω0is the single scattering albedo
˜
βis the normalised volume scattering function
ρis the reflexion coefficient of the interface oil/sea water
In order to lighten the notations, we do not explicitly show the dependance to wavelengths. In (Sicot et al., 2014), the parameters used to describe the scattering phenomena, the scattering part of
candβ˜, are calculated according to the Lorenz-Mie theory.
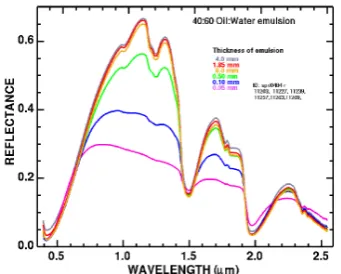
The figure 2 shows normalized reflectance spectra calculated from the model using an emulsion rate of 60%, while the figure 3 shows reflectance spectra presented in (Clark et al., 2010). The model shows some great similarities with laboratory measuments. The model is able to reproduce the behavior of the re-flectance spectra according to the thickness and to the emulsion rate (Sicot et al., 2014), and thus to show the “wide variety of shape” of the reflectance spectra, as stated in (Clark et al., 2010). The analysis of the reflectance spectra produced by the model also shows that the size of the water droplets in the emulsion is a key parameter in the reflectance spectra shape. In order to model the size of the water droplets in the emulsion layer, a function that represents the distribution of the water droplets size is intro-duced. In the figure 2, a lognormal distribution has been used for this purpose.
4. THE PROPOSED METHOD FOR THE ESTIMATION OF THE PARAMETERS
In this section, we will propose a method to estimate the thickness and the emulsion rate from a reflectance spectra. At first, we will recall the objectives and the context of its application.
4.1 Objectives and context of use
Figure 2: Normalized reflectance spectra calculated from the model using an emulsion rate of 60%
Figure 3: Example of reflectance spectra presented in (Clark et al., 2010)
maps of thicknesses and emulsion rates over the extent of the oil spills.
Hyperspectral is a passive remote sensing mean and uses the sun light as energy source. The characteristics of the atmosphere in the SWIR range should be taken into account. The atmospheric transmittance is presented on figure 4. That figure shows that the SWIR range has two opaque spectral bands and some others that are quite non-transparent due to presence of water and car-bon dioxide in the atmosphere. The wavelengths around 1100nm, from 1350nm to 1500nm and from 1800nm to 1950nm are not usable. The proposed approach should take care of this charac-teristics to be operationnally applied.
4.2 The proposed method
Our first intention was to use the model proposed in (Sicot et al., 2014) which can be summarized by the expression (1). It appears that the inversion of that model is relatively complicated due to the need to estimate the distribution of water droplets size from the reflectance spectra. The computation load would be too heavy and that makes this idea inappropriate in an operational context. We then propose to use a simplest model which would still be relevant to estimate the thickness and the emulsion rate of the oil spill, and which would in the same time be relatively invariant to the distribution of the water droplets size.
The model proposed for this purpose is described here below:
rrs(λ) =Aexp(−γ(τ awater(λ) + (1−τ)aoil(λ))zlay) (5) forλmin≤λ≤λmax
Figure 4: Atmospheric transmittance in the VNIR and the SWIR range (Richter and Schlapfer, 2012)
where λis the wavelength
A, γare constants
τis the emulsion rate
zlayis the thickness of the emulsion layer
awater(λ)is the absorption of the water
aoil(λ)is the absorption of the oil
The expression in (5) is inspired by the Beer-Lambert law. There-after, we will consider that the absorption of the water,awater(λ), and of the oil,aoil(λ), are known. The parameterγis a constant factor also considered as known.λminandλmaxwill be choosen in order to be appropriate considering the atmosphere absorption. The other parametersA,τ,zlayare the ones that have to be esti-mated by the method.
The estimation is performed thanks to an optimization method. The results presented in the next section are computed by using the Levenberg-Marquardt algorithm5. Oil shows 3 main absorp-tions bands in the SWIR (Clark et al., 2009): one at 1200nm, another one at 1730nm and the last one at 2300nm. The spectral range around the absorption at 1730nm is chosen for the esti-mation. That spectral range appears to be the best compromise between the standard signal to noise ratio of sensors in the SWIR range and the effect of the emulsion rate and thickness variation on the spectral shape. Due to the atmosphere attenuation, we set
λminto 1500nm andλmaxto 1750nm.
In the next section, we will evaluate the relevance of the expres-sion given in (5) to estimate the oil spill thickness and the emul-sion rate.
5. RESULTS
This section is dedicated to the assessment of the relevance of the expression given in (5) for the characterization of an oil spill. This task will be divided into three parts. The first part will be devoted to the analysis of the robustness of the estimator with respect to the statistical distribution of the water droplets size. This will be performed by using the model presented in section 3. The second part will use the measurements made in labora-tory. Finally in the third part we will apply our method on a real dataset acquired during the Deepwater Horizon oil spill and on dataset acquired during the controlled discharges organized by the NOFO.
5
terized. Since we did not find any previous works analyzing the distribution of water droplets in oil, we looked at models used for the parameterization of the distribution of air droplets or par-ticulates in water (Zhang et al., 2011). The two main statistical distributions used are the Junge distribution, which is similar to the power law distribution, and the lognormal distribution. In our simulations, we found that reflectance spectra computed using the lognormal distribution were more similar to the measurements made in laboratory than those computed with a Junge law. The lognormal distribution is defined by two parameters: µ andσ. The expression of the lognormal distribution is given here below:
f(x) = 1
The two parameters are the mean and the standard deviation of the logarithm of the random variable defined by the lognormal distribution. In this study, we will focus our analysis on the ro-bustness of our estimator with respect to the parameterµ.
The results of the estimation of the thickness of the emulsion layer is presented on figure 5, while the results of the estimation of the emulsion rate is presented on figure 6. The results show that the estimation of the emulsion rate seems to be independant of the size of water droplets. The figure 6 shows that the pro-posed method however underestimates a little the emulsion rate. We can also note that the method fails to estimate the emulsion rate when the layer thickness is too thin.
The analysis concerning the estimation of the thickness is less straigthforward. Please note that the parameterγhas been set to 1 to get the results. The results show that the estimation of the thickness is correlated to the thickness computed by the model, regardless of the water droplets size. It also appears that the es-timated thickness reaches a limit which depends on the emulsion rate and on the water droplets size. For example, on figure 5(a), a layer thicker than 5mm is estimated, while on figure 5(c) the estimator reaches a limit around 200-300µm. It is interesting to recall that the upper limit of the Bonn agreement oil apparence code, which is nowadays operationnally used, is 200µm. Over that limit, the thickness range can not be estimated using the Bonn agreement protocol.
5.2 Results on the spectral library
In this section, the proposed method is applied on the reflectance spectra from the spectral library. A thickness estimation limit is reached for most of the reflectance spectra, as observed in section 5.1. The results on the layer thickness thus do not appear relevant.
Results concerning the emulsion rate are presented on figure 7. The results are shown on two different oils: a crude oil on figure 7(a) and the oil used during the controlled discharged organized by the NOFO on the figures 7(b) and (c). In order to evaluate the influence of water droplets size, we present results on emulsions produced in two ways: reflectance spectra presented on figure 7(b) were measured on emulsions produced using rotative flasks, while reflectance spectra presented on figure 7(c) were measured
The image presented in this section was acquired by the Jet Propul-sion Laboratory (JPL) using an AVIRIS sensor. The data are available in radiance on the website of the aviris6. The image pre-sented on figure 8(a) is part of the flight line called f100517t01p00-r11. This line was acquired on May, the 17th, 2010. This flight line has been chosen as it has already been processed by Clarket al.and presented in (Clark et al., 2010). The first operation was to
convert the radiance datacube into surface reflectance. The atmo-spheric correction has been realized using the ATCOR software which is based on MODTRAN. On this reflectance datacube we apply our method which gives us the results presented on figures 8(b) and (c). We use the results presented in (Clark et al., 2010) for a comparative analysis of our own results.
The estimation of the emulsion rate seems to be relevant, the es-timation becoming more noisy however when the oil layer thick-ness becomes very thin. On the other hand, the estimation of the thickness layer presented on figure 8(b) overestimates compared to the results presented in (Clark et al., 2010). In order to reduce this overestimation, we can calibrate our method by settingγto 2. With this setting, the results7match more with those of Clark
et al. It has to be noticed that the estimation of the layer
thick-ness and emulsion rate is made on a per pixel basis, which allows to get a continuous spatial evolution of the thickness and of the emulsion rate.
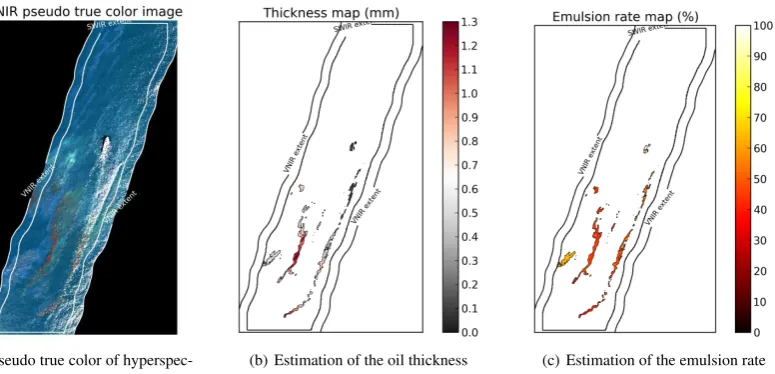
In order to show the robustness of the proposed method we have also applied the method on data acquired during the controlled discharges organized by the NOFO in june 2012. The VNIR spectral range being more adapted to characterize thin layers of oil, while the SWIR spectral range being more apppropriate on thick layers, a pre-processing has been performed in order to sep-arate the oil spill into thin layers and thick layers parts. The pro-posed method has been applied only on the thick layers parts. The results are presented on figure 9. The estimated thickness of the oil layer is often quite thin (below 1mm). The mean emul-sion rate is estimated to be around 51% which is close to the real discharged oil emulsion rate of 60%.
6. CONCLUSION
In this paper, we have presented a method which intends to es-timate on a per pixel basis the thickness and the emulsion rate of an oil slick from hysperspectral imagery in the SWIR domain. That spectral range domain has been chosen due to the potential of those wavelengths to characterize oil spill shown by Clarket al. Especially, it has been shown that thicknesses of oil layers up
to several millimeters can be estimated. The method proposed by Clarket al. is strongly based on a spectral library. In this paper,
we have presented the preliminary results of a method that in-tends to reduce the use of the spectral library by inverting a very simple model inspired by the Beer-Lambert law.
6
http://aviris.jpl.nasa.gov/data/get_aviris_data. html
7
(a) Simulations performed withµ= 5µm (b) Simulations performed withµ= 1µm (c) Simulations performed withµ= 0.2µm
Figure 5: Estimation of the thickness of the emulsion layer for several droplets size and various emulsion rates. For each figure, the distribution used for the model is the lognormal distribution withσ = 0.5. The parameterµused for the lognormal distribution is indicated in the caption of each figure. The dashed red line is the result of the ideal estimator.
(a) Simulations performed withµ= 5µm (b) Simulations performed withµ= 1µm (c) Simulations performed withµ= 0.2µm
Figure 6: Estimation of the emulsion rate of the emulsion layer for several droplets size and various emulsion rates. For each figure, the distribution used for the model is the lognormal distribution withσ= 0.5. The parameterµused for the lognormal distribution is indicated in the caption of each figure. The dashed lines are the results of the ideal estimator.
(a) Crude oil (B17G), emulsion performed with rotative flasks
(b) oil used during the discharge organized by the NOFO, emulsion performed with rota-tive flasks
(c) oil used during the discharge organized by the NOFO, emulsion performed with ultra-turraxr
Figure 7: Estimation of the emulsion rate performed on two types of oil emulsion. Regarding the oil used during the controlled discharge organized by the NOFO, results are shown on emulsions produced in two ways, one using rotative flasks (figure (b)), the other one using an ultra-turraxr(figure (c)). The dashed lines are the results of the ideal estimator.
(a) Pseudo true color of hyperspectral data
(b) Estimation of the oil thickness (c) Estimation of the emulsion rate
(a) Pseudo true color of hyperspec-tral data
(b) Estimation of the oil thickness (c) Estimation of the emulsion rate
Figure 9: Application of our method on hyperspectral data acquired by Actimar during the controlled oil discharges organized by the NOFO
In order to assess the relevance of the simple model used we have proceeded in three steps. First we have evaluated the estima-tions of the two targeted parameters on reflectance spectra simu-lated from a more complete model developed before (Sicot et al., 2014). Although that model still needs improvements, it shows that the water droplets size in the emulsion is a key parameter in the reflectance spectral shape. In a second step we have evaluated the quality of the parameters estimated from our method thanks to a spectral library which includes several types of oil and dif-ferent ways to produce emulsions. Finally we have tested our method on real datasets acquired over the Deepwater Horizon oil spill and over NOFO experiments at sea. The proposed method gives relevant results in much of the cases, and seems to be able to produce relatively reliable estimations of the thickness and of the emulsion rate of an oil slick. A calibration of the thickness estimate is potentially needed in some cases however, that has to investigated in further works.
The method proposed has the advantage to produce an estimation for each pixel of the image. As it is the result of an optimiza-tion process, the estimaoptimiza-tion is spatially continuous and does not depend on the content of a spectral library. This approach is in-novative even in the depiction of the oil spill. Indeed, the present way to describe an oil spill generally consists in using the Bonn agreement oil appearence code, which is a manual segmentation of the oil spill according to the oil appearence which can be con-verted into layer thickness intervals. We hope this new way to describe oil spills will give more accurate information to evaluate the amount of pollutant discharged and the magnitude of a spill, as well as to improve the definition of the strategy to be used to face oil spills.
ACKNOWLEDGEMENTS
The authors would like to thank the Cedre for their support in the realization of the spectral library.
REFERENCES
Agreement Bonn Counter Pollution Manual, 1999.
Clark, R. N., Curchin, J. M., Hoefen, T. M. and Swayze, G. A., 2009. Reflectance spectroscopy of organic compounds: 1. alka-nes. Journal of Geophysical Research: Planets (1991–2012).
Clark, R. N., Swayze, G. A., Leifer, I., Livo, K. E., Kokaly, R., Hoefen, T., Lundeen, S., Eastwood, M., Green, R. O., Pearson, N. et al., 2010. A method for quantitative mapping of thick oil spills using imaging spectroscopy. US Geological Survey Open-File Report 1167(2010), pp. 1–51.
Leifer, I., Lehr, W. J., Simecek-Beatty, D., Bradley, E., Clark, R., Dennison, P., Hu, Y., Matheson, S., Jones, C. E., Holt, B. et al., 2012. State of the art satellite and airborne marine oil spill remote sensing: Application to the bp deepwater horizon oil spill. Remote Sensing of Environment 124, pp. 185–209.
Lennon, M., Babichenko, S., Thomas, N., Mariette, V., Mercier, G. and Lisin, A., 2006. Detection and mapping of oil slicks in the sea by combined use of hyperspectral imagery and laser induced fluorescence. EARSeL eProceedings 5(1), pp. 120–128.
Mobley, C., 2010. Ocean optics web book.
Mobley, C. D., 1994. Light and water: Radiative transfer in nat-ural waters. Vol. 592, Academic press San Diego.
Morel, A., 1973. Diffusion de la lumi`ere par les eaux de mer. r´esultats exp´erimentaux et approche th´eorique. Optics of the Sea 61, pp. 3–1.
Otremba, Z. and Piskozub, J., 2004. Modelling the bidirectional reflectance distribution function (brdf) of seawater polluted by an oil film. Optics Express 12(8), pp. 1671–1676.
Richter, R. and Schlapfer, D., 2012. Atmospheric/topographic correction for airborne imagery: Atcor-4 user guide. DLR IB pp. 565–02.
Sicot, G., Lennon, M., Miegebielle, V. and Dubucq, D., 2014. Analysis of the reflectance spectra of oil emulsion spilled on the sea surface. In: SPIE Remote Sensing, International Society for Optics and Photonics, pp. 924007–924007.
Wettle, M., Daniel, P. J., Logan, G. A. and Thankappan, M., 2009. Assessing the effect of hydrocarbon oil type and thickness on a remote sensing signal: A sensitivity study based on the optical properties of two different oil types and the hymap and quickbird sensors. Remote Sensing of Environment 113(9), pp. 2000–2010.