SPECTRAL DISCRIMINATION AND REFLECTANCE PROPERTIES OF VARIOUS
VINE VARIETIES FROM SATELLITE, UAV AND PROXIMATE SENSORS
C. Karakizi, M. Oikonomou, K. Karantzalos
Remote Sensing Laboratory, National Technical University of Athens Heroon Polytechniou 9, 15780 Zographos, Greece
[email protected]; [email protected]; [email protected]
KEY WORDS: Precision agriculture, Viticulture, Spectral signatures, Classification
ABSTRACT:
An assessment of the spectral discrimination between different vine varieties was undertaken using non-destructive remote sensing observations at the véraison period. During concurrent satellite, aerial and field campaigns, in-situ reflectance data were collected from a spectroradiometer, hyperspectral data were acquired from a UAV and multispectral data from a high-resolution satellite imaging sensor. Data were collected during a three years period (i.e, 2012, 2013 and 2014) over five wine-growing regions, covering more than 1000ha, in Greece. Data for more than twenty different vine varieties were processed and analysed. In particular, reflectance hyperspectral data from a spectroradiometer (GER 1500, Spectra Vista Corporation, 350-1050nm, 512 spectral bands) were calculated from the raw radiance values and then were correlated with the corresponding reflectance observations from the UAV and satellite data. Reflectance satellite data (WorldView-2, 400nm-1040nm, 8 spectral bands, DigitalGlobe), after the radiometric and atmospheric correction of the raw datasets, were classified towards the detection and the discrimination of the different vine varieties. The concurrent observations from in-situ hyperspectral, aerial hyperspectral and satellite multispectral data over the same vines were highly correlated. High correlations were, also, established for the same vine varieties (e.g., Syrah, Sauvignon Blanc) cultivated in different regions. The analysis of in-situ reflectance indicated that certain vine varieties, like Merlot, Sauvignon Blanc, Ksinomavro and Agiorgitiko possess specific spectral properties and detectable behaviour. These observations were, in most cases, in accordance with the classification results from the high resolution satellite data. In particular, Merlot and also Sauvignon Blanc were detected and discriminated with high accuracy rates. Surprisingly different clones from the same variety could be separated (e.g., clones of Syrah), while they were confused with other varieties (e.g., with Riesling).
1. INTRODUCTION
There are numerous Vitis vinifera L. vine varieties cultivated worldwide and their management, grape/wine quality potential and respective economic value is variety dependent (Clarke and Rand, 2010; Diago et al., 2013). Therefore the identification of the specific spectral properties and the discrimination of different vine varieties are of major importance for farmers, wine producers, geospatial engineers and government activities. Apart from the conventional analytical techniques employed to discriminate several vine varieties, such as amplelometry (Galet, 1979), wet chemistry methods, or DNA analysis (Sefc et al., 2001), the exploitation of non-destructive remote sensing techniques appears a promising and effective alternative. To this end, recent studies applied close-range reflectance spectroscopy and statistical analysis, discriminating successfully grapevine (Diago et al., 2013) and strawberries (Sáncheza et al., 2012) varieties.
At the same time, multispectral and hyperspectral sensors onboard satellite, aerial and UAV platforms are dominating in most precision agriculture acquisition systems. Open data policies both in US and EU and commercial earth observation satellite missions are delivering an unprecedented volume of data with increasing level of detail and accuracy. In particular, for more than a decade now (Bramley and Proffitt 1999; Hall et al. 2002; Johnson et al. 2003) research efforts are focusing on the exploitation of satellite image data at different spatial, spectral and temporal resolutions towards the efficient analysis
and monitoring of vine crops through remote sensing sensors and techniques.
However, the discrimination of vine varieties from remote sensing data is not a heavy studied problem and has been mainly studied through the exploitation of hyperspectral data and towards the discrimination of few varieties. Lacar et al. (2001) obtained CASI (Compact Airborne Spectrographic Imager) hyperspectral data over a vineyard in the Barossa Valley, South Australia in an attempt to discriminate between the grape cultivars, Cabernet Sauvignon and Syrah. Maximum likelihood classification was employed and the discrimination results were successful with 91.5% of vine rows correctly classified. With the same goal, Ferreiro-Armán et al. (2006) employed again CASI hyperspectral data at 3m spatial resolution and 144 spectral bands over the Domain Château Luchey-Halde (Bordeaux, France). This study experimented with different classification techniques and the resulted overall accuracy was at about 90% for the discrimination of two vine varieties per time. In 2007, Ferreiro-Armán et al. employed the CASI-2 hyperspectral sensor and supervised classification techniques for the discrimination of three vine varieties over the Pessac-Léognan area (Bordeaux, France), under constant and varying within-scene illumination conditions. The discrimination by pairs reported overall accuracy rates of about 82%.
discriminate several vine varieties under a single classification procedure. To this end, multi-sensor data from concurrent satellite, aerial and field campaigns were acquired, processed and analysed. The spectral properties and the level of potential discrimination were highlighted during the intensive experiments and performed comprehensive validation.
2. MATERIALS AND METHODS
2.1 Study Areas
Data acquisition campaigns were conducted in five different viticulture regions in Greece (from central to north regions) all belonging to local Protected Geographical Indication zones (PGI). Concurrent satellite or aerial and field campaigns were scheduled during the véraison period. They were conducted in 2012, 2013 and 2014 from early July to early August.
The first study area, Trapeza, is located in the Northern Peloponnese, inside the P.G.I. zone Plagies Aigialeias, at an altitude of about 800m over the Trapeza village. Eight different vine varieties are cultivated in this particular region with Syrah and Sauvignon Blanc among the most important for winemaking. The second region, Megaplatanos, is located in Central Greece, inside the P.G.I. zone Koilada Atalantis, at an altitude of about 60m above sea level. More than 20 different vine varieties are cultivated in this area. During this study we focused mainly on six of those including Chardonnay, Robola and Cabernet Sauvignon.
The third study area, Naoussa, is located in Western Macedonia, inside the P.G.I. zone Naoussa and more specifically near the Giannakochori village. The altitude of the region is about 200m above sea level. More than nine different varieties are cultivated in the region. Ksinomavro, Merlot and Syrah are the dominating varieties for winemaking purposes. The forth study area, Amynteo, is located in Western Macedonia, inside the P.G.I. zone Florina near the Amynteo village, at an altitude of about 600m above sea level. Various different varieties are cultivated in the region. During this study we focused on the Syrah, Tannat and Montepulciano varieties. Last but not least, the Nemea study area is located in North-East of Peloponnese, with the Agiorgitiko variety the dominating one for red winemaking. Nemea- Agiorgitiko is the grape allowed to use the Nemea Appellation (PDO Nemea). During this study we focused on vineyards near the semi-mountainous village of Asprokambos at an altitude of about 700m above sea level.
2.2 Satellite, UAV and Field Campaigns
High resolution multispectral satellite imagery was acquired from the WorldView-2 satellite, in GeoTIFF format of 16 bits color depth. Images were acquired during the véraison period and in particular on the 31 July 2012 for the Trapeza and Megaplatanos regions, on 29 July 2013 for the Naoussa region and on 01 August 2013 for the Amynteo region. The WorldView-2 satellite carries an imaging instrument containing a high-resolution panchromatic band with a reduced infrared and blue response and eight (8) lower spatial resolution spectral bands. WorldView-2 captures panchromatic imagery of 0.5m spatial resolution and 8-band multispectral imagery of 2m resolution. The four primary multispectral bands include traditional Blue at 480nm, Green at 545nm, Red at 660nm, and Near Infrared band at 835nm. Four additional bands include a shorter wavelength blue band, centered at 425nm, called the
coastal band for its applications in water color studies; a yellow band centered at 605nm, a red edge band centered strategically at 725nm, at the onset of the high reflectivity portion of vegetation response, and an additional, longer wavelength near infrared band, centered at 950nm, which is sensitive to atmospheric water vapour.
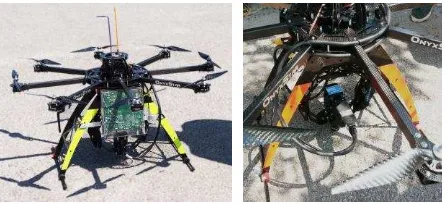
An aerial campaign with an unmanned aerial vehicle was conducted on the 3 of August 2014 at the Nemea study area. A multicopter (OnyxStar BAT-F8, Altigator, Belgium) with electronic controllers and navigation systems (BL-Ctrl V2.0, Navi-Ctrl v2.0, Mikrokopter, Germnay) equipped with a push-broom hyperspectral VNIR imaging sensor (Micro-Hyperspec A-Series 380nm-1000nm, Headwall Photonics, USA) mounted and stabilized thought a camera gimbal (AV200, PhotoHigher, New Zealand) were employed. The sensor was connected with a custom-made lightweight mini-ITX with low power consumption (Figure 1).
In all study areas along with the satellite or aerial campaigns intensive field campaigns were conducted in order to collect reference/ground truth data including the precise location and variety of each parcel, vineyard or vine row. Existing maps with geographic information and varietal plantation were verified or updated during field surveys. In situ reflectance measurements were performed using the GER 1500 (Spectra Vista Corporation, US) portable spectroradiometer which provides spectra with 512 spectral bands distributed in the spectral region from 350nm to 1050nm with 3.2 nm FWHM. The position of each measurement was recorded using a portable GPS.
Before the main processing steps, radiometric and atmospheric corrections were performed on the satellite imagery towards the elimination of solar illumination, atmospheric and terrain effects. Digital numbers of relative radiance were converted to absolute radiance using the absolute radiometric calibration factors and effective bandwidths for each band. Atmospheric correction was then conducted through Fast Line-of-sight Atmospheric Analysis of Hypercubes (FLAASH). On the same basis, the spectral readings, from the portable spectroradiometer were taken with nadir view in the principal plane, while absolute bi-directional reflectance values were obtained by normalizing the readings with a certified panel.
2.3 Classification Procedure
The detection and discrimination of the different vine varieties from the very high resolution multispectral data was based on a supervised classification procedure through object-based image Analysis (Blaschke, 2010; Tzotsos et al., 2014).
During the first processing step, a fine segmentation was computed creating image objects of about 1-4 pixels size. Training samples were manually collected by the expert using reference and ground truth data. The percentage of samples to objects varied from 1-3% per variety. During the next processing step, a supervised classification took place based on a standard nearest neighbour classifier. Image objects were classified and a membership value (between zero and one) was assigned according to the distance of object feature space to its nearest neighbor. This distance was associated with a fuzzy dependency with the nearest sample of a given class. The basic features considered for the feature space of the classifier were spectral (mean layer intensities) along with certain band ratios (e.g., mean NIR1/ mean Blue ratio, mean NIR2 / Red ratio). In all study areas, more than ten vine varieties were studied and various combinations, from three up to six different varieties, were given as an input during this discrimination procedure.
3. EXPERIMENTAL RESULTS AND VALIDATION
3.1 Qualitative and Quantitative Evaluation
Regarding the classification and vine variety discrimination procedure, a quantitative assessment was performed on the classified images based on reference/ground truth data. Reference data were collected after a comprehensive digitization procedure, done by an expert in all available datasets. The quantitative evaluation at pixel level was based on
the calculated confusion matrix which allows visualization of the classification performance. The diagonal of the confusion matrix expressed the completeness rates of detection accuracy for each variety. The classification results were also evaluated at parcel-level, through majority voting; the variety achieving the higher completeness percentage of parcel’s ground truth pixels, labelled the parcel and then each parcel’s classification was compared with the ground truth data.
3.1.1 Trapeza Study Area: In the study area of Trapeza six
different vine varieties/clones (i.e, Merlot, Riesling, Sauvignon Blanc clone I and clone II, Syrah clone I and clone II) took part in the supervised classification procedure. Experiments with four, five and six varieties per classification were performed. At pixel level, the overall accuracy of the classification ranged from 75% to 61%, decreasing as the number of classes/varieties increased.
In all classification experiments the Merlot variety was the most distinguishable with high detection rates at pixel level. Only few Merlot vines were confused with the Riesling ones. Moreover, Sauvignon Blanc (both examined clones) resulted into high detection completeness rates (>76%) at pixel level. Again only a few Sauvignon Blanc vines were confused with the Syrah (clone I) vines with rates of about 10-15%. Surprisingly, in-between the two Syrah clones low mis-classification rates (about 10-15%) were reported. The varieties which were more confused by the classifier were Riesling Figure 2. Vine variety discrimination results in the Trapeza study area. Six different vine varieties were discriminated i.e., Merlot,
Riesling, Sauvignon Blanc clone I, Sauvignon Blanc clone II, Syrah clone I and clone II. The quantitative evaluation resulted at overall accuracy rates of 61% at pixel level and 100% at parcel level.
Evaluation at pixel level Classified as
Ground Truth Syrah Ι Syrah ΙΙ Merlot Sauvignon Blanc II
Sauvignon
Blanc I Riesling
Syrah Ι 67% 3% 2% 10% 12% 7%
Syrah ΙΙ 10% 45% 8% 2% 4% 31%
Merlot 4% 6% 65% 6% 3% 17%
Sauvignon Blanc II 15% 1% 4% 78% 1% 0%
Sauvignon Blanc I 10% 4% 2% 5% 76% 4%
Riesling 14% 27% 10% 1% 5% 43%
Overall Accuracy 61%
and Syrah (clone II) with rates of approximately 27%. After the majority voting and at parcel level the algorithm managed to detect successfully (100% detection rate) all the vine varieties at every parcel.
In Figure 2, the resulted classification map for the Trapeza study area is presented. After a close look into the ground truth and the resulted classification, one can observe that the majority of Merlot, Sauvignon Blanc and Syrah varieties/clones were correctly detected. The Riesling and the Syrah (clone II) class presented the lower detection rates at pixel level. These qualitative observations were in accordance with the performed quantitative evaluation at pixel level (Table 1). In particular, Merlot, Sauvignon Blanc clones and Syrah clone I resulted into the highest completeness rates (65%-78%).
The aforementioned results were generally in accordance with the results from the analysis of the numerous observations from the field spectroradiometer. In particular, the Merlot vines were characterized by the most distinguishable spectral signature, presenting the highest reflectance values across spectrum. The Sauvignon Blanc and the Syrah varieties possessed different and detectable spectral behaviors, while the Maurodafni reflectance values were the lowest ones across spectrum. These results were, also, verified by the calculated correlation rates among the hyperspectral reflectance signatures from the field spectroradiometer and the satellite (Worldview-2) intensity
values for the corresponding vines and canopy. In particular, experimental results based on linear regression indicated high r2 (> 92%) rates for e.g., the Merlot and Sauvignon Blanc and lower for the Maurodafni variety.
3.1.2 Megaplatanos Study Area: In the Megaplatanos study
area six different vine varieties, namely Sauvignon Blanc, Syrah, Chardonnay, Merlot, Robola and Cabernet Sauvignon took part in the supervised classifications. Four, five and six different varieties were employed under the classification procedure. At pixel level, the resulted overall classification accuracy ranged from 69% to 58%, decreasing as the number of classes/varieties increased.
Again, the Merlot vines were the most distinguishable in all experiments resulting to detections rates of over 86%. Only a few Merlot vines were confused with other varieties. Note that there were not any Riesling vines in this study area as in Trapeza. The Cabernet Sauvignon vines were confused with rates of about 25% at pixel level with the Sauvignon Blanc and Syrah ones. At pixel-level, Chardonnay vines resulted to mis-classification errors of about 20% and were mainly confused with the Cabernet Sauvignon and the Sauvignon Blanc. The Robola variety was, also, confused with rates of approximately 20% with the Cabernet Sauvignon and Chardonnay varieties. After the majority voting procedure the detection results at Figure 3. Vine variety discrimination results in the Megaplatanos study area. Four different vine varieties were discriminated i.e.,
Cabernet Sauvignon, Merlot, Sauvignon Blanc and Syrah. The quantitative evaluation indicated overall accuracy rates of 69% at pixel level and 94% at parcel level.
Evaluation at pixel level Classified as
Ground Truth Sauvignon
Blanc
Cabernet
Sauvignon Merlot Syrah
Sauvignon Blanc 57% 31% 2% 11%
Cabernet Sauvignon 13% 76% 1% 11%
Merlot 2% 6% 88% 5%
Syrah 16% 25% 7% 53%
Overall Accuracy 69%
parcel level were relative high (> 94%), indicating that the vast majority of all varieties were correctly classified at every parcel.
In Figure 3, the classification result after the application of the proposed vine variety discrimination methodology using four different varieties (Cabernet Sauvignon, Merlot, Sauvignon Blanc and Syrah) for the Megaplatanos study area is presented. As it can be observed the majority of Merlot and Cabernet Sauvignon pixels were correctly classified, while Sauvignon Blanc and Syrah present a number of misclassified pixels. These qualitative observations were also confirmed by the performed quantitative evaluation (Table 2).
In addition, the analysis of the reflectance values from the concurrent observations from the field spectroradiometer was generally in accordance with the aforementioned satellite imaging results. In particular, again the Merlot variety (here, the Syrah, also) possessed the most distinguishable spectral behavior among the varieties of this study area, presenting high reflectance values. The Robola vine variety presented the lower reflectance values, especially in the green and near infrared spectral region. Note that in this study area Maurodafni vines were not examined. The Cabernet Sauvignon and Grenache varieties demonstrated also, a different and distinguishable spectral behavior when comparing with the other varieties in this area. Quantitative results regarding the correlation between field and satellite reflectance indicated high r2 (> 90%) correlation rates for e.g., Merlot and Syrah and lower for e.g., Cabernet Sauvignon and Grenache.
3.1.3 Naoussa Study Area: In the study area of Naoussa
four different vine varieties (i.e, Syrah, Merlot, Cabernet Sauvignon and Ksinomavro) took part in the classification procedures towards the discrimination of three and four different vine varieties per time. At pixel level the overall classification results reached approximately an accuracy of 60%. Again, the Merlot vines were detected with the highest completeness rates. The Ksinomavro variety resulted to mis-classification rates, to all other varieties, of about 14% - 19%. Cabernet Sauvignon and Syrah appeared correlated (rates of about 17-22%) and both highly correlated to class Merlot as percentages of over 20% of their ground truth pixels were falsely classified as Merlot.
In particular, the Ksinomauro and Merlot varieties were the ones with the most distinguishable spectral behaviors.
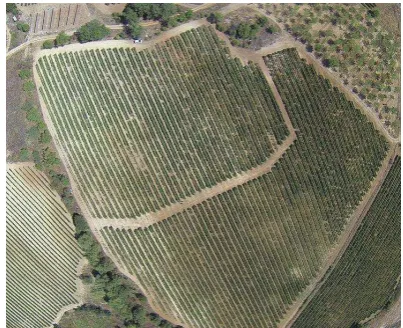
Figure 4. The Nemea study area with few of the Agiorgitiko vineyards.
In particular, the Ksinomauro and Merlot varieties were the ones with the most distinguishable spectral behaviors. The Ksinomauro presented the highest reflectance across the spectrum, while the Merlot a quite different level and pattern in the near infrared region. Moreover, the combined study including both satellite and field observations from the same vines, indicated again that the Merlot and Ksinomauro varieties were the most distinguishable and with high correlation rates (r2) 88% and 87%, respectively.
3.1.4 Amynteo Study Area: In the Amynteo study area four
vine varieties and clones, namely the Syrah (clone I and clone II), Montepulciano and Tannat took part in the vine discrimination experiments. At pixel level, the overall classification accuracy was about 63%. Similar with the Trapeza study area, between the two Syrah clones the confused pixels were relative low and reached an approximate 15%. On the contrary, the first clone of the Syrah variety presented higher confusion rates (25%) with the Montepulciano variety. The Tannat variety had a relative high percentage of its ground truth pixels (42%) mis-classified as Syrah (clone II), but still class Tannat held the higher (43%) percentage. In all cases, however, after the majority voting post-processing procedure the quantitative evaluation resulted to a successful 100% accurate rate, indicating that all the vine varieties were correctly detected at every single parcel/vineyard.
The analysis of the numerous concurrent hyperspectral reflectance observations from the field spectroradiometer indicated again that the Merlot variety held both high reflectance values and different spectral behavior when compared to the spectral signatures of all the other vine varieties of the study area. However, the Tannat which resulted to lower classification rates in the satellite data, was among the most distinguishable varieties. In particular, the spectral signature of Tannat presented the highest reflectance rates especially in the near infrared spectral region. At the same time the Montepulciano presented the lowest reflectance rates especially in the green and near infrared spectral regions. The high correlation rates (mean r2 at 93%) between the corresponding field and satellite reflectance over the same vines and their comparative analysis indicated that the Merlot and the Montepulciano varieties possessed among the most distinguishable spectral properties in this study area.
3.1.5 Nemea Study Area: In the study area of Nemea
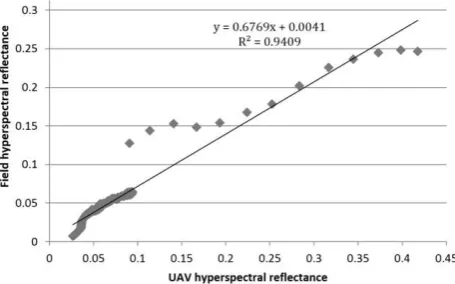
(Figure 4) aerial and concurrent field campaigns were conducted with a push-broom hyperspectral sensor and a portable spectroradiometer. The aerial data acquisition resulted to an image mosaic with approximately 10cm spatial resolution. Numerous in-situ observations with the portable spectro-radiometer were collected and the reflectance response was calculated (Figure 5). In this study area the vine variety Agiorgitiko is considered the most important regarding cultivation and wine making. To this end, different clones of Agiorgitiko were examined while focusing on the relation and correlation between the proximate and aerial hyperspectral data. More specifically, in the same locations with the in-situ reflectance data the relationship with the aerial hyperspectral data were estimated. The high correlation rate (r2 >94%) indicated the consistency of the acquired dataset (Figure 6). In relation with the other examined, in this study, varieties the Agiorgitiko, similar to Merlot, can be characterized as one with a detectable spectral signature presenting specific pattern and high reflectance values across the VNIR spectrum.
4. CONCLUSIONS
In this paper, the spectral discrimination between different vine varieties was studied. During concurrent satellite, aerial and field campaigns, in-situ reflectance data were collected from a spectroradiometer, hyperspectral data were acquired from a UAV and multispectral data from a high-resolution satellite imaging sensor. Data were collected for three years (i.e, 2012, 2013 and 2014) over five wine-growing regions, covering more than 1000ha, in Greece. Data for more than twenty different vine varieties were processed and analysed. The in-situ hyperspectral, the aerial hyperspectral and satellite multispectral data were highly (above 83%) correlated. High correlations were, also, established for the same vine varieties (e.g., Syrah, Sauvignon Blanc) over different growing regions. The analysis indicated certain vine varieties, like Merlot, Sauvignon Blanc, Ksinomavro and Agiorgitiko with spectral properties and detectable behaviour across spectrum. These observations were, in most cases, in accordance with the analysis and resulting classification maps from the high resolution satellite data. In particular, Merlot and Sauvignon Blanc were detected and classified with high accuracy rates. Surprisingly different clones from the same variety could be separated (e.g., clones of Syrah), while they were confused with other varieties (e.g., with Riesling).
ACKNOWLEDGEMENTS
This work was financially supported by “IKY FELLOWSHIPS OF EXCELLENCE FOR POSTGRADUATE STUDIES IN GREECE – SIEMENS PROGRAM”.
REFERENCES
Blaschke, T., 2010. Object based image analysis for remote sensing. ISPRS Journal of Photogrammetry and Remote Sensing, 65(1), 2-16.
Bramley, R.G.V. & Proffitt, A.P.B., 1999. Managing variability in viticultural production. Grapegrower and Winemaker, 427, 11–16.
Clarke, O. & Rand, M., 2010. Grapes Wines: A Comprehensive Guide to Varieties and Flavours. Sterling Epicure, New York, USA.
Diago, P.D., Fernandes, A.M., Millan, B., Tardaguila, J. & Melo-Pinto, P., 2013. Identification of grapevine varieties usingleaf spectroscopy and partial least squares. Computers and Electronics in Agriculture, 99, 7–13.
Ferreiro-Armán, M., Alba-Castro, J. L., Homayouni, S., Da Costa, J. P. & Martín-Herrero, J., 2007. Vine variety discrimination with airborne imaging spectroscopy. Proc. SPIE Remote Sensing and Modeling of Ecosystems for Sustainability IV, 667909.
Ferreiro-Armán, M., Da Costa, J. P., Homayouni, S. & Martín -Herrero, J., 2006. Hyperspectral image analysis for precision viticulture. Lecture Notes in Computer Science, 4142, 730-741.
Galet, P., 1979. A practical ampelography: grapevine identification. A practical ampelography: grapevine identification, Ithaca, N.Y., Comstock Pub. Associates.
Hall, A., Lamb, D.W., Holzapfel, B. & Louis, J., 2002. Optical remote sensing applications in viticulture – a review. Australian Journal of Grape and Wine Research , 8, 36–47.
Johnson, L. F., Roczen, D. E., Youkhana, S. K., Nemani, R. R., & Bosch, D. F., 2003. Mapping vineyard leaf area with multispectral satellite imagery. Computers and Electronics in Agriculture, 38, 33–44.
Lacar, F.M., Lewis, M. M. & Grierson, I.T., 2001. Use of hyperspectral imagery for mapping grape varieties in the Barossa Valley, South Australia. Proceedings of the Int. Geoscience and Remote Sensing Symposium, Sydney Australia, 6, 2875 - 2877.
Sánchez, M.T., De la Haba, J.M., Benítez-López, M., Fernández-Novales, J., Garrido-Varo, A. & Pérez-Marín, D., 2012. Non-destructive characterization and quality control of intact strawberries based on NIR spectral data. Journal of Food Engineering, 110, 102–108.
Sefc, K.M., Lefort, F., Grando, M.S., Scott, K.D., Steinkellner, H. & Thomas, M.R., 2001. Microsatellite markers for grapevine: a state of the art. In: RoubelakisAngelakis, K.A. (Ed.), Molecular Biology Biotechnology of Grapevine. Kluwer Academic Publishers.