PHOTOGRAMMETRIC MEASUREMENTS IN FIXED WING UAV IMAGERY
E. Gülch
University of Applied Sciences Stuttgart, Department of Geomatics, Computer Science and Mathematics, Schellingstr.
24, 70174 Stuttgart, Germany - eberhard.guelch@hft-Stuttgart.de
ICWG I/V
KEY WORDS: UAVs, Photogrammetry, Image Quality, Aerial Triangulation, DEM/DTM, Orthoimage
ABSTRACT:
Several flights have been undertaken with PAMS (Photogrammetric Aerial Mapping System) by Germap, Germany, which is briefly introduced. This system is based on the SmartPlane fixed-wing UAV and a CANON IXUS camera system. The plane is equipped with GPS and has an infrared sensor system to estimate attitude values. A software has been developed to link the PAMS output to a standard photogrammetric processing chain built on Trimble INPHO. The linking of the image files and image IDs and the handling of different cases with partly corrupted output have to be solved to generate an INPHO project file. Based on this project file the software packages MATCH-AT, MATCH-T DSM, OrthoMaster and OrthoVista for digital aerial triangulation, DTM/DSM generation and finally digital orthomosaik generation are applied.
The focus has been on investigations on how to adapt the “usual” parameters for the digital aerial triangulation and other software to the UAV flight conditions, which are showing high overlaps, large kappa angles and a certain image blur in case of turbulences. It was found, that the selected parameter setup shows a quite stable behaviour and can be applied to other flights. A comparison is made to results from other open source multi-ray matching software to handle the issue of the described flight conditions.
Flights over the same area at different times have been compared to each other. The major objective was here to see, on how far differences occur relative to each other, without having access to ground control data, which would have a potential for applications with low requirements on the absolute accuracy. The results show, that there are influences of weather and illumination visible. The “unusual” flight pattern, which shows big time differences for neighbouring strips has an influence on the AT and DTM/DSM generation. The results obtained so far do indicate problems in the stability of the camera calibration. This clearly requests a usage of GCPs for all projects, independent on the application. The effort is estimated to be even higher as expected, as also self-calibration will be an issue to handle a possibly instable camera calibration.
To overcome some of the encountered problems with the very specific features of UAV flights a software UAVision was developed based on Open Source libraries to produce input data for bundle adjustment of UAV images by PAMS. The empirical test results show a considerable improvement in the matching of tie points. The results do, however, show that the Open Source bundle adjustment was not applicable to this type of imagery. This still leaves the possibility to use the improved tie point correspondences in the commercial AT package.
1. INTRODUCTION
The HFT Stuttgart has purchased in 2009 the UAV PAMS (Photogrammetric Aerial Mapping System) now offered by Germap, Germany (Germap 2012). This system is based on the SmartPlane fixed-wing UAV and a CANON IXUS camera system. The plane is equipped with GPS and has an infrared sensor system to estimate attitude values. Whereas at the beginning the research focus has been on developing and investigating camera calibration issues (Brinker, 2008) and the usage of a predecessor of the UAV, the major attention has been put on connecting to standard photogrammetric processing software (here Trimble INPHO software (Trimble, 2011) which is available at HFT and investigations on how to adapt the software parameters to the typical flight patterns and conditions of this UAV (Ziegler, 2011). The PAMS system has built-in software packages for “Quick mosaic” and “Air mosaic” generation, which are certainly useful already for many visual applications and are the input to the processing service offered by the company, but which do not allow to directly link to standard photogrammetric processing software. The output of the PAMS software version of HFT contains the parameters of a coarse aerial triangulation and the camera calibration parameters that can be imported into Trimble INPHO software (Trimble, 2011) project files. The linking of the image files and
image IDs and the handling of different unusual cases with partly corrupted output will have to be solved to generate a Trimble INPHO project file. Based on the generated project file the software packages MATCH-AT, MATCH-T DSM, OrthoMaster and OrthoVista for digital aerial triangulation, DTM/DSM generation and finally digital orthomosaik generation are used for various investigations. One focus has been on how to adapt the “usual” parameters for the digital aerial triangulation and other software to the UAV flight conditions, which are showing high overlaps, large kappa angles and a certain image blur in case of turbulences. It was of additional interest on how those parameters can be useful for other flights as well. Flights over the same area at different times have been compared to each other. One major objective was here to see, on how far differences occur relative to each other, without having access to ground control data, which would have a potential for applications with low requirements on absolute accuracy. Based on manual GPS measurements of a higher number of GCPs some overall quality estimate of the flights can be generated.
Based on those experiences a new attempt was made by (Huber, 2012) to improve the tie point selection and the tie point matching using Open Source libraries and to specifically adapt to the specific features of UAV flights. These developments are described in the final part of this paper.
2. BACKGROUND
The UAV platforms can be classified into Airships UAV Fixed Wings UAV, Powered Paraglider UAV and Rotary Wings UAV (Everaerts, 2006). Earlier a major focus of the systems with low weight (also called Micro-UAVs) has been on pure image acquisition. A photogrammetric evaluation was not envisaged. This has been changed in recent years. The strong miniaturization of GPS, IMU sensors and cameras in connection with rather high quality performance has opened the path for higher quality photogrammetric processing tasks. UAV vendors do not only offer RGB digital cameras, but also offer or plan to offer NIR sensors, thermal sensors or day-light and twilight sensors for special surveillance and monitoring tasks. A video-downlink for quick visual analysis is partly available. Some UAV systems do offer long operating time and high pay load but are usually only manageable with specially trained and certified personnel and are limited in the application area due to legal reasons.
The fixed-wing Micro-UAVs do not really compete with traditional photogrammetric flights, but offer interesting options for small areas, where the costs of traditional flights are simply too high. There is no need for a real runway, flight altitudes are usually only some 200m-300m above ground and thus below cloud coverage. With special control sensors and intelligent software also non-expert users might be able to perform a photogrammetric flight. These systems do offer autonomous flights following a defined flight planning. By linking the sensor images and meta-data to the usual digital photogrammetric processing chain, new applications with photogrammetric products like Digital Terrain Models (DTMs) and Digital Surface Models (DSMs) as input for orthophoto generation are possible. Some companies do also not only act as vendors of UAV systems but do also offer services for different application areas. The company Germap GmbH (Germap, 2012) does not only offer a Micro-UAV (Personal Aerial Mapping System, PAMS), but also services for generation of orthophotos and DTMs/DSMs and other products. The company Mavinci (Mavinci, 2011) offers several types of fixed-wing UAVs with a pay load of partly more than 1kg. Due to higher weight there is a need for more operators and there are certain limitations in usage due to flight regulations. Mavinci offers links to photogrammetric software for orthomosaic and DSM generation. Gatewing (Gatewing, 2011) offers services very similar to Germap. The fixed-wing system (Gatewing X100) can be combined with services for producing DSMs and orthomosaiks.
The security aspects do play an important role and the usage by untrained personal without special licenses is a pre-requisite for usage with students. The selected system by HFT was the Personal Aerial Mapping System (PAMS) by the Germap GmbH, Germany which is described in more detailed by (Germap, 2012 and Gülch, 2011).
3. PERSONAL AERIAL MAPPING SYSTEM
3.1 Description of the PAMS system
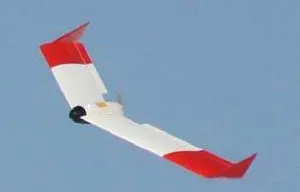
The PAMS System (Germap, 2012) consists of a fixed-wing UAV (SmartOne, cf. Figure 1) and a controlling unit on ground. The wingspread is 1.2m. The electric motor and the battery pack used allow missions of about 45 minutes duration with an average speed of 15km/h. An autopilot system integrated into the UAV allows autonomous flights of a predefined flight path. The weight with camera is about 1.1 Kg. The camera used is a calibrated IXUS 70 (7Mpix, 3072x2304 pel²) for RGB imagery
stored on flash card 2GB. The pixel size is about 1.9µm. The camera focus is fixed to infinity during the flight.
More details on the handling of the plane, the required steps for preparation of typical flight missions, and the experiences from a user´s point of view are given in (Gülch, 2011).
Figure 1: PAMS UAV (Germap, 2012).
3.2 PAMS UAV Evaluation Software
After the image and meta-data files from the SD card of the UAV camera has been imported into the ground station, the PAMS evaluation software can be applied. The PAMS UAV evaluation software has actually two parts, the 1st level is integral part of the UAV system, the 2nd level is offered as service and not included in the UAV system (cf. Table 1).
Table 1: PAMS evaluation software
1st Level Groundprocessingsoftware –Part of PAMS
QuickMosaic – On-site Quality control on site possible right
after flight AirMosaic – Basic user
software after the flight
A so called „dirty mosaic“ allows a geo-referencing of the images flown. 2nd level Groundprocessingsoftware – Special software not part of
PAMS for orthophoto generation via server.
The 1st Level Ground processing software is divided in two modules. The “QuickMosaic” software allows a quality control right after the flight on site and a so called quick mosaic of the images is produced. The “AirMosaic” software allows the production of a so called airmosaic (”dirty” orthomosaic), based on an automated AT, DTM/DSM generation and orthomosaic generation down to resolution level 3. The software allows to check the quality of each image and to exclude highly blurred images from further processing. The HFT PAMS SW version allows the export of the raw images (jpeg format) and the GPS/attitude data derived from the AirMosaic software combined with the camera calibration parameters used.
3.3 Test areas
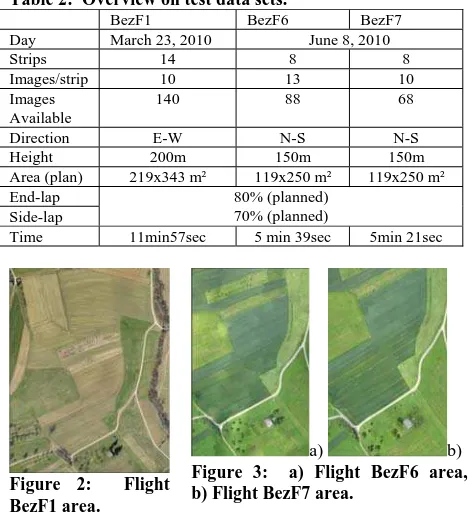
For a first evaluation of various items, the derived data sets of the three flights given in Table 2 were used.
The first flight (BezF1, Figure 2) was performed in late March with low vegetation cover at an altitude of 200m above ground and a rather big area. BezF6 covers a smaller area than flight BezF1 and was flown on June 8th 2010. The block consists of 8 strips in N-S- direction with 13 images each. The flight height was 150m above ground. The flight BezF7 was performed at the same day, right after Flight BezF6. This flight was hampered by less favorable wind conditions and turbulences. For BezF6 and BezF7 the illumination conditions were very much changing due to quick moving clouds. Not all planned images could be used later on. In Figure 3 the areas of BezF6 and BezgF7 are shown, with leafs on and vegetation of various height in fields and grassland.
Table 2: Overview on test data sets.
BezF1 BezF6 BezF7
Day March 23, 2010 June 8, 2010
Strips 14 8 8
Images/strip 10 13 10
Images Available
140 88 68
Direction E-W N-S N-S
Height 200m 150m 150m
Area (plan) 219x343 m² 119x250 m² 119x250 m²
End-lap 80% (planned)
70% (planned) Side-lap
Time 11min57sec 5 min 39sec 5min 21sec
Figure 2: Flight BezF1 area.
a) b)
Figure 3: a) Flight BezF6 area, b) Flight BezF7 area.
3.4 Link to Trimble INPHO Software
The HFT Stuttgart system has a PAMS Software version available, that allows the export of a text file of the output of the AirMosaic software which allows the establishment of a link to a standard photogrammetric processing chain built on Trimble INPHO software. Several obstacles had to be solved, however. The image file names on the SD card and the image Ids in the output of the AirMosaic software were not using the same naming convention. In addition the following cases were encountered on all examined test flights: a) the number of image Ids in the AirMosaic result file is less than the number of images on the SD card and b) from the planned project orientation parameters and corresponding image file are missing. The linking of the image files and IDs and the handling of the different cases could be solved (Gülch, 2011). With the final transfer of the camera calibration file given by PAMS to the Trimble INPHO software format a standard INPHO project file can be generated, which is the basis for the further processing steps: digital aerial triangulation, DTM/DSM generation and finally digital orthomosaik generation.
3.5 Estimating image blur (BlurMetric)
In (Ziegler, 2011) the integration of the Image BlurMetric Matlab software (Bao, 2009) in a quality check process (BlurMeasurement) is described. The whole content of an image is examined and a measure between 0 and 1 for the amount of image blur is derived. For each image, according to user defined criteria, a traffic light output guides the user to the critical cases. The experiments have shown, that a range of 0-0.2 is judged as sharp, a range of 0-0.2-0.37 can be judged as moderate sharp (yellow) and 0.37-1 as un-sharp. This approach is a good alternative to the standard PAMS quality checking possibilities. Visual control and comparison to the PAMS software on all test flights showed a more reliable behavior of the BlurMetric approach. It was found useful not to lose too many images right from the beginning, which increases the risk for gaps in the data (cf. also Gülch, 2011).
4. EVALUATION OF AT, DTM AND ORTHOPHOTO
Having linked the PAMS data to the Trimble INPHO software the first investigations were focusing on suitable parameter settings for aerial triangulation, DTM/DSM generation as well as orthomosaik generation and a comparison of different processing results among the different flights. For this first stage no ground truth data (GCPs) were available to simulate low-accuracy application scenarios (Ziegler, 2011).The second part of the evaluation includes ground truth information in the processing and for the comparisons.
4.1 Direct geo-referencing, without ground control
For the photogrammetric processing steps the default parameter settings for aerial imagery had to be adapted partly to the UAV flight conditions. At the beginning of the evaluations (Ziegler, 2011) for none of the three test areas GCP ground data was available. The results are purely based on the GPS information from the plane and the aerial triangulation. No manual tie point measurements or editing has been performed on the results in sections 4.1 and 4.2.
4.1.1 Aerial triangulation
The usual parameters for classical digital aerial triangulation had to be adapted first. There is a problem with strong kappa angle variations from image to image and also phi and omega are partly far off from a 0 degree angle. In addition there is the problem of image noise and blur and rather big height differences from one exposure to the next one. The unusual flight pattern following the mode of an ice hall sweeper with long time differences between neighbouring strips eventually causes strong illumination differences. The images are rather small and the imported attitude data is of quite low quality, as no IMU is involved.
The parameter sets in Table 3 showed quite suitable for all test data sets. A final run at level 0 (full resolution) did not bring a real improvement. The flight lines and the tie point distribution after the aerial triangulation show high regularity in case of BezF1, but weak behaviour for BezF7 due to difficult illumination and wind conditions (Figure 4
)
.Table 3: MATCH-AT – Strategy and matching parameters
Point density dense
TPC pattern: 3x3 or 4x4
Start at overview level: 6
Stop at overview level: 1 or 0
Size of tie-point area: 45 Pixel
Parallax bound: 15 Pixel
LSM/FBM correlation coeff. 90%-93%
a) BezF1 b) BezF7
Figure 4: AT tie point distribution and image footprints.
4.1.2 DTM/DSM Generation
Despite the, on first sight, promising results of the aerial triangulations all test data sets showed an erroneous “Dome” in the Digital Surface Model generation in the centre of the block. The effect counted up to 10 meters in height as shown for BezF1 and BezF6 (Figure 5). Even with the introduction of the GPS flight recordings into the AT the lack of GCPs in the block could not be compensated. It is more than obvious, that this effect cannot be neglected for almost all possible applications.
a) b)
Figure 5: a) DSM of BezF1- b) DSM of BezF6. The “dome” in the center is erroneous. Contour interval 2.5m.
4.1.3 Orthophoto and orthomosaik
An orthoimage generation combined with mosaiking produced internally still consistent results. Despite the partly wrong DSM in the center of the block, the overlapping orthophotos showed only marginal deviation along road boundaries of some few cm. Which means: for very low accuracy requirements and just visualization applications limited to a local area these results might be still usable, but not at all for real photogrammetric measuring tasks or incorporation of results in world systems.
4.2 Ground control available
All together 20 GCPs where measured with a LEICA GPS System 1200 ASCOS in static mode with real time correction values after the flight using natural points identifiable in the images. The measurement accuracy was about 5 cm for 19 of the measured GCPs and 50cm for a height control point. The definition accuracy, however, was only about 10-20 cm due to the usage of non-signalized points. In a minimum configuration only 4 GCPs were introduced into the AT, leaving 16 check points. A moderate configuration used 10 GCPs and 10 check points. The results are shown in Table 4 and Table 5. The overall results indicate that an internal accuracy of some 10cm (corresponding to about 1.5-2 pixels) can be reached in planimetry using a moderate number of GCPs in the aerial triangulation. The σ0 value is about 2 pixels only, but with 4µm still rather good. The RMS values at check points are, however, at an unacceptable range of 1 to 3m due to the usage of natural and not signalized points. This does require more investigations.
Table 4: Sigma naught and SDEV of terrain points
E [m] N [m] H [m]
GCP min
0 = 4.0 µm
0.12 0.11 0.41
GCP moderate
0 = 4.1 µm
0.11 0.10 0.38
Table 5: RMS at check points
RMS E [m] RMS N [m] RMS H [m]
GCP min 0.86 1.07 2.90
GCP moderate 0.79 1.24 1.99
4.3 Comparison
A first comparison was made between the 3 data sets without ground control. At 7 distributed points visible in all 3 data sets the deviations among the test data sets were checked. One can observe differences of up to 8 meters amongst the 3 flights. The results of the two flights at the same day (BezF6 and BezF7) do not really coincide. BezF1 and BezF6 show a translation (mainly N direction), whereas BezF7 does also show scale differences, which indicate the impact of unfavorable flight conditions.
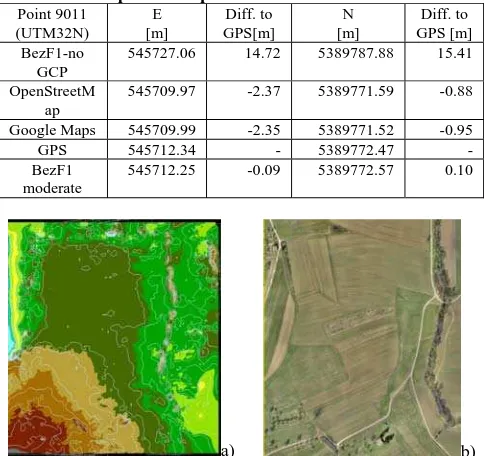
For several points a final comparison to ground truth GPS measurements was performed as well as to freely available data as OpenStreetMap and Google Maps. One example is given in Table 6. The flight with direct geo-referencing showed very large deviation from the ground truth GPS, whereas the AT with moderate number of GCPs showed a very good result. The results of the final run with the moderate number of GCPs produced a good result for the DSM and the orthomosaik as shown in Figure 6 for BezF1.
Table 6: Comparison of point 9011 coordinates.
Point 9011 (UTM32N)
E [m]
Diff. to GPS[m]
N [m]
Diff. to GPS [m] BezF1-no
GCP
545727.06 14.72 5389787.88 15.41
OpenStreetM ap
545709.97 -2.37 5389771.59 -0.88
Google Maps 545709.99 -2.35 5389771.52 -0.95
GPS 545712.34 - 5389772.47 -
BezF1 moderate
545712.25 -0.09 5389772.57 0.10
a) b)
Figure 6: BezF1 with moderate # of GCPs. a) DSM BezF1, b) Orthomosaik BezF1.
5. DEVELOPMENT OF UAVISION
Based on the experiences gained so far, and the problems encountered in the aerial triangulation of the UAV imagery with the very specific features the software UAVision (Huber, 2012) was specifically developed to produce improved input data for bundle adjustment of UAV images by PAMS. The selection of tie points and a multi-ray matching procedure was based on the Open-Source Library OpenCV (Open Source Computer Vision, Willow Garage 2011). The output was intended to be used in a bundle adjustment using the Open Source package sba (Lourakis and Argyros 2009)
5.1 Tie-point selection
For tie point selection the selection of suitable methods was basically aiming at rotation invariant procedures as strong rotation differences in strip and across strip directions are observed. A scale invariance feature is welcome, but was not
absolutely required, as scale differences between neighbouring photographs are usually rather small. Three methods have been examined in more detail: SIFT (Scale-invariant Feature Transform, Lowe, 2010), SURF (Speed up Robust Feature, Bay et al., 2006) and ORB (Oriented FAST and Rotated BRIEF, Rublee et al., 2011).
The comparison was based on selected images in all flights which, as taken at different times, show differences in surface colours. The requested thresholds by the algorithms were empirically derived and then applied constant for all examined images. The found tie points are marked with blue circles, where the size is representative for the scale (cf. Figure 7). The algorithm SURF was regarded as most suitable for this purpose. The number of extracted point features was high (Figure 8) and well distributed over the whole image.
a) b)
Figure 7: Results of a) SIFT and b) SURF for tie point selection. Blue circles represent the found points, red circles mark areas without detected points
Figure 8: Number of tie points for each method for the 13 evaluated images.
5.2 UAVMatcher
Based on the SURF features a matching algorithm was developed called UAVMatcher which is able to match features in two overlapping images. After comparison between several options the FLANN matching algorithm (Muja and Lowe, 2011) was selected. The matching did, however, produce results with still many not unique matching results and an overall very high rate of erroneous matches. By developing three filter algorithms, the results could be improved considerably. To decide on uniqueness of one selected point in one image to several points in the other image the similarity of the best and next best match was compared using a quality measure based on distance between feature description vectors. If the best and next best match show only minor differences in the quality a decision on the correct match is not possible and thus both are not considered any further. The remaining correspondences are in a 2nd stage checked also in the other matching direction, i.e. if the point in the former 2nd image, is now found in the 1st image. Only those correspondences which are consistent in both matching directions are kept for further consideration. The 3rd filter stage was a RANSAC-Algorithm to further reduce the amount of erroneous matches. After all three filter stages mainly good matches remain for further processing (cf. Figure 9). This stereo matching is the basis of a procedure then applied in a strategy to match images in the whole block.
Figure 9: Matching result of UAVMatcher.
5.3 RouteComputer
To find the relative position of single UAV images to each other the component RouteComputer was developed. This component is based on image data and GPS data provided by the PAMS software for each UAV image. For visual control for the operator an image and a video is produced to show the structure of the block, as well as the whole block structure is stored for the final matching in the whole block. The RouteComputer is able to distinguish between a drift caused by wind or a real change of image strip. This is very important, as the flight direction change requires the images to be rotated by 180° for a consistent image block.
5.4 MultiUAVMatcher
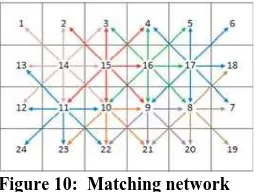
As soon as the structure of the block is computed, the MultiUAVMatcher is activated. This is based on a newly developed matching logics to avoid search for correspondences with non-overlapping images. The component is to ensure matching only with neighbouring images, which is a rather complex task, given the partly extremely high forward- and side-overlaps as well the big deviations due to wind conditions. The matching logics is following the principle of a structural element in morphological operations moving over a matrix which describes the block structure (Figure 10). It can check which pairs of images have been already matched to avoid incorrect weighting of single images.
Figure 10: Matching network
The MultiUAVMatcher is also made robust against single missing images (which were observed in the test flights). A result with 140 images is shown in Figure 11.
Figure 11: Result of UAVision after applying MultiUAVMatcher and preparing for bundle adjustment.
In this case 91834 reliable image matches were found. About 1/3 of the features were matched in more than 2 images. The run time in this prototype system is still very high for 140 images, but is so far not optimized.
5.5 Bundle block adjustment with sba
The final output of UAV Vision was prepared for the bundle block adjustment sba (generic sparse bundle adjustment, Lourakis and Argyros 2009) which is available as Open Source software package, which, however, does require several additional external libraries to be installed. This package had been chosen due to the quite promising results derived in classical photogrammetric applications. It was then very time consuming to derive the correct input conditions for sba, due to the limited code descriptions. A lot of development and testing was required to provide the input data with proven correctness. Having provided all necessary input data for sba including the required approximate values for the unknowns, the results by sba were, however, rather disappointing. For the data we use, this software did not produce correct results and is as such not suitable for our purposes. The demo datasets were running correctly, which shows, that the software was installed correctly, but it could be shown, that the software is not running on all computers, even with the same operating system, which certainly limits the applicability in general.
6. CONCLUSIONS
Even without editing of the aerial triangulation the results are feasible due to the selection of suitable parameter sets for this kind of aerial imagery. It is clearly proven, that no project should be flown without proper GCPs introduced into the aerial triangulation. Results indicate that an internal quality of some dm can be reached with a moderate number of GCPs well distributed. This still needs further investigation. The external flight conditions do influence the aerial triangulation which can be solved by additional manual tie point measurements. As an alternative a newly developed approach UAVision for selecting and matching of tie points using Open Source Libraries showed very promising results to further automate the AT process. UAVision provides a good, highly automated alternative for tie point selection, tie point matching in the block of UAV imagery and provision of all necessary input data for a final bundle block adjustment. The run time is still rather high and needs certainly to be improved, but this was not the objective in this research. The used Open Source Libraries are not directly usable and do require substantial improvements and adaptations for the purposes investigated here. The advantage of the OpenCV library was the well prepared documentation, which supported the enhancements and adaptations. The intended usage of the sba library was not possible. The investigations clearly showed the limitations of this library which is not feasible for our purposes. The intention is now to a) either look for another open source library, or to b) use the results of UAVision tie point matching as input for the Match-AT final bundle adjustment.
Further investigations will be needed to check the effects of camera calibration in flight. Other researchers report very similar effects with other systems. Another unsolved problem is the usage for stereo compilation, as the problem is the high end- and side-overlap which does require a smart selection of stereo pairs for meaningful processing.
7. REFERENCES
Bao, D., 2009. Image Blur Metric, http://www.mathworks.com/matlabcentral/fileexchange/24676-image-blur-metric. TheMathWorks, Inc. (accessed November 24, 2010).
Bay, H., Tuytelaars, T., Van Gool, L. 2006. SURF: Speeded Up Robust Features. In Proceedings: European Conference of Computer Vision (ECCV) 2006, pp. 404 -417.
Brinker, S., 2008. Prozessentwicklung und Evaluierung für photogrammetrische Aufnahmen mit einem UAV. Diploma Thesis HFT Stuttgart.
Everaerts, J., 2006. New Platforms – Unconventional Platforms for Remote Sensing. EuroSDR Project Presentations.
Gatewing, 2011. www.gatewing.com (accessed July 24th 2011). Germap, 2012. www.germap.com (accessed April 10th 2012). Gülch, 2011, Photogrammetric evaluation of multi-temporal fixed wing UAV imagery. Proceedings UAVg Conference,
ETH Zurich. http://www.geometh.ethz.ch/uav_g/proceedings/guelch
(accessed April 10, 2012).
Huber, M., 2012. Softwareentwicklung für die Verarbeitung und Analyse von photogrammetrischen UAV-Aufnahmen auf Basis von Open-Source-Bibliotheken. Bachelor Thesis HFT Stuttgart.
Lourakis, M.I.A., Argyros, A.A., 2009. SBA: A Software Package for Generic Sparse Bundle Adjustment. ACM Transactions on Mathematical Software (TOMS) Volume 36 (1), pp. 1-30.
Lowe, D.G. 2010. Distinctive Image Features from Scale-Invariant Keypoints. International Journal of Image Processing (IJIP) Vol. (2) 2010, 91-110.
Mavinci, 2011. /www.mavinci.de (accessed July 24th 2011). Muja, M., Lowe, D. 2011. FLANN - Fast Library for Approximate NearestNeighbors – User Manual 2011, pp. 1 – 22.
Trimble, 2011. Trimble Inpho Software. www.inpho.de (accessed July 24th 2011).
Rublee, E., Rabaud, V., Konolige K., Bradski, G. 2011. ORB: an efficient alternative to SIFT or SURF, In Proceedings International Conference on Computer Vision (ICCV), pp.2564-2571.
Willow Garage, 2011. Willow Garage – OpenCV. http://www.willowgarage.com/pages/software/opencv,
(accessed November 4th 2011.
Ziegler, M., 2011. Photogrammetrische Evaluation multitemporaler UAV-Aufnahmen mit Teilautomatisierung des Auswertungsprozesses. Bachelor Thesis HFT Stuttgart.
8. ACKNOWLEDGEMENTS
The thesis works by Dipl-Ing. (FH) Sören Brinker, B.Eng. Marius Ziegler and B.Eng. Marc Huber have been the basis for this paper and their contribution is gratefully acknowledged.