Long-Term Electricity Supply-Demand Planning Simulation Using TEEP Model
Abstract—This paper reports the application of new developed “Tool for Electricity Energy Planning” (TEEP), an accounting framework based bottom-up model to simulate long-term electricity supply-demand planning. The simulation is carried out using electricity sector data of Banyuwangi regency in East Java province, Indonesia. The projection of electricity demand and supply which consider fossil fuel as well as renewable energy potential is taken into account in the simulation to find the resources allocation implications and generation costs. The total electricity demand would increase up to 2,027.5 GWh from the initial value of 783.4 GWh. In the case of generation mix, the total generation costs of coal fired power plant could be reduced by 450 Million US$ and potential coal saving would be 4.375 thousand ton, among other findings.
Keywords - electricity; energy planning; long-term; supply-demand; simulation
I. INTRODUCTION
Long-term supply and demand projection should be appropriately conducted based on several parameters in order to realize efficient but reliable power sector infrastructures, including supply and demand side. Electricity supply-demand model, which can be derived from bottom-up energy model, is therefore prominent to be further developed so that various related variables are accomodated in the model.
Bottom-up energy system model can be constructed and assessed using several methodologies, such as optimization model [1], iterative equilibrium model [2], hybrid models [3], and accounting framework based model. Example of the widely used tool that is developed based on the last method is the “Long-range Energy Alternatives Planning System” or LEAP. Publications and reports that correspond to LEAP can be found in [4-7].
The objective of this paper is to report the application of the new developed bottom-up energy model software to simulate the projection of electricity demand and supply, along with the assessment of their implications towards the generation costs and resources allocation. The software is developed based on the accounting framework, that is used in LEAP. In addition, this new software is developed to enhance the function and assessment of accounting framework based bottom-up model.
This paper is organized as follows; methodology of the developed software and simulation framework is presented in the next section along with the data employed into the
model. Simulation results and discussion in terms of results comparison is followed. Finally, conclusion and further work plan is presented.
II. METHODOLOGY
A. TEEP: The Method and Algorithm
The “Tool for Electricity Energy Planning”, hereafter called TEEP, a new software developed in this research, is intended to simulate scenarios implications on long-term electricity supply-demand within a certain economy boundary. The TEEP software is therefore designed and developed based on bottom-up model approach. The method used in the software enable user to study options that have specific implications on supply or demand technology. The software is worked on the accounting framework. Thus, Applying the bottom-up accounting based framework, TEEP is intended to provide user the model of energy planning with demand as well as supply-mix and resources analyses that allows user to observe their scenarios implications.
The first version of the TEEP software is marked with “Beta 1 version, 2015”. In this initial version, TEEP is equipped with several modules and key parameters, such as aggregated and individual demand sector, either fossil fuel or renewable based generation plants module, energy losses during transmission and distribution, and resources module.
For the purpose of simulation process, the electricity demand is assumed same with the amount of electricity consumed during a certain period. In fact, the real amount of electricity consumption is affected by the frequency and time of disturbance experienced by the system so that there would be no power delivered into the customer. Hence, the current version of the software does not consider the potential of higher demand level compared to the real consumption, which is practically known as SAIDI and SAIFI index.
For instance, the Photovoltaic Power Plant (PPP) will be considered first to fill the supply slot in that particular year compared to Coal Fired Power Plant (CFPP) because the fuel cost of PPP is practically zero. In general, the renewable energy based power plant will have the first priority compared to the fossil fuel based. The amount of fuel used per MWh is calculated based on the power plant heat rate (Btu/MWh) and the fuel heat contents (Btu per physical unit).
The total costs of generation is later on obtained from the power plant capital cost, fuel cost, and operational & maintenace cost. Example of the flowchart that contain formula for calculating total generation costs is shown in Fig.1. The discount rate applied in the year within the simulation year period is taken into account. Meanwhile, the cost of transmission and distribution extension is not taken into account.
Figure 1. Flowchart for calculating total generation costs over the simulation year period.
B. Electricity Demand Data for Simulation
Electricity demand sector is classified into five major sectors. The year 2014 is taken as the baseline year in terms of the number of electricity consumers per sector and the amount of yearly electricity consumed. The overall five sectors is considered in this study. The number of customer
and electricity consumption of Banyuwangi regency in 2014 is given in Table 1 [8].
TABLE I. NUMBER OF CUSTOMER AND ELECTRICITY CONSUMPTION OF BANYUWANGI REGENCY IN 2014
Sector Number of
Customer
Electricity Consumption (MWh) Household 394,324 441,141.58
Social 10,958 21,838.91 Business 18,509 73,287.78
Industry 511 161,635.24 Government/
Public 1,731 24,998.47
TABLE II. AVERAGE GROWTH OF NUMBER OF CUSTOMER AND ELECTRICITY CONSUMPTION DURING 2008-2014 IN BANYUWANGI
Sector
Average Growth of Customer
(%)
Average Growth of Electricity Consumption
(%)
Household 6.29 9.30
Social 7.76 10.14
Business 1.72 7.98
Industry 10.22 13.72
Government/
Public 11.80 3.57
Meanwhile, Table 2 shows the average growth of customer and electricity consumption during 2008-2014. These values are then used in the simulation throughout the simulation time frame as the values of number of customer growth as well as electricity demand growth per customer sector, respectively
C. Supply Side Data and Scenarios
The long-term supply-demand for the observed area is performed for a ten-year time frame, i.e. from 2015 to 2024 whereas 2014 is taken as the baseline year. The simulation considers two scenarios in terms of supply side. The first scenario refers to the utilization of existing Coal Fired Power Plant (CFPP) whereas the second scenario consists of Geothermal Power Plant (GPP) and Photovoltaic Power Plant (PPP) in addition to Coal Fired Power Plant.
In order to calculate the amount of energy generated in the power plant, the power plant heat rate for CFPP is taken 10,498 Btu/kWh, meanwhile the fuel heat content is given 19,336,000 Btu/ton. Generation capacity as well as associated costs for each power plant is provided in Table 3.
TABLE III. POWER PLANT ASSOCIATED COSTS AT THE BASELINE YEAR
Power Plant
Capital Cost (US$/MW)
Fuel Cost [9] (US$/MWh)
O&M Cost [9] (US$/MWh)
CFPP 1,126,000 [9] 42.73 6
PPP 2,000,000 [10] 0 30
GPP 1,800,000 [11] 65.66 10
transmission and distribution losses is set at 8.37% for the baseline year and decrease until 6% on the simulation year. Real discount rate is set at 5%.
III. RESULTS AND DISCUSSION
The baseline demand in 2014 and projection during 2015-2024 can be seen in Fig. 2. In 2014, the overall sector demand is 722,902 MWh. As projected, the 2024 demand would be 1,908,908 MWh or 1,908.9 GWh. In other word, the 2024 demand would potentially be increased as high as 2.6 times higher based on 2008-2014 average growth. In 2024, household sector would consume around 1,073.5 GWh, followed by industy, business, social and government or public, with 584.7 GWh, 157.9 GWh, 57.4 GWh, and 35.5 GWh, respectively.
Figure 2. Electricity demand projection for Bayuwangi regency during 2015-2024 based on TEEP analysis.
A. First Scenario Model: CFPP
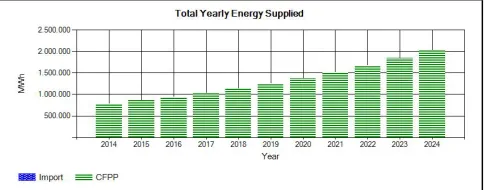
In this scenario, the projected demand will be meet by the power supplied from existing Coal Fired Power Plant (CFPP). According to TEEP analysis, to satisfy the demand until the end of the projection year without additional electricity supplied from other plants, a total of 232 MW CFPP has to be installed and started running in the baseline year. The spinning reserve is not taken into account, and the power plant availability is set at 100% to allow some value of spinning reserve. The total yearly energy supplied for 232 MW CFPP is presented in Fig.3.
Figure 3. Total historical and projected yearly energy supply during 2014-2024 for Scenario 1
According to the analysis, the 2014 total energy supplied is 783,4 GWh and it would increase up to 2,027.5 GWh in 2024. In summary, the total yearly energy supply and T&D losses is presented in Table 4.
TABLE IV. TOTAL YEARLY ENERGY SUPPLY AND T&DLOSSES FOR SCENARIO 1
Year Annual Electricity
Supply (MWh) T&D Losses (MWh)
2014 783,408.9 60,506.88
2015 859,893.3 64,833.50 2016 944,249.8 69,451.06 2017 1,037,327 74,374.94
2018 1,140,070 79,620.50 2019 1,253,529 85,202.88 2020 1,378,875 91,136.75
2021 1,517,412 97,436.12 2022 1,670,593 104,113.88
2023 1,840,038 111,181.25 2024 2,027,555 118,647.25
As consequence, there would be at least 7,850 thousand Ton of coal required to generate the energy based on 232 MW capacity. The coal reserve condition for that corresponding amount is depicted in Fig. 4.
Figure 4. The 7,850 Thousand Ton coal reserve movement for 232 MW CFPP
Since the existing capacity of plant is able to meet the projected demand, thus the resource consumption is equal to the resource requirement. In other word, preserving this condition, the additional or imported resources would be unnecessary.
B. Second Scenario Model: CFPP-PPP-GPP
two power plants are set at 100%. The total yearly energy supply by having these three power plant is given in Fig. 5.
Figure 5. The total yearly energy supply for Scenario 2
In detail, the total annual energy supply obtained from all power plants along with the T&D losses is presented in Table 5. According to the analysis, the fraction of renewable energy into overall supply is 47.5% and 4.32% for geothermal and solar, respectively.
TABLE V. TOTAL YEARLY ENERGY SUPPLY AND T&DLOSSES FOR SCENARIO 2
Year Annual Electricity Supply (MWh)
T&D Losses (MWh) CFPP PPP GPP
2014 783,408.90 - - 60,506.88
2015 859,893.30 - - 64,833.50
2016 944,249.80 - - 69,451.06
2017 1,037,327 - - 74,374.94
2018 1,052,470 87,600 - 79,620.50
2019 202,328.90 87,600 963,600 85,202.88
2020 327,674.90 87,600 963,600 91,136.75 2021 466,211.80 87,600 963,600 97,436.12
2022 619,392.90 87,600 963,600 104,113.88 2023 788,838.30 87,600 963,600 111,181.25 2024 976,355.00 87,600 963,600 118,647.25
C. Generation Costs and Resources Allocation Comparison The remaining reserve in 2024 would be around 3,475,000 Ton of coal, as we can see in Fig.6. Implication of the scenario 2 to coal resource reserve and consumption are depicted in Fig. 6 and 7, respectively. Hence, the potential coal saving for scenario 2 would be around 4,375,000 Ton of coal, as this would be the required coal reserve in Scenario 2.
Figure 6. Coal reserve during 2014-2025 for Scenario 2.
Figure 7. Coal consumption for Scenario 2.
The total generation costs which comprise capital cost, fuel cost, and O&M cost of CFPP for the scenario 1 and the generation costs of CFPP for the scenario 2 is presented in Table 6. Based on the result obtained in Table 6, the generation cost saving of CFPP would be 449.88 Million US$. In addition, the total generation costs for each plants in scenario 2 is presented in Table 7.
TABLE VI. TOTAL GENERATION COST OF CFPPBASED ON SCENARIO 1 AND SCENARIO 2
Year
CFPP Generation Cost in Scenario 1 (Million US$)
CFPP Generation Cost in Scenario 2 (Million US$)
2014 299.41 299.41 2015 44.00 44.00
2016 50.73 50.73 2017 58.52 58.52 2018 67.53 62.34
2019 77.96 12.58 2020 90.04 21.39 2021 104.05 31.97
2022 120.28 44.59 2023 139.10 59.63
2024 160.94 77.5
Total 1,212.55 762.67
TABLE VII. TOTAL GENERATION COST OF EACH PLANTS IN SCENARIO 2
Year
CFPP Total Generation
Cost (Million US$)
PPP Total Generation
Cost (Million US$)
GPP Total Generation Cost (Million US$)
2014 299.41 - -
2015 44.00 - -
2016 50.73 - -
2017 58.52 - -
2018 62.34 27.5 -
2019 12.58 3.35 345.75
2020 21.39 3.52 97.7
2021 31.97 3.70 107.72
2022 44.59 3.88 108.43
2023 59.63 4.08 113.1
2024 77.5 4.28 118.76
D. Discussion
In this research, the penetration of renewable energy is set to be maximum based on their installed capacity. This methodology permits the analysis of renewable energy potential, the comparison in terms of generation costs incurred, and the resources allocation before and after the appearance of renewable energy.
The simulation is carried out based on the minimum theoretical parameters to allow power and energy balance flow from the supply side into the demand side. As briefly explained in the earlier section, the spinning reserve as well as the available power of the power plants can be adjusted below the installed capacity in order to provide more realistic results.
IV. CONCLUSION
Simulation of long-term electricity supply-demand is conducted in this paper using the bottom-up energy model. The developed tool is able to show the relationship between supply side and demand side parameters. Moreover, the tool can be easily used to observe the result implication by changing inputted parameters. Nevertheless, further improvement of the software is still necessary to enhance more details analysis, testing for the bug, and allow easiness of use.
ACKNOWLEDGEMENT
This paper and the software developed is part of the work conducted in the research funded by DIKTI, The Ministry of Research, Technology and Higher Education, Republic of Indonesia, for the fiscal year 2015. Therefore, authors are really grateful for the funding.
REFERENCES
[1] J. Krzemien, “Nuclear energy option for energy security and sustainable development in India,” Annals of Nuclear Energy, vol. 38 (2-3), February-March 2011, pp. 331-336.
[2] D. Connolly, H. Lund, B.V. Mathiesen, M. Leahy, “A review of computer tools for analysing the integration of renewable energy into various energy systems,” Applied Energy, vol 87 (4), April 2010, pp. 1059-1082.
[3] F. K. Ko, C. B. Huang, P. Y. Tseng, C. H. Lin, B. Y. Zheng, H. M. Chiu “Long-term CO2 emissions reduction target and scenarios of
power sector in Taiwan,” Energy Policy, vol. 38 (1), January 2010, pp. 288-300.
[4] P. Kuldna, K. Peterson, R.K. Thalfeldt, “Knowledge brokering on emissions modelling in strategic environmental assessment of Estonian energy policy with special reference to the LEAP model,” Environmental Impact Assessment Review, vol. 54, September 2015, pp. 55-60.
[5] X. Yan and R.J. Crookes, “Reduction potentials of energy demand and GHG emissions in China’s road transport sector,” Energy Policy, vol. 37 (2), February 2009, pp. 658-668.
[6] G.P. Giatrakos, T.D. Tsoutsos, N. Zografakis, “Sustainable power planning for the island of Crete,” Energy Policy, vol. 37 (4), April 2009, pp. 1222-1238.
[7] J. Li, “Towards a low carbon future in China’s building sector-a review energy and climate models forecast,” Energy Policy, vol 36 (5), May 2008, pp. 1736-1747.
[8] PT. PLN (Persero), East Java Distribution Statistic 2014, PT. PLN (Persero) East Java Distribution, Surabaya, 2015.
[9] National Nuclear Energy Agency (BATAN), Comprehensive Assessment of DifferentEnergy Sources for Electricity Generation in Indonesia (CADES) Phase 1, Jakarta, Indonesia, 2006.
[10] PT. PLN (Persero), 2014 PLN Statistical Report, Jakarta, Indonesia, 2014.