Education Sector in Indonesia 2012
Published by:
© 2013 Ministry of Education and Culture
ISBN: 978-602-282-111-3
Lead Counterpart for the Preparation of the Overview of the Education Sector in Indonesia 2012:
Dr. Ir. Taufi k Hanafi , MUP
Senior Advisor to the Minister of Education and Culture for Social and Economics of Education
ACDP Technical Oversight Group:
Co-Chair : Prof. Dr. Ir. Khairil Anwar Notodiputro,
Head of Research and Development Agency, Ministry of Education and Culture
Co-Chair : Dra. Nina Sardjunani, MA,
Deputy Minister for Human Resources and Culture, BAPPENAS Co-Chair : Prof. Dr. H. Nur Syam, M.Si.,
Director General of Islamic Education, Ministry of Religious Aff airs Deputy Chair : Ir. Hendarman, M.Sc., Ph.D.,
Secretary of Research and Development Agency, Ministry of Education and Culture Program Manager : Dr. Bambang Indriyanto,
Head of Policy Research Center, Ministry of Education and Culture
International
Development Partners : European Union
Australian Agency for International Development (AusAID) Asian Development Bank (ADB)
ACDP Secretariat : Alan Prouty; John Virtue; David Harding; Abdul Malik; Basilius Bengoteku; Lestari Boediono; Daniella Situmorang
Education Sector in Indonesia 2012
is a facility to promote policy dialogue and facilitate institutional and organizational reform to underpin policy implementation and to help reduce disparities in education performance. The facility is an integral part of the Education Sector Support Program (ESSP). EU’s support to the ESSP also includes a sector budget support along with a Minimum Service Standards capacity development program. Australia’s support is through Australia’s Education Partnership with Indonesia. This report has been prepared with grant support provided by AusAID and the EU through ACDP.
Education Sector Analytical and Capacity Development Partnership (ACDP)
EUROPEAN UNION KEMENTERIAN PENDIDIKAN
DAN KEBUDAYAAN KEMENTERIANAGAMA
The institution responsible for implementation of the study was the British Council.
This Overview of the Education Sector in Indonesia for 2012 has been prepared to provide objective and comprehensive information on the progress achieved and the challenges to be addressed to achieve the national goals for the education of our people. The Government of Indonesia recognizes that education is a fundamental human right, and education is a central component of the Government’s human resources development policy. Education does not only fuel economic growth and improve national competitiveness, but is also plays a critical role in reducing poverty, strengthening democracy and producing creative citizens with high moral values.
The size, diversity and geographic characteristics of Indonesia present tremendous challenges for managing the education system. The system provides for over 54.8 million students (the 3rd largest in Asia and 4th in the world), employs some 3.0 million teachers who work in 236 thousand schools distributed in 33 provinces and over 500 districts with around 300 ethnic groups and 750 local languages.
During the past fi fteen years Indonesia has emerged from severe economic and political crises while instituting a democratic and decentralized system of governance. Indonesia is now the world’s third most populous democracy. One of the most signifi cant changes for the Indonesian education system has been the decentralization of education governance and adoption of new systems for the central and local governments to work together in a democratic system to develop schools and institutions of higher education throughout Indonesia.
Since 2009 the Government of Indonesia has supported increased access and quality improvement of education through allocating 20% of the national budget to support development and operation of the education sector. The Government has worked to increase the availability of qualifi ed teachers, especially in remote and rural areas in order to reduce regional disparities in educational attainment as well as levels of welfare and incomes. National programs such as the School Operational Assistance Program (BOS) for primary and secondary schools, the Operational Assistance for State Universities Program (BOPTN) and Scholarships for Poor Student (BSM) have provided special assistance to accelerate achievement of our goals.
Over the past two decades Indonesia has achieved signifi cant progress in meeting its targets for participation and access to education at all levels. The expansion of access has also narrowed the gaps across income groups and regions. Indonesia is on track to achieve MDG targets and the Education for All (EFA) goals for basic education, including gender parity, and literacy. The number of private and public senior secondary schools has doubled from 12,415 to 26,896. The number of senior secondary school teachers nearly doubled during this time, from 342,443 to 571,591, and gross enrollment rates increased from 42.8% in 2000/2001 to 76.4% in 2011/12. We are working hard to achieve universal access at the senior secondary level.
The current Indonesian higher education system is diverse, with more than 5.4 million students attending some 3,600 higher education institutions. These include academies and community colleges; polytechnics; advanced schools; institutes; and universities. More than half of senior secondary graduates continue their education at institutions of higher education, and we expect that the transition rate will continue to grow. We are working to ensure that our children can continue their studies to higher education to reach their full potential and contribute to the modernization and growth of the national economy.
Third, it is important to ensure that globalization creates a convergence of civilization rather than a clash of civilizations. Since education is the main source of knowledge creation, dissemination and absorption, it is no surprise that researchers have shown education to be the single greatest cause of economic inequality. Strategic investment in education is therefore critical to reduce such inequality, within and and between countries.
Indonesia is projected to become the seventh largest economy in the world in 2030, and the demand for Indonesian skilled workers will increase from 55 million in 2012 to 113 million in 2030 in order to maintain stable growth (McKinsey Global Institute Report, September 2012). Demographic analysis of population changes indicates that during the period 2010-2035 the country will experience demographic transition characterized by a low population dependency ratio. During this transition period, the productive population age group is much larger than the non-productive age group. This will create a golden opportunity, commonly referred to as a “demographic bonus”, which provides the potential to advance through timely investment in more equitable and high quality education, training and life-long learning. If realized, this has the potential to create a highly productive workforce to support rapid economic growth in the future. However, if not realized, the nation risks facing a fi nancial burden when the population aged 7-15 years is ready to enter the workforce during the period 2020-2025.
The above vision and the implications in terms of human resource development place a premium on the need to rapidly transform skills composition. A key strategy in taking this forward is the Government’s recently introduced Twelve-Year Compulsory Education Program. In addition, to support improvement in the quality and relevance of education in a broader sense, a new and improved curriculum will be introduced from 2013 to cover early grades at primary, junior secondary, and senior secondary education levels.
With the support of all stakeholders in our diverse society, we are confi dent that these challenges will be well addressed. It is envisaged that this report will become a sustainable reference to support policy discussions for development of the education sector in Indonesia. Let us all increase our dedication and eff orts to provide educational services to all members of the community.
Jakarta, June 2013
Minister of Education and Culture
Our sincere thanks and appreciation are extended to Prof. Dr. Ir. Khairil Anwar Notodiputro, Head of Research and Development Agency, Ministry of Education and Culture, Dra. Nina Sardjunani, MA, Deputy Minister for Human Resources and Culture, BAPPENAS and Prof. Dr. H. Nur Syam, M.Si., Director General of Islamic Education, Ministry of Religious Aff airs, who are esteemed Co-Chairs of the ACDP Technical Oversight Group for their valuable input and support in the preparation of this report.
To all members of the Study Team we extend our gratitude and thanks for their hard work and dedication which have contributed to the completion of this Overview of the Education Sector in Indonesia 2012 Report. Appreciation and thanks are extended to the British Council Study Team.
Our thanks are also extended to our development partners from the Australian Agency for International Development (AusAID), the European Union and the Asian Development Bank (ADB) for their support in the preparation of this Overview of the Education Sector in Indonesia 2012 Report, and to all others who contributed to the preparation of this document but cannot be mentioned individually.
May this report be used by all interested parties, including government and non-government organizations and the public.
Jakarta, June 2013
Senior Advisor to the Minister of Education and Culture for Social and Economics of Education
Foreword iii
Acknowledgement v
Table of Contents vi
Abbreviations xi
Executive Summary xv
Chapter 1 Introduction 1
1.1 Indonesia 1
1.2 Political Developments 2
1.3 Economic Developments 3
1.4 Demographic Developments 4
Chapter 2 Education in Indonesia – An Overview of the System 7
2.1 Recent Historical Context (1950s – 2000s) 7
2.2 Structure of the Education System 9
2.3 Regulatory Framework 11
2.4 Strategic Priorities 13
2.5 Decentralization 15
2.6 Financing of Education 23
Chapter 3 Pre-Tertiary Education 33
3.1 Early Childhood Development (ECD) 33
3.2 Basic Education 38
3.3 Senior Secondary Education 45
3.4 Vocational Education 50
3.5 Special Needs Education 58
3.6 Non-Formal Education 61
Chapter 4 Higher Education 71
4.1 Brief Overview of the System 71
4.2 Regulatory Framework 72
4.3 Higher Education Financing 73
4.4 Enrollment, Participation and Equity 75
4.5 Personnel Issues 78
4.6 Quality of Higher Education 79
Chapter 5 Teaching and Learning 85
5.1 Standards 85
5.2 Curriculum 87
5.3 Textbooks 89
5.4 Teaching and Learning Methodologies 89
5.5 Medium of Instruction 92
5.6 Multigrade Teaching 93
5.7 Assessment of Student Learning 94
5.8 International Standard School (RSBI/SBI) 99
Chapter 6 Teacher Management and Development 103
6.1 The Teacher Workforce – Past and Present 104
6.2 Teacher Supply and Deployment 105
6.3 Raising the Caliber of Existing Teachers 111
6.4 Raising the Caliber of Teachers Entering the Profession 121
6.5 Quality Improvement for School Principals and School Supervisors 124
Chapter 7 Conclusion 127
Statistical Annexes 130
Annex A: Early Childhood Education 131
Annex B: Primary Education 133
Annex C: Junior Secondary Education 137
Annex D: Senior Secondary Education 141
Annex E: Higher Education 145
Bibliography 147
List of Boxes
Box 1. Funding Mechanisms 24
Box 2. Education Funding at District Level – The Case of Tuban District 30
Box 3. Inclusive Education Initiatives 60
Box 4. Innovative Literacy Programs 65
Box 5. Scholarship Schemes for University Students in Indonesia 74
Box 6. Inside Indonesia’s Mathematics Classrooms 91
Box 7. Multigrade Teaching in Pacitan 94
List of Figures
Figure 1. Projected Population of Children of Age 7-12 5
Figure 2. Indonesia’s Formal Education System 10
Figure 3. Education Sector Governance and Management 16
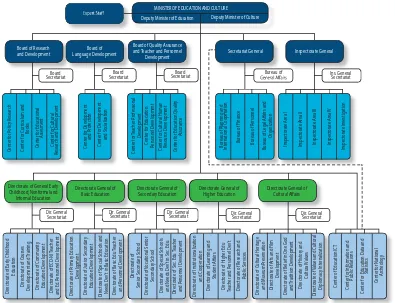
Figure 4. MoEC Organizational Structure 17
Figure 5. Flow of Data, Verifi cation and Validation 20
Figure 6. Distribution of 50 Districts by Education Governance Capacity 21
Figure 7. Increasing Number of Provinces and Districts 22
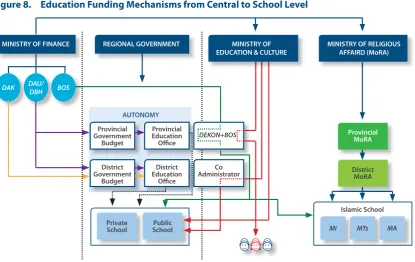
Figure 8. Education Funding Mechanisms from Central to School Level 24
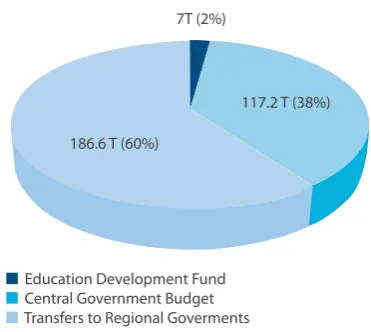
Figure 9. National Education Budget – Revision (APBN-P) 2012 26
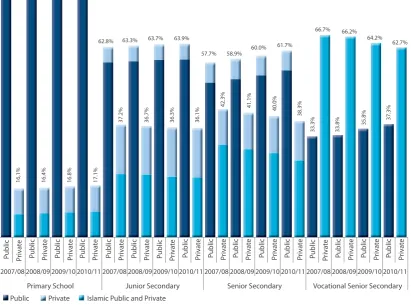
Figure 10. Ratio of Students in Public and Private Schools (2007/08 – 2009/10) 28 Figure 11. Increase in Government Spending on Teacher Salaries and Allowances after
Enactment of Teacher Law 2005 29
Figure 12. Education Spending – Tuban District 30
Figure 13. GER of Kindergartens by Province (2011/12) 37
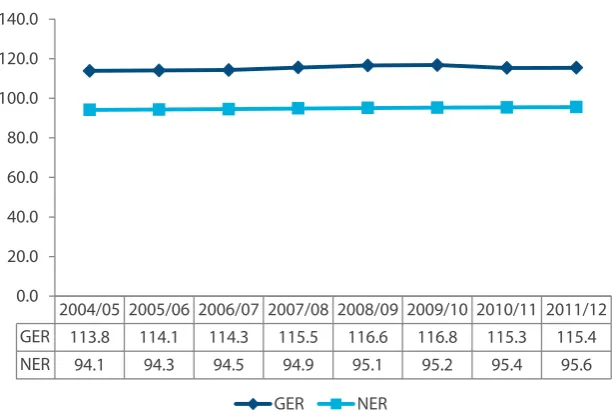
Figure 14. GER and NER for Primary School (2004/05 - 2011/12) 41
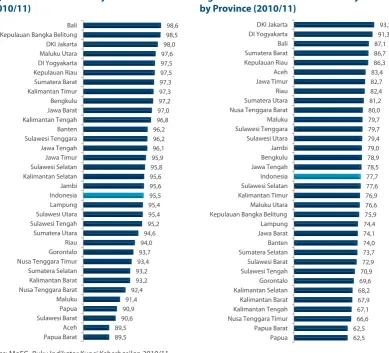
Figure 15. NER for Primary School (2010/11) 44
Figure 16. NER for Junior Secondary School by Province (2010/11) 44
Figure 17. Gross and Net Enrollment Rate and Enrollment Number Growth, Senior Secondary
(2000/01-2011/12) 46
Figure 18. Number of Junior Secondary Graduates and Transition Rate (2000/01-2010/11) 47 Figure 19. Variation of SSE Gross Enrollment Rates across Provinces and Districts (2010/11) 48
Figure 20. Gender Parity Indices (GPI) – Senior Secondary 49
Figure 21. Dropout and Repetition Rates (2000/01 - 2010/11) 50
Figure 22. Enrollment Rate of General and Vocational Senior Secondary (2009/10) 54
Figure 23. Employment by Industry and Education 55
Figure 24. Dropout Numbers and Rates for Vocational Senior Secondary and
General Senior Secondary (2000/01 – 2004/05 - 2010/11) 56
Figure 25. Illiteracy Rate Among Residents Aged 15 Years and Above 63
Figure 26. Gender Equality Ratio Among Illiterate Person 63
Figure 27. Illiteracy Rates by Province and Gender (2010) 63
Figure 28. Gender and Age of Non-Literate Population 64
Figure 29. Higher Education Expenditure as a Percentage of Annual Household Income 74
Figure 30. Gross Enrollment Rates – Higher Education in ASEAN (2010) 75
Figure 31. Transition Rate from Senior Secondary to Higher Education by Province (2009/10) 76
Figure 32. Attainment Profi le of 27 Year Olds (2010) 77
Figure 34. Lecturers by Educational Attainment (2009/10) 78
Figure 35. Higher Education Accreditation Process 79
Figure 36. Proportion of Higher Education Enrollments by Field of Study (2008) 82
Figure 37. Eight National Education Standards 86
Figure 38. Distribution of Senior Secondary School Scores (National + School) (2011/12) 95
Figure 39. Change in Equity and Performance Levels between 2000 and 2009 97
Figure 40. Primary School Teachers by Age (Comparison - 1999 and 2008) 105
Figure 41. Student/Teacher Ratio (STR) – Countries Comparison 106
Figure 42. Growth in Primary Student Enrollments/Number of Teachers (2000 – 2010) 106 Figure 43. Growth in Junior Secondary Student Enrollments/Number of Teachers (2000 – 2010) 107 Figure 44. Growth in Senior Secondary Student Enrollments/Number of Teachers (2000 – 2010) 107
Figure 45. Changes in Student/Teacher Ratios (All levels, 2000 – 2010) 108
Figure 46. Changes in Number of Teachers in Terms of Status and Level (2007 – 2010) 109
Figure 47. Percentage of Primary Schools by Type with Surplus/Defi cit 110
Figure 48. Class Size and Teacher Adequacy for Primary Schools in Tuban District 110
Figure 49. Primary School Teacher Qualifi cations (2012) 112
Figure 50. Teacher Qualifi cations by Level (2012) 113
Figure 51. Teacher Certifi cation Model in Use 115
Figure 52. Teacher Career Pathway 119
Figure 53. National Examination (UN) Scores and PGSD Enrollments
(relative to the general population) 123
List of Tables
Table 1. Six Indonesian Economic Corridors 3
Table 2. Sources of GDP Growth by Sector (2010) 4
Table 3. School-life Expectancy for Representative Group of Countries from the Various Income
Strata, 2009 or the Latest Year Available 11
Table 4. Roles and Responsibilities of Central and Local Governments and Schools 19
Table 5. Local Education Governance Index 22
Table 6. National and Education Budget 2009-2013 (Rp in trillions) 25
Table 7. Education Sector Budget 2010 – 2012 (Rp in trillions) 26
Table 8. Profi le of Key Early Childhood Services in Indonesia 35
Table 9. Basic Education in Indonesia by Level, Type, Status and Formal/Non-form 38
Table 10. Number/Percentage of Primary Schools by Type (2010/11) 38
Table 11. Number of Students in Primary and Junior Secondary (2010/11) 39
Table 12. Number/Types of Junior Secondary Schools (2000, 2005, 2011) 41
Table 13. Percentage of Dropout Students by School Level and by Income Quintile 43 Table 14. Changes in Numbers of Institutions, Students and Teachers (2000/01 – 2004/05 – 2010/11)
47
Table 15. Number of Vocational Senior Secondary Schools and Students 53
(2000/01 - 2010/11) 53
Table 16. Number of Special Needs School (Public and Private) 59
Table 17. Number of Students Enrolled in Special Needs Schools 59
Table 18. Teacher Qualifi cations in Special Needs School (Primary and Junior Secondary) 59
Table 19. Non-Formal Education in Indonesia 62
Table 20. Distribution of HEIs and HEI Student Enrollments (2010) 75
Table 22. Accreditation Results of HEIs’ Study Programs (2012) 80 Table 23. Regional Industry Profi le and Distribution of Higher Education Institution 83
Table 24. A Comparison of the 1994 and 2004 Curricula 87
Table 25. Average Students per Grade - Sampang District, 2008 93
Table 26. Reading Competence of Indonesian Children Aged 15 in 2000, 2003, 2006, 2009 97 Table 27. Science Competence of Indonesian Children Aged 15 in 2000, 2003, 2006, 2009 98 Table 28. Mathematics Competence of Indonesian Children aged 13 in 1999, 2003, 2007 99
Table 29. Teachers by Employment Status, MoEC, 2010 104
Table 30. Teachers by School Type under MoEC and MoRA, 2010 104
Table 31. Civil Servant Teacher Salary (Selected Countries – 2008) 105
Abbreviations
ACDP Education Sector Analytical and Capacity Development Partnership
Kemitraan Pengembangan Kapasitas dan Analisis Sektor Pendidikan
ADB Asian Development Bank Bank Pembangunan Asia
APBD Province/District Budget Anggaran Pendapatan & Belanja Daerah
APBN National Budget Anggaran Pendapatan & Belanja Negara
APBN-P National Budget-Revision Anggaran Pendapatan & Belanja Negara-Perubahan
AusAID Australian Agency for International Development
AusAID
BALITBANG Research and Development Agency within Ministry of Education and Culture
Badan Penelitian dan Pengembangan, Kementerian Pendidikan dan Kebudayaan
BEC-TF Basic Education Capacity-Trust Fund (The Netherlands Government and European Commission funded project administered by the World Bank)
Proyek di bidang pendidikan dasar yang didanai oleh Pemerintah Belanda dan Komisi Eropa, dan dikelola oleh Bank Dunia
BAN-PT National Board of Accreditation for Higher Education
Badan Akreditasi Nasional-Perguruan Tinggi
BAPPENAS Ministry of National Development Planning Badan Perencanaan Pembangunan Nasional
BKN National Civil Servants Board Badan Kepegawaian Negara
BOS School Operational Assistance Fund Bantuan Operasional Sekolah
BPS Central Bureau of Statistics Biro Pusat Statistik
BSNP National Education Standards Board Badan Standard Nasional Pendidikan
CPD Continuing Professional Development Pengembangan Keprofesian Berkelanjutan
CTL Contextual Teaching Learning Pembelajaran Kontekstual
DAK Special Allocation Fund Dana Alokasi Khusus
DAU General Allocation Fund Dana Alokasi Umum
DBE Decentralized Basic Education (USAID program)
DBE (Program USAID)
DBH Revenue Sharing Fund Dana Bagi Hasil
DEO District Education Offi ce Dinas Pendidikan Kabupaten/Kota
DGHE Directorate General of Higher Education Direktorat Jenderal Pendidikan Tinggi (DIKTI)
DPR-RI House of Representatives (National level) Dewan Perwakilan Rakyat, Republik Indonesia
DPRD House of Representatives (Province and District level)
Dewan Perwakilan Rakyat Daerah (Provinsi dan Kabupaten/Kota)
D1, 2, 3, 4 Post-secondary diploma (1-year), (2-year), (3-year), (4-year)
D1, 2, 3, 4
ECD Early Childhood Development Pengembangan Anak Usia Dini (PAUD)
EFA Education for All Pendidikan untuk Semua
EMIS Education Management Information System Sistem Informasi Manajemen Pendidikan
EU European Union Uni Eropa
GER Gross Enrollment Rate Angka Partisipasi Kasar (APK)
GPI Gender Parity Index Indeks Paritas Gender
GR Government Regulation Peraturan Pemerintah (PP)
HEI Higher Education Institution Lembaga Pendidikan Tinggi
INPRES Presidential Instruction Instruksi Presiden
KTSP School Based Curriculum Kurikulum Tingkat Satuan Pendidikan
KKG Teacher Working Group Kelompok Kerja Guru
LPMP Institute for Education Quality Assurance Lembaga Penjaminan Mutu Pendidikan
LPTK Teacher training institutions – a generic name for HEIs producing teachers
Lembaga Pendidikan Tenaga Kependidikan
MA Islamic Senior Secondary School Madrasah Aliyah
MBS School Based Management Manajemen Berbasis Sekolah
MDGs Millennium Development Goals Tujuan Pembangunan Milenium
MI Islamic Primary School Madrasah Ibtidaiyah
MoEC Ministry of Education and Culture, formerly Ministry of National Education (MoNE)
Kementerian Pendidikan dan Kebudayaan (Kemdikbud)
MoF Ministry of Finance Kementerian Keuangan (Kemenkeu)
MoRA Ministry of Religious Aff airs Kementerian Agama (Kemenag)
MP3EI Master Plan for Acceleration and Expansion of Indonesia’s Economic Development
Masterplan Percepatan dan Perluasan Pembangunan Ekonomi Indonesia
MSS Minimum Service Standards Standar Pelayanan Minimal (SPM)
MTs Islamic Junior Secondary School Madrasah Tsanawiyah
MULOK Local content curriculum Muatan local
NER Net Enrollment Rate Angka Partisipasi Murni (APM)
NFE Non-Formal Education Pendidikan Non Formal
NUPTK Teacher and Education Worker ID Number Nomor Unik Pendidik dan Tenaga Kependidikan
OECD Organisation for Economic Co-operation and Development
OECD
ODL Open and Distance Learning
P4TK Center for Development and Empowerment of Teachers and Education Personnel
Pusat Pengembangan dan Pemberdayaan Pendidik dan Tenaga Kependidikan
PAKEM Student-centered learning or Active, Creative, Eff ective and Joyful Learning
Pembelajaran Aktif, Kreatif, Efektif dan Menyenangkan
PDSP Center for Education Data and Statistics Pusat Data dan Statistik Pendidikan
PEO Provincial Education Offi ce Dinas Pendidikan Provinsi
PLPG Education and Training for Teacher Profession Pendidikan dan Latihan Profesi Guru
PIRLS Progress in International Reading Literacy Study
PIRLS
PISA Program for International Student Assessment PISA
PKB Pengembangan Keprofesian Berkelanjutan Continuing Professional Development
PLPG Pendidikan dan Latihan Profesi Guru Professional Teacher Education and Training
PNS Civil Servant Pegawai Negeri Sipil
PPPG Center for Teacher Development Pusat Pengembangan Penataran Guru
RA Islamic Kindergarten Raudhatul Athfal
RENSTRA Five Year Strategic Plan Rencana Strategis
SD Primary School Sekolah Dasar
SDLB Special Needs Primary School Sekolah Dasar Luar Biasa
SMA General Senior Secondary School Sekolah Menengah Atas
SMK Vocational Senior Secondary School Sekolah Menengah Kejuruan
SMPLB Special Needs Junior Secondary School Sekolah Menengah Pertama Luar Biasa
SNP National Education Standard Standard Nasional Pendidikan
SSE Senior Secondary Education Sekolah Menengah
STR Student/Teacher Ratio Rasio Murid/Guru
SUSENAS National Socioeconomic Survey Survei Sosial Ekonomi Nasional
S1 Degree equivalent to a Bachelor’s Degree S1
S2 Degree equivalent to a Master’s degree S2
S3 Degree equivalent to a Ph.D. S3
TK Kindergarten Taman Kanak-kanak
TIMSS Trends in International Mathematics and Science Study
TPA Teacher Performance Appraisal Penilaian Kinerja Guru
UN National Examination Ujian Nasional
UPTD Sub-district Technical Implementation Unit Unit Pelaksana Teknis Daerah
USAID United States Agency for International Development
This report on the education sector in Indonesia aims to present a picture of the path taken by the education sector since major political and socio-economic changes began to transform the country fi fteen years ago. The report will show how education has changed, where the sector is currently and where it is likely to head in the foreseeable future.
Indonesia is the fourth largest country in the world, with more than 240 million people. The country is very diverse, with 722 languages spoken as fi rst languages. Starting in 1998, Indonesia embarked upon a path of political transformation from an autocratic to a democratic form of government. Signifi cant changes were initiated at all levels, particularly the devolution of signifi cant levels of authority from central government to regional governments. Indonesia’s economy is vibrant and diverse, and has been growing steadily at a rate of 4 to 6 percent over the last decade. Sustaining economic growth will be a major undertaking and the government recognises that improving the quality of the education system in order to move towards a knowledge based economy will be a key factor.
In the past 15 years, several signifi cant developments have had a major impact on the education sector as it is today. These developments include:
• The rapid increase in the number of school age children due to rising birth rates, particularly from the 1950s until the 1980s;
• A major school construction program started in the mid-1970s, which saw a signifi cant increase in enrollment rates, particularly at primary level;
• The inclusion of Islamic schools as a recognized part of the formal education system in the 1970s;
• The introduction of 6 years of compulsory education in 1984, raised to 9 years in 1994;
• The decentralization of education governance and management in the late 1990s, which has seen the main responsibility for education service delivery devolved to the district level.
The education system in Indonesia comprises formal education, which includes kindergarten through to university level, as well as non-formal education, which includes early childhood development (e.g. playgroups), school equivalency “packages” covering primary, junior and senior secondary school education, literacy classes and Islamic boarding schools or pesantren.
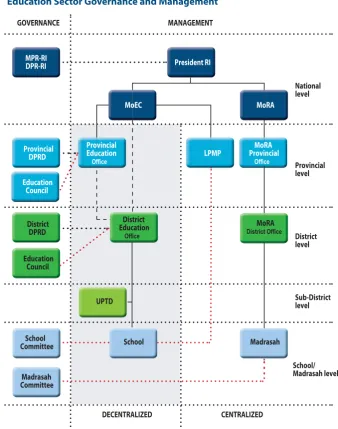
Under a decentralized system, MoEC retains a direct presence in 31 out of 34 provinces through the direct management of Institutes for Education Quality Assurance (Lembaga Penjaminan Mutu Pendidikan or LPMP). The main role of LPMP is to assure quality education for kindergarten, basic and secondary levels.
The role of the Provincial Education Offi ces (PEO) has changed signifi cantly. Previously, the PEO played a key role in directly managing the implementation of education services and programs, but this has changed. The main authority for delivering education services has been shifted from the provincial to the district level, limiting the provincial government’s role in education to the coordination of education delivery between districts within each province.
The roles and responsibilities of District Education Offi ces (DEOs) include planning, implementing, monitoring and evaluating education programs and activities. The District House of Representatives (DPRD) is responsible for discussing and approving education programs and budgets proposed by the district government. In addition, an Education Council (Dewan Pendidikan) has been mandated at district and province levels as part of the decentralized education system. The Education Council is a non-governmental institution whose membership represents a cross-section of the community.
In general, decentralization has brought signifi cant progress in using public participation to determine the direction of education development. Subsequently, the level of local control over education services is becoming increasingly direct and more straightforward. However, local government capacity for eff ective management and delivery of education services is variable and this remains a key challenge.
A decentralized education system also encourages increased autonomy at school level, which brings increased responsibilities for planning, implementation, monitoring and evaluating school programs and activities, as well as increased community participation through the establishment of school committees. A school-based management (Manajemen Berbasis Sekolah or MBS) approach has been adopted, which focuses on student-centered learning, eff ective school management, and community participation, particularly through the establishment of school committees. Although MBS is widely accepted as an appropriate model, signifi cant challenges remain in implementing it nationwide.
School-based management has also altered the roles played by teachers, school principals, and the community. This has been particularly challenging for teachers, who have been required to make the transition from a teacher-centered methodology to a student-centered approach. School principals have also been expected to become more autonomous managers, capable of longer-term planning, transparent fi nancial management, and the provision of eff ective support to, and monitoring of, teachers. In addition, communities have been expected to become more involved in school management through their representatives on the school committee.
Education fi nancing works in multiple and complex layers, through which funding from the central government is transferred across government offi ces at central and regional levels. The variety of diff erent education sector funding mechanisms presents signifi cant challenges for eff ective and effi cient planning, resource allocation and fi nancial reporting.
At the district level, a majority of local governments allocate between 30% and 40% of their overall budgets to education. However, on average, 80-85% of education sector funding is allocated to personnel expenditures, which leaves a limited amount for education development.
Although enrollment in various ECD activities has continued to increase, it is estimated that approximately 15 million children aged 0 to 6 years are not participating in any early child development program. There are also regional disparities, with provinces in Eastern Indonesia, in particular, having low participation rates. Other key challenges include the need to strengthen coordination and capacity, and to mobilise increased resources for ECD.
Over the past decade, Indonesia has made considerable progress towards achieving the Education for All (EFA) goals, which relate to free and compulsory basic education (primary and junior secondary education), including gender equity, and student performance outcomes.
However, these achievements have not come without challenges. Although national net enrollment rates are quite high at 95.5% in 2011/12 and there appears to be parity in terms of male/female enrollment in basic education, there are signifi cant regional disparities, particularly in Eastern Indonesia. Also, the EFA Mid-Decade Assessment Report emphasized the need to improve the quality and relevance of education.
Basic education in Indonesia is divided into two levels: primary school (six years) and junior secondary school (three years). Although each level consists mainly of formal education, this sub-sector also includes non-formal education (out-of-school equivalency programs). Formal education at each of the two levels is provided by a combination of public and private schools (including both faith-based and for-profi t schools), which falls under the responsibility of MoEC, and Islamic schools or madrasah, which falls under the responsibility of MoRA. Public schools comprise the majority of primary schools (79.8%).
The Government of Indonesia is committed to a compulsory, free basic education policy. To support this policy, it has implemented several programs. The School Operational Assistance or BOS program, introduced in 2005, has perhaps had the widest impact at school level across the country. The BOS program is based on enrollments and covers around 44 million students in 228,000 primary and secondary schools (public and private).
While overall enrollment rates, particularly for primary level, are high, a signifi cant number of children, particularly those in remote, mountainous or island communities, still lack access to education. Although the overall transition rates from primary school to secondary school have increased signifi cantly – net enrollment rates at junior secondary level rose from 58.6% in 2001 to 77.7% in 2011/12- more than half a million children still fail to continue their studies beyond primary level.
Senior secondary education consists of general senior secondary schools (SMA), vocational senior secondary schools (SMK), and Islamic senior secondary schools (MA). The past decade has seen signifi cant growth in the SSE sub-sector, marked by increases in enrollment, the establishment of new schools, and increased provision by private education providers.
The signifi cant increase in senior secondary enrollment over the past decade has masked regional disparities. Comparing senior secondary education GER across 460 districts reveals considerable variations between districts, from as low as 22.4% to as high as 134.3%. Seven provinces have districts with a GER below 30%. These disparities indicate that greater focus needs to be placed on expanding access to SSE in those districts and provinces. While Eastern Indonesia is typically regarded as lagging behind, geographical disparity is more widespread.
Senior secondary education also faces ineffi ciency issues due to dropout and repetition. In 2010/2011, 142,275 students dropped out from SMA, and 98,640 dropped out from SMK. Furthermore, a total of 27,215 students across both types of school repeated classes. Thus, in total, there were 268,130 students who either dropped out or repeated grades.
between 2001 and 2010. This rapid growth in large part refl ects the increasing priority given to this sub-sector as a key strategy for economic development. However, this signifi cant growth has tended to be supply-driven rather than demand-driven, which has created challenges in ensuring that the skills of graduates from vocational education are matched to the demands of the labor market.
Vocational education and training is off ered through both formal and non-formal services. Formal vocational education and training is off ered at the secondary level through vocational senior secondary schools (SMK) and at the higher education level through Diploma I, II, III, and IV programs, including a 3-year program within polytechnics and academies (akademi) at the Diploma III level and the planned community college Diploma I or II programs.
The National Education Standards Board (BSNP) has issued detailed competency standards and curriculum guidelines for vocational education. In addition, the Ministry of Manpower and Transmigration has issued National Competency Standards for Work, which were developed in cooperation with industry stakeholders. Currently, the government is in the process of identifying feasible options for including industry-relevant competency standards in the curricula of the vocational schools.
Special needs education is a relatively new fi eld within the education sector in Indonesia. During the past decade, signifi cant developments have been made in establishing a more inclusive educational approach. Regulations require that provincial governments should provide at least one special school for each impairment and that district governments should provide inclusive special needs education in regular schools. The aim is for districts to provide inclusive education for all learners through the formal school system, and for provinces to provide the necessary support and referral systems for inclusive schools through their special education school networks.
While signifi cant progress has been made, several issues remain. Many provinces, cities and districts are currently providing education for children with disabilities through two types of schools – segregated special schools and inclusive regular schools – with few links between them. There is also a lack of resources available, both in terms of funding as well as human resources for both special needs schools and inclusive education.
Non-formal education is provided by school equivalency programs at primary, junior and senior secondary levels. These programs play an important role in accelerating universal access to education by providing education for those who have missed out on schooling, have dropped out from school, and who are likely to be excluded from schooling. Over 800,000 people were enrolled in these programs in 2010. The value of non-formal education lies in its fl exibility and the formal recognition it has received from the government.
Indonesia’s eff orts to reduce illiteracy through literacy programs are considered to have been very successful. Illiteracy rates among those aged 15 years old and above decreased by more than half between 2005 and 2009 (from 10.2% in 2004 to 5.3% in 2009). A major challenge is maintaining the literacy levels of those who have been through literacy programs.
In addition, it should be noted that many private skills training institutions are operating. These largely cater to people continuing education beyond junior or senior secondary level (and drop outs from secondary education). Common courses include computing, hairdressing, sewing, and English language. In 2012, 575,000 people participated in around 18,000 such institutions, of which very few are accredited.
The higher education sector in Indonesia has expanded as the country’s economy has grown. Currently, the Indonesian higher education system is diverse and boast s nearly 3,800 higher education institutions serving almost 5.4 million students. Higher education in Indonesia is still directly managed by the central government. MoEC is responsible for managing public and private higher education institutions, and MoRA is responsible for managing public and private Islamic higher education institutions. In addition, several other government ministries and agencies administer 82 higher education institutes.
Indonesia’s higher education landscape is characterized by growth in provision by private institutions. Of the 3,794 higher education institutions, 96.3% are private. Although public institutions represent only 3.7% of the total, they account for 38.3% of enrollments. When compared to other countries in ASEAN, Indonesia’s Gross Enrollment Rate (GER) for higher education is relatively low. Data shows that only 23% of youth in the 19-24 age group were enrolled in higher education in Indonesia in 2010, which is half of Thailand’s GER.
Gender inequality increases as students move up through the various levels of HE. However, there are variations between public and private institutions. Female students are more highly represented at the diploma level in most institutions. Whilst at the highest level – PhD or S3 – women make up only between 16.6% (in faith-based public institutions) and 36.5% (in general public institutions) of total enrollments.
The 2012 report of the Board for Higher Education Accreditation suggests that the overall quality of many HEIs in Indonesia is still limited. Covering all types of HEIs, there are a total of 14,489 study programs off ered to students throughout Indonesia, with public institutions leading the way in terms of quality (with the exception of a few well-established private universities). A cause for concern is that a signifi cant proportion (20.5%) of the total number of study programs has not yet been accredited, due to the limited number of assessors and the large number of study programs. More than half of these (67%) are private. Accreditation results provide a picture of the diff erences in quality between public and private HEIs with publicly provided programs being rated signifi cantly higher than privately provided programs.
In 2011, the Government of Indonesia issued the Master Plan for Acceleration and Expansion of Indonesia’s Economic Development (MP3EI) for 2011-2025. The plan provides a framework for transforming Indonesia into one of the ten largest economies in the world by 2025 by sustaining real national annual economic growth at 7%-9%. Higher education plays an important role in achieving this target by supplying high-quality, productive human capital as well as strengthening research and innovation.
These changes have not been made without challenges – for example, many teachers have struggled to adopt the competency-based curriculum. Moving from a teacher centered, rote learning approach to a student-centered approach, which encourages questioning and creativity in the classroom, has also been challenging for many teachers.
The Indonesian education system uses both in-class tests and national examinations to assess student learning outcomes and academic achievement. The results of these tests and examinations are used to assess student levels and as prerequisites for students to move to a higher grade. National Examinations are mandated at the end of Years 6, 9, and 12. The national examination system presents signifi cant challenges both in terms of its administration and in terms of its validity and reliability in assessing student learning outcomes.
Indonesia has been an active participant in international programs that measure students’ levels of competence such as PISA (Program for International Student Assessment), PIRLS (Progress in International Reading Literacy Study) and TIMSS (Trends in International Mathematics and Science Study). PISA reading test results show that while overall reading competence continues to be fairly low – with large numbers of students clustered towards the lower end of the scale – there has been a gradual improvement over the nine-year period, from an overall average of 371 in 2000 to 402 in 2009. In competency in science, students in Indonesia ranked 38th out of 41 countries in 2000 and 60th out of 65 countries in 2009. In TIMSS measurements of competence in mathematics, Indonesia students were ranked 34th out of 38 countries in 1999 and 36th out of 48 countries in 2007.
Following the publication of TIMSS 2007, MoEC and the World Bank have worked together to conduct a video study, involving 100 schools from 17 provinces, to see what is happening inside mathematics classrooms in Indonesia. While the fi ndings of the video study noted several positive aspects of teaching and learning, they also highlighted the teacher-centered nature of many classrooms, where students and teachers do not engage in conversations. In the classroom, teachers dominate the communication.
The Indonesian language, or Bahasa Indonesia, is used throughout the education system as the medium of instruction. However, Bahasa Indonesia is by no means universally understood. It is just one of 722 languages spoken in Indonesia. In urban areas, 8.5% of those aged between 5 and 9 had no ability in Bahasa Indonesia, while in rural areas almost 23% of children lacked ability. This implies that using Bahasa Indonesia as the exclusive medium of instruction – particularly in early primary education – may place children at a disadvantage. This issue is not widely appreciated, but it may contribute to Indonesia’s relatively poor performance in international tests. It is signifi cant that the teachers of thirteen-year-old Indonesian children participating in the 2006 PIRLS estimated that 21% of their students would “have diffi culty understanding the spoken language of the test” even though the test was written in Bahasa Indonesia. The ubiquitous use of multiple-choice questions in National Examination (Ujian Nasional or UN) at all levels disguises the problem because it does not require any productive use of language.
Indonesia has undertaken major eff orts to improve teacher management. These eff orts have been supported by the 2005 law on Teachers and Lecturers. A key requirement under this law is that the minimum teacher academic qualifi cation be increased from Diploma-2 (two years education after completion of senior secondary education) to an academic bachelor degree (S1) or D4. A second requirement is that all teachers must successfully complete the certifi cation process by 2015. Further, the law sets minimum competency standards in the areas of professionalism, pedagogy, social skills and personal behavior. The law not only specifi es what teachers should be able to do and how they should behave, but also addresses the issue of teacher welfare by introducing a new set of professional allowances for teachers who have successfully completed the teacher certifi cation process and for those who work in remote areas.
to teachers working on a contract basis with national or district level governments, to teachers working on a contract basis with schools or foundations providing private education.
The increased recruitment and training of new teachers, particularly in the two decades since expanding primary schools, is refl ected in the shifts seen in primary level teacher demographics. The percentage of teachers under 30 years of age has reduced signifi cantly over the past decade, from 50% in 1999 to 13% by 2008, as those recruited during the expansion period in the 1970s and 1980s move closer to retirement age. At the same time, the number of new teachers entering the workforce over the past decade has continued to increase, relative to student enrollments. This shift has implications for addressing fundamental issues relating to teacher supply and distribution, particularly at the primary level.
Student/Teacher Ratios (STR) in Indonesia have been relatively low for a long time in comparison with other countries. However, teachers’ educational qualifi cation still varies considerably: 51% of teachers still do not have an S1/D4 qualifi cation, and at 76%, the fi gure is even higher at the primary school level. As regards certifi cation, around 1.9 million teachers have not yet been certifi ed. The challenges are then to improve aggressively the qualifi cation and competence by means of certifi cation to ensure that all teachers meet requirements as set out in the National Education Standards (NES).
To support teacher quality management a Teacher Continuing Professional Development (CPD) and Performance Appraisal system has been established, which involves an annual cycle of professional development planning, implementation, and evaluation. In addition, MoEC is in the process of establishing a comprehensive system to improve the performance of school principals and school supervisors.
In the longer run quality improvement of teachers will have to be conducted at the pre-service education stages. In Indonesia there are 374 Teacher Training Institutes (32 public and 342 private institutions) to raise the caliber of candidate teachers entering the profession; ten Teacher Training Institutes were converted into universities in 1990 to provide higher quality programs with more content focus.
A major new initiative is the introduction of a post-graduate Center for Teacher Development (Pusat Pengembangan Penataran Guru – PPPG). This is a mandatory, post-graduate professional development program that candidate teachers are required to complete successfully before they can enter the profession. The objective of the PPPG is to ensure that candidate teachers will have the competencies required to plan, deliver and evaluate educational activities and to conduct and develop their professionalism on a continuing basis.
The government is currently putting new policies in place to improve the quality of students who want to become teachers. These include: (i) imposing quotas on the number of students allowed to enter teacher training institutes; (ii) improving student selection; (iii) providing scholarships for students who take up the teaching profession; and (iv) introducing the system of multi-subject teaching. Implementation is scheduled for 2013.
In conclusion, Indonesia has been undergoing a process of rapid change since its emergence as one of the world’s largest democratic states more than a decade ago. In the context of decentralization, a strong regulatory framework for education has been put in place, including laws, regulations and standards, and this framework continues to be adjusted in order to better meet both national and regional realities and socio-economic changes. At the same time, major eff orts have been made to ensure that relevant stakeholders at all levels have a clearer understanding of this new system.
• Decentralization: Within just over a decade, Indonesia has managed to bring about profound changes in governance and management. Education management and service delivery has been largely devolved from the central level to the district/municipality level. Functions have been redefi ned and structures have been adjusted to support these new roles. At the same time, the capacity to eff ectively deliver quality education at this level remains limited in several areas.
• Regulatory Framework: The government has put in place a strong regulatory framework for education, in the form of Laws, Government Regulations, Ministerial Decrees, standards and other measures. Ensuring that this framework is fully understood and implemented, particularly at the regional level, remains key challenge.
• Financing of Education: The education sector is now receiving more funding than ever before, through a range of funding mechanisms. With the Constitution mandating that at least 20% of the budget at both national and regional levels be allocated to education, and a strong economy with increased economic growth predicted, funding for the sector is likely to continue increasing for the foreseeable future. The key challenge is to improve the eff ectiveness and effi ciency of education spending.
• Access: Indonesia has made signifi cant progress in increasing access particularly at primary and junior secondary education levels. However, there are still a signifi cant number of children who do not have access to basic education, due to remoteness and/or poverty, and reaching these children remains an ongoing challenge. In addition, it will be important to focus eff orts on equitable expansion of senior secondary education.
• Free Basic Education: In 2005, the Indonesian Government established the School Operational Assistance Fund or BOS, which enabled the abolition of tuition fees for primary and junior secondary schools. This has contributed signifi cantly to improving access as well as ensuring that schools, particularly those in more remote or poorer communities, have an operational budget, often for the fi rst time.
• Quality: Following the major achievements in increasing access to education the pressing priority is to improve quality. The establishment of the National Education Standards and related systems for planning, implementation and monitoring provide a framework for quality improvement. Teaching and learning has undergone a major change over the past decade, with a shift from a teacher-centered to a student-teacher-centered methodology. While major eff orts have been made to train teachers and school principals in the new methodology, the impact has often been limited due to a variety of capacity constraints. A further key challenge is the need to develop appropriate and reliable systems for assessment of student learning as part of a coherent and integrated system for quality improvement.
• Teacher Supply: Indonesia has one of the lowest student-teacher ratios in the world. STR’s are below global averages, and well below countries of similar development status, and below international benchmarks associated with good education quality. The fi scal implications of teacher utilisation are a key issue for the education sector. A large share of education expenditure is allocated to teacher salaries and allowances. In addition, the status of teachers has a signifi cant impact, in particular the costs associated with the professional certifi cation allowance and the fi nancial implications of civil servant and non-civil servant teachers. Among the primary challenges with respect to teachers are to improve their qualifi cation and competence, and to support a more sustainable quality improvement system by means of Continuous Professional Development system. In addition, redistribution of teachers needs to be undertaken to ensure more effi cient utilization of the overall teacher workforce.
This report on the education sector in Indonesia aims to capture a picture of the path the education sector has taken since over a decade ago when major political and socio-economic changes started to transform the country. The report covers the education sub-sectors, including formal and non-formal education, as well as the overarching areas of governance and education fi nancing. In addition to providing a brief description of each sector, the report highlights relevant trends for each sub-sector, as well as the key issues and challenges they face. Although the report does not provide specifi c recommendations for addressing ways in which issues should be addressed, it does, in places, suggest directions that could be taken.
The report begins by describing the country as a whole and discussing the political changes that were initiated at the start of the ‘Reform Era’ in 1998. The report goes on to briefl y look at economic and demographic developments, particularly those aff ecting the education sector. Chapter 2 provides an overview of the education system and examines issues surrounding decentralization and fi nance. Chapter 3 covers the formal and non-formal sub-sectors of basic, senior secondary, vocational and special education. Chapter 4 examines the sub-sectors of higher education, both public and private. Chapter 5 looks at teaching and learning. Chapter 6 focuses on teacher management and development, specifi cally the issue of teacher distribution and teacher professional development. Finally, Chapter 7 concludes by consolidating the main points, including key achievements and challenges.
1.1 Indonesia
Indonesia is spread across a string of 17,508 islands1 between the Indian and Pacifi c Oceans. With a population of more than 240 million, it is the fourth largest country in the world. Ethnically, it is a highly diverse country. Of the 722 living languages used as fi rst languages in Indonesia, 719 are indigenous languages.2 The national language is Indonesian, or Bahasa Indonesia, and is based on the Malay language of northeast Sumatra.3 Besides containing hundreds of ethno-linguistic groups, the country has a range of economic and social systems from forest dwelling to urban cosmopolitans.
1 CIA. (2012). The World Factbook. https://www.cia.gov/library/publications/the-world-factbook/geos/id.html. Accessed on 2
Oct 2012.
2 Lewis, P. M. (ed.). (2009). Ethnologue: Languages of the World, Sixteenth edition, Summer Institute of Language (SIL)
International, Texas. Online version http://www.ethnologue.com/.
3 For discussion on the use of Indonesian language as medium of instruction in classroom, please refer to Chapter 5 (5.5
Indigenous kingdoms existed in Indonesia before Europeans landed on the archipelago in the 1500s. Although nationalism arose gradually during the fi rst decades of the twentieth century, the Dutch colonial period, it developed more rapidly during the short period of Japanese occupation in the 1940s. Indonesia declared its independence on 17 August 1945.4 Set out in the preamble to the 1945 Constitution, fi ve key principles embody the essence of the newly independent Indonesian state. These principles, the Pancasila principles, arose and resulted from a complex and sophisticated appreciation of the ideological needs of the new nation, particularly the vast cultural diff erences of its heterogeneous population. The Pancasila principles are: (i) belief in one supreme God; (ii) humanitarianism; (iii) nationalism expressed in the unity of Indonesia; (iv) consultative democracy; and (v) social justice. Similar to Bahasa Indonesia, which Sukarno also promoted, the Pancasila did not emerge from any particular ethnic group. Instead, Pancasila was intended to defi ne the basic values for a unifi ed “Indonesian” political culture.
Pancasila promotes a belief in monotheism, but in a religiously neutral and tolerant manner that places Islam on equal footing with other religious systems such as Christianity (Catholicism and Protestantism), Buddhism, and Hindu-Balinese, beliefs offi cially recognized by the government.5 Although freedom of religion is guaranteed in the 1945 Constitution, religion remains a complex issue and infl uences many aspects of life in Indonesia, including education. Having the world’s largest-Muslim population, Indonesia is now considered well placed to present an attractive democratic model for reform movements in the Islamic world.6
1.2 Political
Developments
In May 1998, Indonesia entered an era of transformation, which was in one respect a journey from an autocratic to a democratic form of government. Early on, a regulatory framework was put in place to promote the development of a free, democratic and vibrant society. To this end, amendments were built into the Constitution pertaining to the respect for universal human rights; the establishment of an independent Constitutional Court; the restriction of presidential powers; the bolstering of Parliament’s authority; and perhaps most importantly, the decentralization of government functions, including administrative powers, to regional governments. In reality, the country was moving from a unitary centralized state to a unitary decentralized state. Over the years, the policy intentions embedded in the regulatory framework have become reality on the ground. In the Suharto era, the executive was dominant and the legislature had more or less only a ‘ratifying’ function. However, this changed dramatically during the early stages of the transformation process, when there was a prominent shift in power from the Executive to the Legislature. This balance of power has remained in place until today.
The establishment of the Constitutional Court was a particularly signifi cant development in Indonesia’s transformation. Over the years, the Constitutional Court has developed into a highly respected and trusted institution. The Court has become the ‘legislature of last resort’ where civil society has the opportunity to defend its rights by requesting that legislation passed by the House of Representatives be changed or revoked. Important rulings of the Constitutional Court related to the education sector are described in Chapter 2.
Seen from a vertical dimension, the country’s transformation was a journey from a centralized to a decentralized form of government. To date, decentralization has brought a mix of positive and negative experiences and outcomes. In successful districts, local government has become more responsive to the needs of the people, and more innovative in designing and implementing development activities.
4 Frederick, W. H. and Worden, R. L. (ed.). (1993). Indonesia: A Country Study, GPO for the Library of Congress, Washington.
5 Ministry of Religious Aff airs website www.kemenag.go.id accessed on 2 Oct 2012.
6 Reid, A., (ed.). (2012). Indonesia Rising: The Repositioning of Asia’s Third Giant. Singapore: Institute of Southeast Asian
In other districts, local governments have sometimes found it diffi cult to change old ways of thinking and working in a centralized manner.
In response to the issues raised above, the government has embarked on a high-priority Administrative Reform Program. The overall objective of the program is to improve public service provision. Key components of the program include strengthening civil servant management systems and practices, harmonizing the regulatory framework between central and regional levels and strengthening the synergy between central and regional government by introducing a system of public service key performance indicators.
1.3 Economic D
evelopments
Today, Indonesia’s economy is vibrant and diverse; it has been growing steadily at an impressive rate of 4 to 6 percent over the last decade.7 Indonesia ranks 44th among 139 countries in the Global Competitiveness Index (GCI) issued by the World Economic Forum. Its 10-position improvement in the overall ranking since 2005 is the highest of all G20 Countries.8 According to the GCI report, Indonesia’s strengths include its rapid growth rate, sound fi scal management, and large domestic market. Some current projections show that Indonesia will become Asia’s third-largest economy (after China and India) by 2050, overtaking even Japan during that period.9
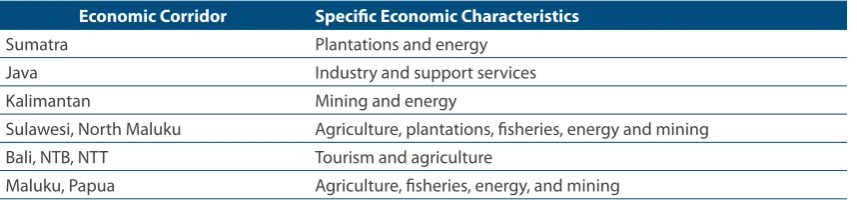
Regional diversity in economic expansion within Indonesia is an increasingly important growth stimulus. The Government of Indonesia has recently issued the Master Plan for Acceleration and Expansion of Indonesia’s Economic Development (MP3EI) for 2011-2025. The plan is designed to provide a framework to transform Indonesia into one of the ten largest economies in the world by 2025 by sustaining real national economic growth at 7 to 9 percent per year. The strategy to implement this plan includes developing regional economic potential in several geographic areas with specifi c economic characteristics (Table 1 below),10 known as the Six Indonesian Economic Corridors.
Table 1. Six Indonesian Economic Corridors
Economic Corridor Specifi c Economic Characteristics
Sumatra Plantations and energy Java Industry and support services Kalimantan Mining and energy
Sulawesi, North Maluku Agriculture, plantations, fi sheries, energy and mining Bali, NTB, NTT Tourism and agriculture
Maluku, Papua Agriculture, fi sheries, energy, and mining
Source: Coordinating Ministry for Economy. (2011). Master Plan for Acceleration and Expansion of Indonesia’s Economic Development (MP3EI) 2011-2025
Indonesia is very rich in natural resources, particularly oil and natural gas. However, oil and natural gas are not the biggest contributors to Indonesia’s GDP growth. In recent years other sectors such as tourism, manufacturing, communication, and business services have contributed more signifi cantly to GDP growth (Table 2 below).11
7 World Bank. Indonesia Overview. www.worldbank.org. Accessed on 29 Sept 2012.
8 Indonesia Shows Strongest Progress among G20 in New Competitiveness Report. The World Economic Forum www.weforum.
org. accessed on 29 Sept 2012.
9 Reid, A.. Indonesia’s New Prominence in the World. in Reid (Ibid). p.4.
10 Coordinating Ministry for Economy. (2011). The Master Plan for Acceleration and Expansion of Indonesia’s Economic
Development (MP3EI) 2011-2025.
Table 2. Sourc es of GDP Growth by Sector (2010)
Industry Sector Contribution to Growth (%)
Agriculture, livestock, forestry and fi sheries 0.4
Mining and quarrying 0.3
Manufacturing 1.1
Electricity, gas and water 0.0
Construction 0.4
Trade, hotel and restaurant services 1.4
Transportation and communication 1.1
Finance, real estate and business services 0.5
Other services 0.5
Total GDP Growth 2010 6.1
Source: BPS (Central Bureau of Statistics). (2011). BPS Strategic Data
Sustaining economic growth at 7 to 9 percent over the next decade is a major undertaking. The government recognises that the key to achieving this will be diversifying the economy and improving innovation by moving to a knowledge–driven economy led by skilled human resources.12 Improving the quality of the education system is critical to achieving these things. At the same time, sustained economic growth will help ensure that the resources are available to fund these improvements in education in Indonesia.
1.4 Demographic Deve
lopments
Among the structural advantages that result in optimism for Indonesia’s economic growth and performance, is the very favorable population structure. The Population Census data for 2010 shows that the population has grown from more than 206 million in 2000 to over 237 million in 2010.13 On the basis of this data, it is generally assumed that there has been an increase in the number of children born. However, the fertility rate is now down to around 2.1%, which is close to the level required simply to maintain the population. This suggests that population will stabilize in the foreseeable future.14 A likelier explanation for this population growth seems to be the signifi cant increase in life expectancy from 52.2 years in 1976 to 70.7 years in 2006.15
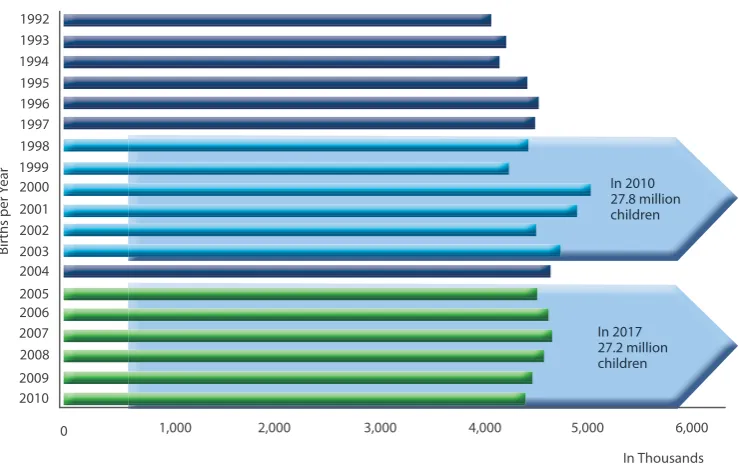
Comparing the number of children in the 7-12 years age cohort with the number of children in the 0-5 years cohort, it becomes apparent that the school-age population will become smaller in the years to come. On the basis of 2010 population census data, the total number of children in the 7-12 years cohort will decrease by about 628,000 over the next seven years. The proportion of population of productive working age is expected to peak around 2020.16
12 Coordinating Ministry for Economy, pp. 39-41.
13 National Population Census data, 2000 and 2010
14 Philip Bowring. (2010). Indonesia fertility rate is perfect for growth. Jakarta Globe. 31 March 2010
15 BPS. (2012). Trends of Selected Socio-Economic Indicators of Indonesia. August 2012
Figure 1. Projected P opulation of Children of Age 7-12 1992
1993 1994 1995 1996 1997 1998 1999 2000 2001 2002 2003 2004 2005 2006
2009 2010 2008 2007
0 1,000 2,000 3,000 4,000 5,000 6,000
In Thousands In 2017 27.2 million children
In 2010 27.8 million children
Births per
Y
ear
YY
Source: BPS. (2010). Population Census 2010.
In view of the decrease in the school-age population and taking into account the very high participation rate at primary level, the current school infrastructure for primary education will be suffi cient to absorb future learners. This means that there is likely to be only a very limited need to construct new primary schools and classrooms in the years to come. The main outstanding task is the rehabilitation of the existing school infrastructure. The signifi cant demographic change should enable greater allocation of fi nancial resources for the investments necessary for improving education quality and for increasing access to pre-school and senior secondary education.
of the System
Each of the education sub-sectors within Indonesia – early childhood, basic, secondary, tertiary and non-formal education – needs to be viewed within the framework of the education sector as a whole, as well as within the wider historical, political, legal and fi nancial context. Accordingly, this chapter will examine the relevant aspects of this framework and context, starting with developments of the past 40 to 50 years, which have directly shaped the education system as it is today. Following an overview of the formal education structure, key aspects of the regulatory framework will be outlined, as will the current strategic priorities of the Ministry of Education and Culture (MoEC) and the Ministry of Religious Aff airs (MoRA) as expressed in the fi ve-year strategic plan (or Renstra).
Perhaps the most signifi cant change over the past decade, which has directly shaped the Indonesian education system as it is today, has been the decentralization of education governance and management. Section 2.5 will describe and examine the changes that have taken place at all levels, as well as some of the issues that have arisen from this process. Finally, this chapter will look at the way in which the sector is fi nanced – the funding mechanisms and processes, as well as some of the key issues.
2.1 Recent Historical Context (1950s – 2000s)
The development of education in Indonesia has a long history. Earliest references to educational institutions were recorded during the Sriwijaya Empire, which dated from the 8th to 11th centuries AD17. However, developments that unfolded over the past 40 years have been most infl uential in shaping the current education system. Against the backdrop of a growing school-age population in the 1970s and 1980s, key developments have included:
• The signifi cant increase in access, particularly to primary education, achieved under the program of school construction, which started in 1974;
• The integration of Islamic education into the general education system, which started in 1975;
• The introduction of six years of compulsory primary education in 1984; and
• The implementation of a decentralized education system over the past decade which has brought profound changes to Indonesia’s education system.
2.1.1 High Birth Rates (1950s – 1970s)
The period following the end of the Second World War and the achievement of independence in Indonesia saw a signifi cant increase in birth rates. This increase meant that Total Fertility Rates (TFR) remained high throughout the 1950s – from a TFR of 5.5 in 1950-55 to 5.7 in 1955-60.18 Although fertility rates started to drop in the 1960s, due in large part to the government’s family planning program, the large numbers of children reaching school age from the 1960s onward had a major impact on the provision of education services. This was especially true for basic education, as the number of school age children far outstripped the number of schools available and led government to focus on school construction.
2.1.2 System Expansion (1970s)
In 1974, the Indonesian Government launched a major program of school construction, particularly at primary level, but also at junior secondary level. Known as INPRES (Instruksi Presiden or Presidential Instruction), this policy, coupled with the abolition of primary school fees in 1977, resulted in a major increase in primary school enrollments.19 In 1970, there were 13,395,000 children enrolled in primary schools. By 1980, this had risen to 22,487,000.20
2.1.3 Harmonization of Islamic/State Education (1970s – 1980s)
The fi rst Law on Education (Law No. 4 of 1950) only regulated general education and religious teaching in schools. Islamic education, in the form of pesantren and madrasah, was neither mentioned nor recognized. Marginalization of Islamic education was reinforced in 1972 by Presi dential Instruction No 34, which in eff ect placed Islamic education outside the state school system.21 In 1975, there was a move to integrate Islamic schools into the state school system with the signing of a joint decree on the Increase of Madrasah Educati