BATAM IN FIGURE 2014
Katalog BPS : 1101.001.2171BATAM DALAM ANGKA
BATAM IN FIGURE
2014
BADAN PUSAT STATISTIK
KOTA BATAM
BATAM IN FIGURE 2014
No Publikasi
Publication’s Number
: 21.71.13.01
Katalog BPS Kota Batam
BPS Kota Batam Catalogue
: 1102.001.2171
ISSN
ISSN
: 2355-4444
Ukuran Buku
/ Book Size
: 16 x 21 cm
Jumlah Halaman/
Number of Pages
:
xlvix + 295 Halaman/
xlvix + 295
Pages
Naskah/
Manuscript
:
Seksi Integrasi Pengolahan dan Diseminasi Statistik
Division of Data Processing Integration and Dissemination of Statistics
Pengolah Data/
Data Processing
:
Dian Kartika Sari, SST, M.Si
Maharani, SST
Lilis Nurul Husna, SST
Gambar Kulit/
Cover Designer
:
Karno, ST
Diterbitkan oleh/
Published by
:
Badan Pusat Statistik Kota Batam
Central Board of Statistics of Batam City
Arti Lambang Kota Batam :
1.
Bintang,
melambangkan masyarakat Batam yang religius dan
Ketuhanan Yang Maha Esa.
2.
Keris Melayu,
lambang keperkasaan dan kepahlawanan Laksamana
Hang Nadim yang dapat dijadikan contoh bagi masyarakat. Lambang
kebenaran berdasarkan Ketuhanan Yang Maha Esa.
3.
Gelombang berjumlah lima lapis,
berarti bekerja atau bekerjanya
masyarakat Kota Batam dengan dasar Pancasila, letak geografis Batam
yang dikelilingi oleh laut yang berarti juga bahwa Laksamana Hang
Nadim berkuasa di daratan dan lautan.
4.
Perahu Dendang,
yaitu perahu dalam bentuk lambang keperkasaan di
laut dan penguasa wilayah.
5.
Jembatan Barelang,
lambang kegiatan pembangunan Kota Batam
yang menjembatani kemajuan perdagangan, industri, pariwisata dan alih
kapal.
6.
Pita berwarna merah dan tulisan Kota Batam,
berarti siap
menghadapi/memasuki era baru alap/millennium III dan kemajuan
zaman.
7.
Rantai,
berjumlah 45 melambangkan semangat persatuan/persaudaraan
antar masyarakat Kota Batam yang heterogen.
Arti Warna Lambang Daerah
a.
Warna Utama
1.
Merah,
berarti keberanian
2.
Kuning,
berarti keagungan
3.
Hijau,
berarti kesuburan dan kemakmuran
b.
Warna Pendukung
1.
Hitam,
berarti keabadian
2.
Putih,
berarti kesucian
Batam In Figures 2014 v Periode Tahun 2011-2016
WALIKOTA BATAM
SEKAPUR SIRIH
Dengan semakin meningkatnya berbagai kegiatan pembangunan Kota Batam dewasa ini, maka publikasi data statistik Kota Batam sangat diperlukan guna menyajikan berbagai informasi mengenai hasil-hasil pembangunan yang telah dicapai selama ini kepada semua pihak baik kalangan pemerintah, pihak swasta maupun masyarakat umum.
Saya mengharapkan dengan telah dipublikasikannya “BATAM
DALAM ANGKA” ini dapat dijadikan sebagai sumber data utama dalam memenuhi kebutuhan berbagai pihak mengenai Kota Batam terutama dalam merumuskan kebijaksanaan, pengawasan dan evaluasi terhadap hasil-hasil pembangunan yang telah dicapai serta untuk kepentingan penelitian dan pengembangan.
Akhirnya, saya mengucapkan terima kasih kepada seluruh pihak yang telah berpartisipasi dalam penerbitan buku ini, mudah-mudahan buku ini dapat bermanfaat bagi kita semua. Semoga Allah S.W.T dapat membimbing langkah-langkah kita ke jalan yang benar serta melimpahkan rahmat dan karunia-Nya kepada kita semua.
Batam, Agustus 2014
Batam In Figures 2014 vii
THE MAYOR OF BATAM CITY
FOREWORD
By increasing in the number of various development activities in the City of Batam recently, it is essential to have reliable and accurate statistical data as a main source of public information in conjunction with the progress of development currently achieved for all parties including governmental institutions, private sectors and community.
I hope that the publication of “BATAM IN FIGURES” can be the main source concerning with the statistical data of Batam City in formulating the policy of development, controlling and evaluating the results of development also research and development
Finally, I want to thank to all parties who have participated in the making of this book. And I do hope this publication will be useful for all of us. May God guides us to the true path and gives his blesses in every side of our life.
Batam, August 2014
KATA PENGANTAR
Dengan memanjatkan puji syukur kehadirat Tuhan Yang Maha Esa, Badan Pusat Statistik Kota Batam telah dapat menyelesaikan penyusunan Publikasi Kota Batam Dalam Angka Tahun 2014(BDA 2014) sesuai jadwal. Penerbitan ini dapat terwujud tidak terlepas dari adanya dukungan moril dan materiil dari Pemerintah Daerah Kota Batam.
Pada saat ini kebutuhan akan data statistik dari setiap sektor pembangunan, semakin dirasakan. Hal ini memotivasi BPS Kota Batam untuk terus melengkapi dan menyempurnakan data yang disajikan baik dari sisi kuantitas maupun kualitasnya. Data yang disajikan bersumber dari kegiatan rutin, survei dan sensus yang dilaksanakan oleh Badan Pusat Statistik Kota Batam, dan dilengkapi dengan data sekunder yang dikelola oleh Instansi pemerintah dan swasta di wilayah Kota Batam. Secara garis besar, publikasi ini memuat informasi statistik tentang kondisi geografis, pemerintah, kependudukan, ketenagakerjaan, pertanian, industri, pertambangan, air minum, listrik, perhubungan dan komunikasi, keuangan dan perbankan, perdagangan, produk domestik regional bruto dan lain-lain. Publikasi ini diharapkan mampu mendukung ketersediaan data statistik sebagai bahan perencanaan dan evaluasi.
Saran dan kritik dari berbagai pihak dalam rangka perbaikan publikasi ini di masa mendatang, sangat kami harapkan. Akhirnya, harapan kami semoga penyajian publikasi ini mampu mendukung data statistic sebagai bahan perencanaan dan evaluasi, baik untuk instansi pemerintah maupun swasta, serta bermanfaat bagi para pengguna data lainnya.
Batam, Agustus 2014
KEPALA BADAN PUSAT STATISTIK KOTA BATAM
Drs. MANGAMPUTUA NIP. 19660926 199212 1 001
Batam In Figures 2014 ix
P R E F A C E
Praise be to God, BPS-Statistics of Batam Municipality has successfully published Batam in Figures 2014 in time. The publication is made possible due to the support of the Government of Batam Municipality either materially or morally.
It is much more realized now that the demand for statistics from all sectors has increased. This fact encourages us to fulfill and complete the data both in terms of quantity as well as of quality. The data presented are primarily compiled from routine activities, surveys and censuses conducted by BPS-Statistics of Batam Municipality . However, the secondary-data sources complied by public and private institutions in Kepulauan Riau, are also utilized. In brief, the publication contains statistical information on geographic condition, government, population, manpower, agriculture, manufacturing, mining, energy, water supply, electricity, transportation and communication, finance and banking, trading, gross regional domestic product, etc. Hence, all of data become powerful ingredients for development plan inter and intra sector in Kepulauan Riau.
Any suggestions and criticisms to improve this publication will be cordially welcome. Last but not least, I hope this publication is able to fulfill the demand for statistical data of the public and private institutions. Moreover, this could be useful and valuable source to other data users.
Batam, August 2014
HEAD OF BATAM CENTRAL BOARD OF STATISTICS
Drs. MANGAMPUTUA NIP. 19660926 199212 1 001
Halaman
Page
Peta Kota Batam
/
Map of Batam City
...
i
Lambang Kota Batam/
Batam City Symbol
...
ii
Foto Walikota Batam/
Photograph of The Mayor of Batam City
...
v
Kata Sambutan Walikota Batam/
Foreword of The Mayor of
Batam City
...
vi
Kata Pengantar Kepala Badan Pusat Statistik Kota Batam
/
Preface of Director of The BPS-Statistic of Batam City
...
ix
Daftar Isi/
Contents ...
xi
Daftar Tabel/
List of Tables ...
xiii
Daftar Grafik
/
List of Graphics
...
xl
Visi-Misi /
Vision-Mision ...
xlii
Sejarah Ringkas/
Brief History ...
1
Bab I. Geografi dan Iklim /
Geography and Climate ...
9
Bab II. Pemerintahan /
Government ...
23
Bab III. Penduduk dan Tenaga Kerja
……… ....
53
Populations and Labours
Bab IV. Sosial /
Social ...
83
xii Batam Dalam Angka 2014
Industry, Electricity and Clean Water
Bab VII. Perdagangan /
Trade ...
187
Bab VIII. Transportasi & Komunikasi
... ... 195
Transportation & Communication
Bab IX. Keuangan dan harga-harga
………. ... 233
Finance and Price
Bab X. Pendapatan Regional
……….. .... 265
Halaman
Page
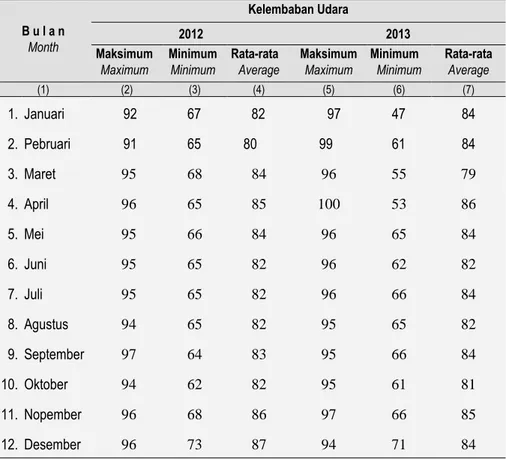
Tabel. 1.1.
Kelembaban Udara di Kota Batam Dirinci
Setiap Bulannya 2011-2013
Humidity of Atmosphere in Batam City each month
2011- 2013 ... 11
Tabel. 1.2.
Tekanan Udara di Kota Batam Dirinci Setiap
Bulan(mb), 2011-2013
Atmosphere Pressure in Batam City Each
month(mb), 2011-2013 ... 12
Tabel. 1.3.
Arah dan Kecepatan Angin di Kota Batam
Dirinci Setiap Bulan(knot), 2011-2013
Wind Velocity in Batam City Each Month,
2011-2013 ... 13
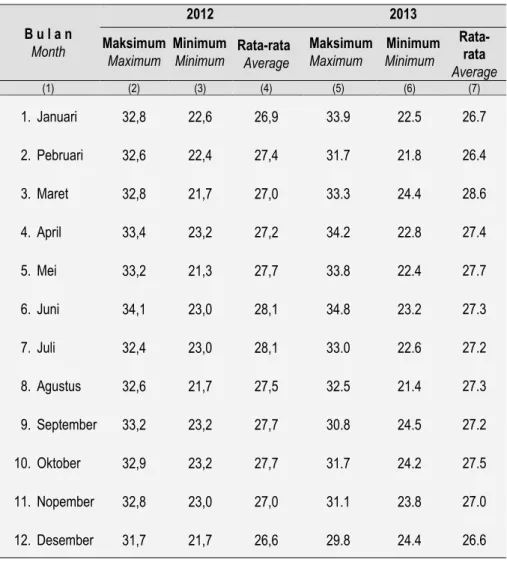
Tabel. 1.4.
Temperatur Udara di Kota Batam Dirinci Setiap
Bulan(
oC), 2011-2013
Mean Temperature in Batam City Each Month(
oC) ,
2011-2013 ... 14
Tabel. 1.5.
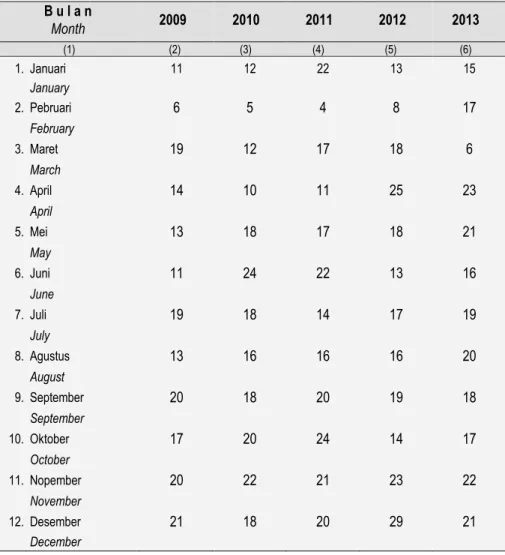
Banyaknya Hari Hujan di Kota Batam Dirinci
Setiap Bulan(mm), 2008-2013
Number of Raindays in Batam City Each Month(mm),
2001 -2013 ... 15
Tabel. 1.6.
Banyaknya Curah Hujan di Kota Batam Dirinci
Setiap Bulan(mm), 2008-2013
Amounth of Rainfall in Batam City Each Month,
2008-2013 ... 16
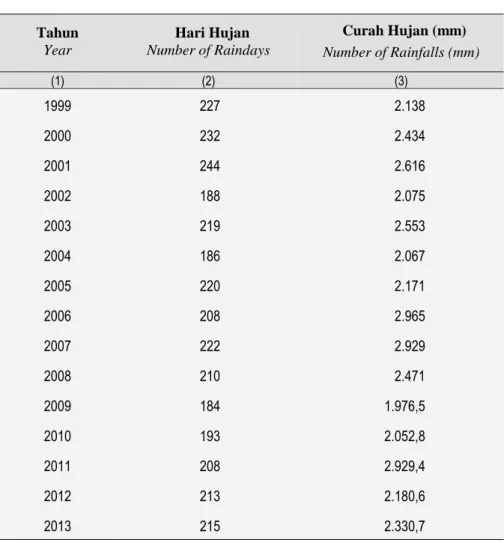
Tabel. 1.7.
Jumlah Hari Hujan dan Curah Hujan di Kota
Batam, 1998-2013
Number of Raindays and Rainfalls in Batam City,
1998 – 2013 ... 17
xiv Batam Dalam Angka 2014
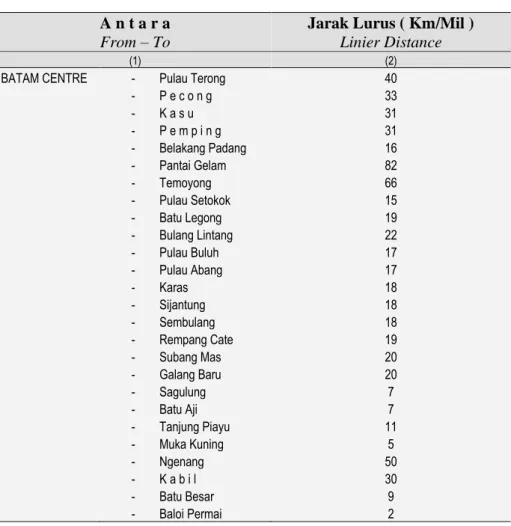
Tabel. 1.8.
Jarak Antara Ibukota Kota Batam Dengan
Kecamatan dan Kelurahan/Desa, 2013
The Distance from Batam City to Districts and
Kelurahan/Vilages, 2013 ... 18
Tabel. 1.9.
Tinggi Ibu Kota Batam dan Kecamatan di Kota
Batam dari Permukaan Laut, 2013
Altitude of Batam City and Districts in Batam City,
20131 ...
20
Tabel. 1.10.
Nama-Nama Sungai di Batam, 2013
Rivers on Batam, 2013 ... 21
Tabel. 2.1.
Nama-Nama Pejabat di Lingkungan Pemerintah
Kota Batam, s/d Agustus 2013
The Official who work in The Regional Government
of Batam City, s/d August 2013 ... 29
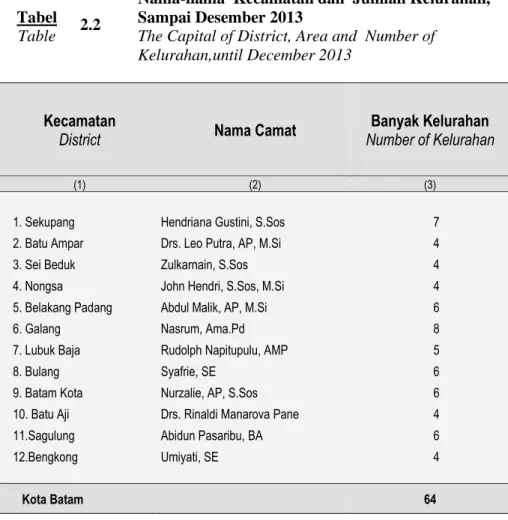
Tabel. 2.2.
Kecamatan, Camat dan Jumlah Kelurahan, di
Kota Batam Kondisi Tahun 2013
The Capital of District, Area and Number of
Kelurahan, 2013 ... 32
Tabel. 2.3.
Luas Wilayah Kecamatan dan Kelurahan di
Kota Batam, 2013
Wide of Region District and Village in Batam City,
2013 ... 33
Tabel. 2.4.
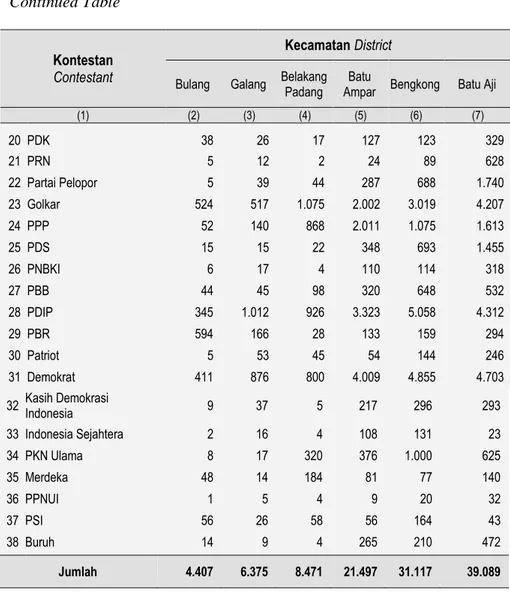
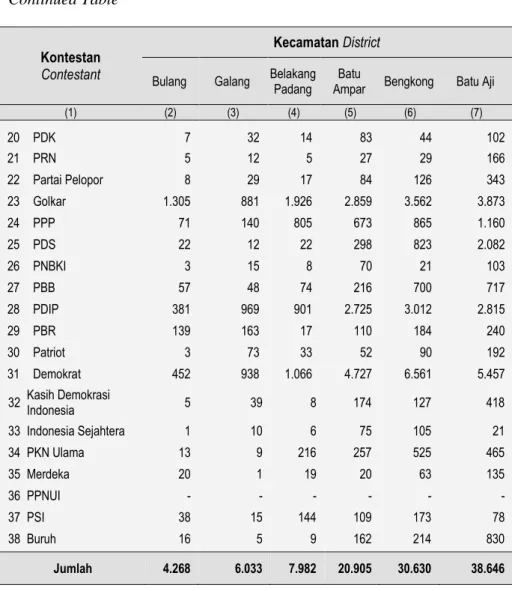
Hasil Perolehan Suara untuk DPRD Kota Batam
Pada Pemilu, 2009
Result of Valid Votes on General Election 2009 For
Batam Municipal Legislative Assembly ... 36
Tabel. 2.5.
Hasil Perolehan Suara untuk DPRD Propinsi
Kepri pada Pemilu, 2009
Result of Valid Votes on General Election 2009 For
Assembly at Provincial of Kepri ... 40
Tabel. 2.6.
Hasil Perolehan Suara Pemilu 2009 Untuk DPR
Pusat
Result of Valid Votes on General Election 2009 For
Indonesian Legislative Assembly ... 44
Tabel. 2.7.
Hasil Perolehan Suara Pemilu 2009 Dewan
Perwakilan Daerah (DPD)
Result of Valid Votes on General Election 2009 For
Assembly at Region ... 48
Tabel. 2.8.
Hasil Perolehan Suara Pilkada Gubernur dan
Wakil Gubernur Propinsi Kepulauan Riau
Tahun 2010
Result of Valid Votes on Regional General
Electionof Governor and Vice Governor of
Kepulauan Riau Province, 2010 ... 50
Tabel. 2.9.
Hasil Perolehan Suara Pilkada Walikota Batam
dan Wakil Walikota Batam, 2005
Result of Valid Votes on Regional General
Electionof Major and Vice Major of Batam, 2005 ... 50
Tabel. 2.10.
Hasil Perolehan Suara Sah Pasangan Calon
Presiden dan Wakil Presiden, 2009
Result of Valid Votes on Election of President and
Vice President, 2009 ... 51
Tabel. 3.1.1.
Penduduk WNI Per Wilayah dan Jenis Kelamin
di Kota Batam, 2013
Number of Indonesian Citizen by Region And Sex,
2013
... 57
Tabel. 3.1.2.
Penduduk WNI Dirinci Menurut Jenis Kelamin
di Kota Batam 1996-2013
Number of Indonesian Citizen by Sexin Batam City,
1996-2013 ... 61
xvi Batam Dalam Angka 2014
Tabel. 3.1.3.
Penduduk WNI Kota Batam Menurut Rasio
Jenis Kelamin, 1997-2013
Number of Indonesian Citizen IN Batam City by Sex
Ratio, 1997-2013
...
62
Tabel. 3.1.4.
Penduduk Dirinci Menurut Kecamatan dan Jenis
Kelamin Berdasarkan Sensus Penduduk 2010
Population by District and Sex Based on 2010
Population Census
...
63
Tabel. 3.1.5.
Penduduk Kota Batam Hasil Sensus Penduduk
2010 Menurut Kelurahan dan Jenis Kelamin
Population by Region and Sex Based on 2010
Population Census ... 64
Tabel. 3.1.6.
Pengelolaan Rumah Susun Di Kota Batam, 2013
Management of The Mansions in Batam City, 2013 ... 67
Tabel. 3.2.1.
Pegawai Negeri Sipil di Lingkungan Pemerintah
Kota Batam Menurut Unit Kerja dan Golongan,
s/d Desember 2013
Number of Civil Servant Administered by The
Regional Government of Batam City by Unit of
Work and Rank, until August 2013 ... 68
Tabel. 3.2.2.
Pegawai Negeri Sipil Pusat di Kota Batam yang
Gajinya Dibayarkan Melalui KPKN Batam
Menurut Lembaga/Departemen, 2009-2013
Number of Central Government Civil Servant who
Paid their Salary by KPKN Batam by Institution,
2009-2013 ... 70
Tabel. 3.2.3.
Pencari Kerja yang Terdaftar Pada Dinas
Tenaga Kerja Kota Batam Menurut Tingkat
Pendidikan, 2010-2013
Number of Registered Job Seekers at Man Power
Service of Batam City, 2010-2013 ... 71
Dinas Tenaga Kerja Kota Batam Per Jenis
Kelamin dan Kelompok Umur, 1998-2013
Number of Registered Job Seekers, at Man Power
Service of Batam City by Sex and Age
Group,1998-2013
...
72
Tabel. 3.2.5.
Pencari Kerja yang Terdaftar Pada Dinas
Tenaga Kerja Kota Batam Per Jenis Kelamin
dan Tingkat Pendidikan, 2013
Number of Registered Job Seekers at Man Power
Service of Batam City by Sex and Educational
Attainment, 2013 ... 73
Tabel. 3.2.6.
Penempatan Tenaga Kerja di Dinas Tenaga
Kerja Kota Batam Per Jenis Kelamin Setiap
Bulan, 2013
Number of Register, Placement and Vacancy at Man
Power Service of Batam City per Month, 2013 ... 75
Tabel. 3.2.7.
Situasi Pencari Kerja yang Terdaftar pada Dinas
Tenaga Kerja Kota Batam Per Jenis Kelamin
dan Tingkat Pendidikan, 2013
The Situation of Registered Job Seekers at Man
Power Serviceof Batam City by Sex and Education,
2013 ... 76
Tabel. 3.2.8.
Rekapitulasi Keadaan Tenaga Kerja Asing
(TKA), 2012
Number of Foreign Employmen Each Montht, 2013 ... 77
Tabel. 3.2.9.
Nilai Rata-rata Kebutuhan Hidup Minimum
Pekerja Lajang Per Bulan , 2008-2013
Average Value of Minimum Physical Need of Single
Worker by Month, 2008-2013 ... 78
Tabel. 3.2.10.
Tenaga Kerja WNI dan WNA di Kota Batam
menurut Sektor Ekonomi, 2013
Number of Indonesian and Foreign Workers in
Batam City by Economic Sector, 2013 ... 79
xviii Batam Dalam Angka 2014
Tabel. 3.2.11.
Perusahaan dan Tenaga Kerja Menurut Jenis
Usaha di Kota Batam Tahun 2012
Number of Indonesian and Foreign Workers in
Batam City by Economic Sector, 2013
... 79
Tabel. 3.2.12.
Perusahaan Berdasarkan Status Permodalan
Tahun 2012
...
80
Number on Enterprise by Capital, 2013
Tabel. 3.2.13.
Peselisihan Hubungan Industrial, 2010-2012
... 81
Tabel. 3.2.14.
Keadaan Perusahaan di Kota Batam, 2009-2012
Description of Enterprises in Batam City,
2009-2012 ... 82
Tabel. 4.1.1.
Jumlah
Sekolah
di
Lingkungan
Dinas
Pendidikan menurut Kecamatan dan Jenis
Sekolah (Negeri+Swasta), 2013
Number of Schools Administered by the Education
Service,
District
and
Type
of
School
(Private+Private), 2013 ... 89
Tabel. 4.1.2.
Jumlah
Sekolah
Di
Lingkungan
Dinas
Pendidikan
Menurut
Jenis
Sekolah
(Negeri+Swasta), 2010–2013
Number of Schools Administered by the Education
Service by Type of School (Public+Private), 2010 –
2013 ... 90
Tabel. 4.1.3.
Jumlah
Rombel
dan
Kelas
Sekolah
Di
Lingkungan Dinas Pendidikan Per Kecamatan
dan Jenis Sekolah (Negeri + Swasta), 2013
Number of Schools and Classrooms Administered by
the Education Service by Type of School and
District (Publict+Private), 2013 ... 92
Tabel. 4.1.4.
Jumlah Rombel dan Kelas Sekolah Dalam
Lingkungan Dinas Pendidikan Per Jenis Sekolah
(Negeri+Swasta), 2010-2013
Number of Schools and Classrooms Administered by
the Education Service by Type of School (Public +
Private), 2010- 2013 ... 92
Tabel. 4.1.5.
Jumlah Murid Sekolah dalam Lingkungan Dinas
Pendidikan Per Kecamatan dan Jenis Sekolah
(Negeri+Swasta), 2013
Number of Pupil Administered by the Education
Service by District and Type of School
(Public+Private), 2013 ... 93
Tabel. 4.1.6.
Jumlah Murid Sekolah Dalam Lingkungan
Dinas
Pendidikan
Per
Jenis
Sekolah
(Negeri+Swasta), 2010– 2013
Number of Pupil Administered by the Education
Service by Type of School (Public+Private), 2010–
2013 ... 94
Tabel. 4.1.7.
Jumlah Guru Sekolah dalam Lingkungan Dinas
Pendidikan Per Kecamatan dan Jenis Sekolah
(Negeri+Swasta), 2013
Number of Teachers Administered by the Education
Service by District and Type of School
(Public+Private), 2013 ... 95
Tabel. 4.1.8.
Jumlah Guru Sekolah dalam Lingkungan Dinas
Pendidikan Per Jenis Sekolah (Negeri+Swasta),
2010-2013
Number of Teachers Administered by the Education
Service by Type of School (Public+Private), 2010 –
2013 ... 96
Tabel. 4.1.9.
Data Jumlah Peserta Ujian Akhir Nasional dan
Jumlah Lulusan Menurut Kecamatan Tahun
2011/2013
xx Batam Dalam Angka 2014
Tabel. 4.1.10.
Perkembangan Angka Partisipasi Kasar (APK),
2007 – 2013
Gross Participated on Education
, 2007–2013 ...
98
Tabel. 4.1.11.
Perkembangan Angka Partisipasi Murni (APM),
2007 – 2013
Nett Participated on Education, 2007 – 2013 ... 99
Tabel. 4.1.12.
Jumlah Sekolah di Luar Lingkungan Dinas
Pendidikan Menurut Kecamatan, Jenis dan
Status Sekolah, 2012
Number of Schools Administered by Non Education
Service By District, Type and Status of School, 2012 ... 100
Tabel. 4.1.13.
Jumlah Sekolah di Luar Lingkungan Dinas
Pendidikan Jenis dan Status Sekolah, 2010– 2012
Number of Schools Administered by Non Education
Service By Type and Status of School, 2010–2012 ... 101
Tabel. 4.1.14.
Jumlah Lokal dan Kelas Sekolah di Luar
Lingkungan
Dinas
Pendidikan
Menurut
Kecamatan dan Jenis Sekolah, 2012
Number of Classes and Classrooms Administered by
Non Education Service by District and Type of
School, 2012 ... 102
Tabel. 4.1.15.
Jumlah Lokal dan Kelas Sekolah di Luar
Lingkungan Dinas Pendidikan Menurut Jenis
Sekolah, 2010–2012
Number of Classes and Classrooms Administered by
Non Education Service by Type of School, 2010 –
2012 ... 104
Tabel. 4.1.16.
Jumlah Guru Sekolah di Luar Lingkungan Dinas
Pendidikan Nasional Menurut Kecamatan, Jenis
dan Status Sekolah, 2012
Number of Teachers Administered by Non
Education Service by Type and Status of School per
District, 2012 ... 105
Tabel. 4.1.17.
Jumlah Guru Sekolah di Luar Lingkungan Dinas
Pendidikan Menurut Jenis dan Status Sekolah,
2010–2012
Number of Teachers Administered by Non
Education Service by Type and Status of School per
District, 2010-2012 ... 107
Tabel. 4.1.18.
Jumlah Murid Sekolah di Luar Lingkungan
Dinas Pendidikan Menurut Kecamatan, Jenis
dan Status Sekolah, 2013
Number of Pupils Administered by Non Education
Service by Type and Status of School per District,
2013 ... 108
Tabel. 4.1.19.
Jumlah Murid Sekolah di Luar Lingkungan
Dinas Pendidikan Menurut Jenis dan Status
Sekolah, 2010–2012
Number of Pupils Administered by Non Education
Service and by Type and Status of School, 2010
-2013 ... 110
Tabel. 4.2.1.
Jumlah Sarana Kesehatan Menurut Jenisnya,
2012
Number of Health Facilities by Type, 2012 ... 111
Tabel. 4.2.2.
Jumlah Sarana Kesehatan Menurut Kecamatan,
2013
Number of Health Facilities by Distrct, 2012 ... 112
Tabel. 4.2.3.
Jumlah Apotik, Pedagang Besar Farmasi dan
Toko Obat Menurut Kecamatan, 2012
xxii Batam Dalam Angka 2014
Tabel. 4.2.4.
Jumlah Kunjungan Bayi dan Anak Umur 1-4
Tahun ke Puskesmas Menurut Kecamatan, 2012
Number of Infant and Kid 1 - 4 Years Visit to Public
Health Center by District, 2012... 114
Tabel. 4.2.5.
Jumlah Penderita dan Kematian dari Penyakit
Demam Berdarah Setiap Bulan, 2010 – 2013
Number of Sufferers and Deaths Suffered from
Blood Fever, 2010 – 2012 ... 115
Tabel. 4.2.6.
Jumlah Penderita dari Penyakit Klinis Malaria
di Puskesmas per Bulan menurut Kecamatan,
2012
Number of Sufferer Suffered from
Feverish in Public
Health Centre per month by District, 2012 ... 116
Tabel. 4.2.7.
Jumlah Akseptor Aktif Menurut Kecamatan dan
Alat Kontrasepsi, 2013
Number of Active Acceptors by District and
Contraception Method, 2013 ... 118
Tabel. 4.2.8.
Jumlah Akseptor Baru Menurut Kecamatan dan
Alat Kontrasepsi, 2013
Number of New Acceptors by District and
Contraception Method, 2013 ... 119
Tabel. 4.3.1.
Jumlah Kejahatan yang Terjadi, 2013
Number of Crimes, 2013 ... 120
Tabel. 4.3.2.
Banyaknya Pelanggaran yang Terjadi Serta
Denda Perkara Tilang Dirinci Setiap Bulan,
2011–2013
Number of Traffic Offenses and Fine Received Each
Month, 2011–2013 ... 122
Tabel. 4.3.3.
Jumlah Pelanggaran Lalu Lintas di Wilayah
Polatabes Barelang, 2013
Tabel. 4.3.4.
Jumlah Kecelakaan Lalu-Lintas yang Terjadi
Setiap Bulan, 2013
Number of Traffic Accident Each
Month,
2013
...
124
Tabel. 4.3.5.
Jumlah
Perkara
Selama
Bulan
Januari-
Desember 2013
Number of Cases and Defendant from January to
December 2013 ... 125
Tabel. 4.3.6.
Jumlah Perkara dan Terdakwa Pelanggaraan
Selama Bulan Januari s.d. Desember, 2013
Number of Criminal Cases and Defendeant from
January to December, 2013
...
127
Tabel. 4.3.7.
Jumlah Putusan Pengadilan Negeri Batam
menurut Jenis Hukuman Setiap Bulan, 2013
Number of Court Decession by Type of Sentence
Each Month, 2013 ... 128
Tabel. 4.3.8.
Jumlah Tertuduh yang Mendapatkan Putusan
Pengadilan
Negeri
Batam
menurut
Jenis
Kelamin dan Status Pekerjaan, 2009
Number of Defendant Charged at the State Court of
Batam by Sex and Status, 2009 ... 129
Tabel. 4.3.9.
Jumlah
Perkara
dan
Terdakwa
yang
Diselesaikan Pengadilan Negeri Batam Menurut
Jenis Penyelesaian dan Bulan Putusan, 2009
Number of Defendant Charged at the State Court
Each Month, 2009 ... 130
Tabel. 4.3.10.
Jumlah Perkara Pidana di Pengadilan Negeri
Batam, 2013
Crime in Court of Batam,
2013 ...
131
Tabel. 4.3.11.
Jumlah Perkara Perdata di Pengadilan Negeri
Batam, 2013
xxiv Batam Dalam Angka 2014
Tabel. 4.4.1
Jumlah Tempat Peribadatan Per Kecamatan
menurut Jenisnya, 2012
Number of Religion Worship Facilities by District
and Type, 2012 ... 134
Tabel. 4.4.2
Jumlah Tempat Peribadatan Menurut Jenisnya,
1998-2012
Number of Religion Worship Facilities by Type,
1998-2012 ... 135
Tabel. 4.4.3
Jumlah Jemaah Haji yang Terdaftar dan
Berangkat menurut Kecamatan dan Jenis
Kelamin, 2012
Number of Hajji Pilgrims Registered and Departure
by District and Sex, 2012 ... 136
Tabel. 4.4.4
Jumlah Jemaah Haji yang Terdaftar dan
Berangkat menurut Jenis Kelamin, 2003-2012
by
Age Group and Sex, 2003-2012 ... 137
Tabel. 4.4.5
Jumlah Jemaah Haji yang Berangkat menurut
Kelompok Umur, 2010-2012
Number of Hajji Pilgrims Departure by Age Group,
2010-2012 ... 138
Tabel. 4.4.6
Jumlah Nikah, Thalak, Cerai dan Rujuk
menurut Kecamatan, 2013
Number of Marriage, Separations, Divorces and
Reconciliation, 2013 ... 139
Tabel. 4.4.7
Jumlah Nikah, Thalak, Cerai dan Rujuk yang
Terjadi, 1998-2013
Number of Marriage, Separations, Divorces and
Reconciliation, 1998-2013 ... 140
Tabel. 4.5.1
Jumlah Penyandang Masalah Kesejahteraan
Sosial (PMKS), 2012
Tabel. 5.1.1.
Jumlah Rumah Tangga dan Penduduk yang
Bekerja di Sektor Pertanian Tanaman Pangan
menurut Kecamatan, 2013
Number of Household and Population Who work at
Food Crops Sector by District, 2013 ... 147
Tabel. 5.1.2.
Luas Panen Tanaman Palawija menurut Jenis
Tanaman (ha), 2008–2013
Harvested Area of Second Crops by Type, 2008–
2013 ... 148
Tabel. 5.1.3.
Luas
Panen
Tanaman
Palawija
menurut
Kecamatan (ha), 2013
Harvested Area of Second Crops by District (ha),
2013 ... 149
Tabel. 5.1.4.
Produksi Panen Tanaman Palawija menurut
JenisTanaman (ton), 2009–2013
Production of Second Crops by Type of Crops,
2009–2013 ... 150
Tabel. 5.1.5.
Produksi
Tanaman
Palawija
menurut
Kecamatan (ton), 2013
Production of Second Crops by District, 2013 ... 151
Tabel. 5.1.6.
Luas Panen Tanaman Sayur-sayuran menurut
Jenis Tanaman, 2008–2013
Harvested Area of Vegetables by Type, 2008–2013 ... 152
Tabel. 5.1.7.
Luas Panen Tanaman Sayur-sayuran menurut
Jenis Tanaman dan Kecamatan (ha), 2013
Harvested Area of Vegetable by Type and District,
2013 ... 153
Tabel. 5.1.8.
Produksi Tanaman Sayur-Sayuran menurut
Jenis Tanaman dan Kecamatan (Ton), 2009-
2013
Production of Vegetable by Type (Ton), 2009- 2013 ... 154
Tabel. 5.1.9.
Produksi Tanaman Sayur-sayuran Menurut
xxvi Batam Dalam Angka 2014
Tabel. 5.1.10.
Luas Panen Tanaman Buah-buahan Menurut
Jenis Tanaman, 2009–2013
Harvested Area of Fruit by Type, 2009–2013 ... 156
Tabel. 5.1.11.
Luas Panen Tanaman Buah-buahan Menurut
Jenis Tanaman dan Kecamatan (Ha), 2013
Harvested Area of Fruit by Type and District (Ha),
2013 ... 159
Tabel. 5.1.12.
Produksi Tanaman Buah-buahan Menurut Jenis
Tanaman, 2009- 2013
Production of Fruit by Type, 2009- 2013 ... 161
Tabel. 5.1.13.
Produksi Tanaman Buah-buahan Menurut Jenis
Tanaman dan Kecamatan, 2013
Production of Fruit by Type and District, 2013 ... 162
Tabel. 5.2.1.
Banyaknya Rumah Tangga Perikanan Menurut
Kecamatan dan Jenis Kegiatan, 2013
Number of Fishery Household by Type and District,
2013 ... 164
Tabel. 5.2.2.
Banyaknya Rumah Tangga Perikanan Menurut
Jenis Kegiatan, 2008–2013
Number of Fishery Household by Type of Activity,
2008-2013 ... 165
Tabel. 5.2.3.
Produksi Perikanan Menurut Kecamatan (ton),
2013
Production of Fishery by District (ton) , 2013. ... 166
Tabel. 5.2.4.
Produksi Perikanan Menurut Jenisnya (ribuan
ton), 1999 – 2013
Production of Fishery by Type (Thousand of Ton),
1999 – 2013 ... 167
Tabel. 5.2.5.
Nilai Produksi Perikanan Menurut Kecamatan
(Rupiah), 2013
Tabel. 5.2.6.
Nilai Produksi Perikanan Menurut Jenisnya
(jutaan Rupiah), 1999 – 2013
Value Production of Fishery by Type (million
Rupiahs), 1999 – 2013 ... 169
Tabel. 5.2.7.
Jumlah Armada Tangkap Berdasarkan Gross
Tonase, 2013
Fisherman group by gross tonase, 2013 ... 170
Tabel. 5.2.8.
Jumlah RTP Usaha Budi Daya Perikanan Kota
Batam, 2013
Number of Fishery Household by district, 2013 ... 171
Tabel. 5.3.1
Luas Hutan dan Persentase Hutan Menurut
Fungsinya, 2013
Area and Percentage of Forest by Function, 2013 ... 172
Tabel. 5.3.2
Lokasi dan Hutan Lindung/Hutan Swasta di
Pulau Batam
... 173
Tabel. 6.1.1.
Jumlah Perusahaan dan Tenaga Kerja Sektor
Industri Pengolahan, 2010 – 2011
Number of Establishment and Person Engaged at
Manufacture Industry by Group and District 2010 –
2011 ... 179
Tabel. 6.1.2.
Jumlah Pekerja Pada Perusahaan Industri
Pengolahan menurut Sub Sektor, 2013
Number of Person Engaged at Manufacturing
Industry by Sub Sector,
2013 ...
180
Tabel. 6.2.1.
Jumlah Mesin, Kekuatan dan Tenaga yang
dibangkitkan
Pemakaian
Sendiri,
Susut,
Pemakaian Bahan Bakar dan Pemakaian Minyak
Pelumas Pada PT. PLN Cabang Tanjung Pinang,
xxviii Batam Dalam Angka 2014
Generated,
Owned
Consumtion,
Reduction,
Consumtion Lubricant by State Electricity
Company,
2013 ...
181
Tabel. 6.2.2.
Perkembangan
Jumlah
Pelanggan,
Daya
Tersambung dan Jumlah Penjualan Listrik PLN
Wilayah Khusus Batam, 2008 – 2013
Development of the Amount of PT.PLN Operating
Earnings by Group of Subscribers, 2008-2013 ... 183
Tabel. 6.3.1.
Kapasitas Waduk di Kota Batam, 2013
Capacity of Water Reservoir at Batam City, 2013 ... 184
Tabel. 6.3.2.
Jumlah dan Nilai Air Minum yang Disalurkan
ATB, 2010-2013
Number and Value of Water Supply Distributed by
ATB, 2010-2013 ... 185
Tabel. 7.1.
Ekspor Kota Batam Menurut Pelabuhan Muat,
2011 – 2013
Export of Batam City by Port, 2011 – 2013 ... 189
Tabel. 7.2.
Ekspor Kota Batam Menurut Negara Tujuan
Utama, 2013
Export of Batam City by Destination Important
Country,
2013 ...
190
Tabel. 7.3.
Volume dan Nilai Ekspor Kota Batam Menurut
Golongan Barang HS 2 Digit, 2013
Export of Batam City by Commodity Group HS 2
Digit, 2013 ... 191
Tabel. 7.4.
Import
Kota
Batam
Menurut
Pelabuhan
Bongkar, 2013
Tabel. 7.5.
Import Kota Batam Menurut Asal Negara
Utama, 2013
Export of Batam City by Origin Important Country,
2013
...
193
Tabel. 7.6.
Volume dan Nilai Import Kota Batam Menurut
Komoditi Utama, 2013
Value and Volume of Export Batam City by
Important Commodity, 2013 ... 194
Tabel. 8.1.1.
Panjang Jalan Menurut Jenis Permukaan (km),
1995 – 2013
Length of Road by Type of Surface (km), 1995-2013 ... 199
Tabel. 8.1.2.
Panjang jalan menurut Kondisi Jalan (km),
1995-2013
Length of Road by Condition (km), 1995– 2013 ... 200
Tabel. 8.1.3.
Panjang jalan menurut Kelas Jalan, 1995–2013
(km)
Length of Road by Class, 1995 – 2013 (km) ... 201
Tabel. 8.1.4.
Jembatan-Jembatan di Barelang
Barelang Bridges ... 202
Tabel. 8.1.5.
Banyaknya Kendaraan Bermotor Yang Wajib
Uji Menurut Jenis Kendaraan Tahun 2008-2013
Number of Vehicles Compulsory Tested by Type
Vehicle, 2008–2013 ... 203
Tabel. 8.2.1.
Lalu Lintas Kapal, Barang Dan Penumpang
Antar Pulau (Interinsulir) Pada Pelabuhan Laut,
2001–2013
Ship Traffic, Goods and Passenger Interinsuler via
Seaport, 2001 – 2013 ... 204
Tabel. 8.2.2.
Lalu Lintas Kapal, Barang Dan Penumpang
xxx Batam Dalam Angka 2014
Tabel. 8.2.3.
Lalu Lintas Kapal, Barang dan Penumpang pada
Pelabuhan Laut, 2001 – 2013
Ship Traffic, Goods and Passenger via Seaport,
2001 – 2013 ... 205
Tabel. 8.2.4.
Fasilitas Pelabuhan Laut Kota Batam
Seaport Facilities in Batam City ... 206
Tabel. 8.3.1.
Pesawat Udara yang Datang dan Berangkat
Serta Penumpang Melalui Bandara Hang Nadim,
2013
Number of Aircrafts and Passengers Arrival and
Departure via Hang Nadim Airport
,
2013
... 207
Tabel. 8.3.2.
Pesawat Udara yang Datang dan Berangkat
Serta Penumpang melalui Bandara Hang Nadim,
1998-2013
Number of Aircrafts and Passengers Arrival and
Departure via Hang Nadim Airport, 1998-2013 ... 208
Tabel. 8.3.3.
Barang, Bagasi dan Pos Paket yang Dibongkar
dan Dimuat Melalui Bandara Hang Nadim, 2013
Number of Loaded and Loaded Freight, Baggage
and Parcel via Hang Nadim Airport, 2013 ... 209
Tabel. 8.3.4.
Barang, Bagasi dan Pos Paket yang Dibongkar
dan Dimuat Melalui Bandara Hang Nadim, 1998
– 2013
Number of Loaded and Loaded Freight, Baggage
and Parcel via Hang Nadim Airport, 1998 – 2013 ... 210
Tabel. 8.3.5.
Fasilitas Bandara Hang Nadim
Hang Nadim Airport Fasilities ... 211
Tabel. 8.4.1.
Uang yang Dikirim Keluar Batam Melalui
Weselpos Dalam Negeri Setiap Bulan, 2013
PT.Posindo Each Month, 2013 ... 212
Tabel. 8.4.2.
Uang yang Diterima oleh Masyarakat Batam
Melalui Weselpos Dalam Negeri Setiap Bulan,
2013
Number of Postal Money Order Paid at PT.Posindo
Each Month, 2013 ... 213
Tabel. 8.4.3.
Uang yang Dikirim Keluar Batam Melalui
Weselpos Luar Negeri (Western Union) Setiap
Bulan, 2013
Number of Postal Money Order Received at
PT.Posindo Each Month, 2013 ... 214
Tabel. 8.4.4.
Uang yang Diterima oleh Masyarakat Batam
Melalui Weselpos Luar Negeri (Western Union)
Setiap Bulan, 2013
Number of Postal Money Order Paid at PT.Posindo
Each Month, 2013 ... 215
Tabel. 8.4.5.
Surat Pos yang Dikirimkan Melalui PT. POS
Indonesia Setiap Bulan, 2013
Number of Letters Sent at PT.Posindo Each Month,
2013 ... 216
Tabel. 8.4.6.
Surat Pos yang Diterima Melalui PT. POS
Indonesia Setiap Bulan, 2013
Number of Letters Received at PT.Posindo Each
Month, 2013
... 217
Tabel. 8.4.7.
Paket Pos yang Dikirim Melalui PT. Pos
Indonesia Setiap Bulan, 2013
Number of Parcels Post Sent by PT. Posindo Each
Month, 2013 ... 218
xxxii Batam Dalam Angka 2014
Number of Parcels Post Received by PT. Posindo
Each Month, 2013... 219
Tabel. 8.5.1.
Penumpang
yang
Datang
menurut
Kewarganegaraan Setiap Bulan, 2013
Number of Passengers Arrival by Citizenship Each
Month, 2013 ... 220
Tabel. 8.5.2.
Banyaknya
Penumpang
yang
Berangkat
Menurut Kewarganegaraan Setiap Bulan, 2013
Number of Passengers Departure by Citizenship
Each Month, 2013... 221
Tabel. 8.5.3.
Jumlah Wisman yang Berkunjung ke Pulau
Batam Menurut Kebangsaan, 2010-2013
Number of Foreign Countries Visit to Batam Island
by Nation, 2010-2013 ... 222
Tabel. 8.5.4.
Jumlah Wisman yang Berkunjung ke Pulau
Batam Menurut Kebangsaan,
Semester I 2013
Number of Foreign Countries Visit to Batam Island
by Nation, Semester I 2013 ... 223
Tabel. 8.5.5.
Jumlah Wisman yang Berkunjung ke Indonesia
Melalui 3 Pintu Masuk, 2011-2013
Number of Foreign Countries Visit to Indonesia,
2011-2013 ... 224
Tabel. 8.5.6.
Jumlah Wisman yang Berkunjung ke Indonesia
Melalui Pintu Masuk Daerah di Provinsi
Kepulauan Riau, 2011-2013
Number of Foreign Countries Visit to Indonesia,
2011-2013 ... 225
Tabel. 8.6.1.
Hotel / Akomodasi, Kamar dan Tempat Tidur
yang Tersedia Serta Tenaga Kerja, 2003 – 2013
Number of Hotels/Accommodations, Room and Beds
and Employee, 2003-2013 ... 226
Tabel. 8.6.2.
Rata-Rata
Tingkat
Hunian
Kamar
Hotel
Berbintang dan Non Bintang di Batam ,
2008 – 2013
Occupancy Rate of Classified Hotel Rooms,
2008 – 2013 ... 227
Tabel. 8.6.3.
Tingkat Penghunian Kamar dan Tempat Tidur
Hotel Berbintang, 2013
Occupancy Rate of Classified Hotel Rooms and
Beds, 2013 ... 228
Tabel. 8.6.4.
Jumlah Tamu dan Persentase Tamu yang
Menginap Pada Hotel Berbintang, 2013
Number of Guests and Persentage of Stay at
Classified Hotel, 2013 ... 229
Tabel. 8.6.5.
Rata-rata Lama Tamu Menginap Pada Hotel
Berbintang, 2013
Average Length of Stay of Guest in Star Hotel, 2013 ... 230
Tabel. 8.6.6.
Tingkat Penghunian Kamar Hotel Berbintang
Menurut Klasifikasi Bintang, 2013
Occupancy Rate of Room of Classified Hotel by
Hotel Class, 2013 ... 231
Tabel. 9.1.1.
Bank dan Kantor Bank di Batam, 2013
Number of Bank and Bank Office in Batam, 2013 ... 237
Tabel. 9.1.2.
Dana dari Masyarakat Pada Bank-bank (Milyar
Rupiah), 1999 - 2013
Public Fund at Banks (Billion Rps), 1999– 2013... 238
Tabel. 9.1.3.
Dana dan Pinjaman dari Masyarakat Pada
Bank-Bank (Milyar Rupiah), 1999 - 2013
Number of Public Fund and Loan at Bank (Billion
Rps), 1999 – 2013 ... 239
xxxiv Batam Dalam Angka 2014
Kota Batam (Milyar Rupiah), 1999 - 2013
Number of Public Fund and Loan at Bank (Billion
Rps), 1999– 2013 ... 240
Tabel. 9.1.5.
Kredit Perbankan Menurut Sektor Ekonomi
(Milyar Rupiah), 2009 – 2013
Number of Bank Credits by Economic Sector
(Billion Rps), 2009 - 2013 ... 241
Tabel. 9.1.6.
Perkembangan Dana Menurut Wilayah di
Wilayah Riau Kepulauan (Milyar Rupiah),
Desember 2011 – Desember 2013
Number of Bank Credit by Region (Billion Rps),
December 2011 – December 2013 ... 242
Tabel. 9.1.7.
Perkembangan
Dana
Perbankan
Menurut
Bentuknya Riau Kepulauan (Milyar Rupiah),
Desember 2011 – Desember 2013
Growth of Bank fund by Type in Riau Kepulauan
(Billion Rps), December 2011 – December 2013 ... 242
Tabel. 9.1.8.
Perkembangan Kredit Perbankan Menurut
Wilayah Kab/Kota (Milyar Rupiah), Desember
20110 – Desember 2013
Growth of Bank credit by region
(Billion Rps)
,
December 2011 – December 2013 ... 243
Tabel. 9.1.9.
Perkembangan Kredit Perbankan Menurut Jenis
Penggunaan di Wilayah Kepulauan Riau (Milyar
Rupiah), Desember 2011 – Desember 2013
Growth of Bank credit by Type (Billion Rps),
December 2008 – December 2013 ... 243
Menurut
Jenis
Penggunaan
di
Wilayah
Kepulauan Riau (Milyar Rupiah)
,
Desember
2011 – Desember 2013
Growth of micro economy credit by kind (Billion
Rps) December 2011– December 2013 ... 244
Tabel. 9.1.11.
Perkembangan Kredit Perbankan Menurut
Sektor Ekonomi di Kepulauan Riau. Desember
2011– Desember 2013
Greowth of Bank Credit by Economic Sector in
Kepulauan Riau December
2013 – December 2013 ... 244
Tabel. 9.1.12.
Kurs Tengah Beberapa Mata Uang Asing
Terhadap Rupiah di Bank Indonesia, 1998– 2013
Selected Foreign Exchange Middle Against Rupiah
at Bank Indonesia, 1998– 2013 ... 245
Tabel. 9.2.1.
Banyaknya Koperasi Menurut Jenis Koperasi
dan Kecamatan, 2011
Number of Cooperative by Type and District, 2011 ... 246
Tabel. 9.2.2.
Banyaknya Koperasi, Modal, Aset Volume
Usahadan SHU per Desember di Kota Batam,
2010 – 2011
Number of Cooperative, Asset and Profit per
December in Batam City, 2010 – 2011 ... 247
Tabel. 9.3.1.
Jenis
Pendapatan,
Target
dan
Realisasi
Pendapatan Pemerintah Kota Batam, 2011
Target and Actual Receipt of Government of Batam
City, 2011 ... 248
Tabel. 9.3.2.
Realisasi Penerimaan BBN-KB dan PKB Dirinci
Per Bulan, 2011 (Ribuan Rupiah)
Actual Receipt of BBN-KB and PKB by Month, 2011
(Thousand Rps) ... 251
xxxvi Batam Dalam Angka 2014
Tabel. 9.3.3.
Realisasi Penerimaan PPh, PPN, PPN-BM dan
Pajak Lainnya Kota Batam (Millyar Rupiah),
2013
Actual Receipt of Income Tax, Value Added Tax and
Other Tax by Month (Billion Rps), 2013 ... 252
Tabel. 9.3.4.
Perkembangan Penerimaan Pajak PPh, PPN,
PPN-BM dan Pajak Lainnya Kota Batam
(Millyar Rupiah), 2010 - 2013
Growth of Income Tax, Value Added Tax and Other
Tax (Billion Rps), 2010 - 2013 ... 253
Tabel. 9.3.5.
Pengusaha/Perorangan yang Terkena Wajib
PBB dan Hasil Pungutan Menurut Kecamatan,
2013
Number of Tax Payers (Entrepreneur/person) of
Land and Building Tax and Value by Distric, 2013 ... 254
Tabel. 9.3.6.
Banyaknya Pengusaha/Perorangan yang Terkena
Wajib PBB dan Hasil Pungutan, 1999 – 2013
Number of Tax Payers (Entrepreneur/person) of
Land and Building Tax and Value , 1999 – 2013 ... 255
Tabel. 9.4.1.
Laju Inflasi Kota Batam per Bulan, 2010 –
September 2013
Inflation in Batam City , 2010 – September 2013 ... 256
Tabel. 9.4.2.
Laju Inflasi Kota Batam Menurut Komoditi,
2009 – 2013
Inflation in Batam City by Commodity, 2009 – 2013 ... 257
Tabel. 9.4.3.
Harga Eceran Beras, Tepung Beras dan Tepung
Terigu Dirinci Tiap Bulannya di Kota Batam,
2013
Average Growth Consumption Value/Expenditure
Per Household Per month in Batam City, 2013 ... 259
Bulan (Rp/Kg), 2013
Retail Price of Vegetables Each Month (Rps/Kg),
2013 ... 260
Tabel. 9.4.5.
Harga Eceran Buah-Buahan Dirinci Setiap
Bulan(Rp/Kg), 2013
Retail Price of Fruits Each Month (Rps/Kg), 2013 ... 262
Tabel. 9.4.6.
Harga Eceran Ikan/Udang Basah Dirinci Setiap
Bulan (Rp/Kg), 2013
Retail Price of Fresh Fish/Shrimp Each Month
(Rps/Kg), 2013 ... 263
Tabel. 9.4.7.
Perkembangan
Rata-rata
Nilai
Konsumsi/Pengeluaran Per Rumahtangga Per
Bulan Kota Batam (Rupiah), 2010 -2013
Average Growth Consumption Value/Expenditure
Per Household Per month in Batam City (Rupiahs),
2010 – 2013 ... 264
Tabel. 10.1.
Produk Domestik Regional Bruto (PDRB)
Atas Dasar Harga Berlaku Menurut Lapangan
Usaha di Kota Batam, 2010 – 2013
**Gross Regional Domestic Products (GRDP) at
Current Market Prices in Batam City by Industrial
Origin 2010 – 2013
**... 270
Tabel. 10.2.
Produk Domestik Regional Bruto (PDRB)
Atas Dasar Harga Konstan 2000 Menurut
Lapangan Usaha di Kota Batam, 2010 – 2013
**Gross Regional Domestic Products (GRDP) at
Constant Market Prices in Batam City by Industrial
Origin 2010 – 2013
**... 276
xxxviii Batam Dalam Angka 2014
Regional Bruto (PDRB) Atas Dasar Harga
Berlaku Menurut Lapangan Usaha di Kota
Batam, 2010 – 2013
**Percentage Distribution Gross Regional Domestic
Products (GRDP) at Current Market Prices in
Batam City by Industrial Origin, 2010 – 2013
**... 273
Tabel. 10.4.
Distribusi
Persentase
Produk
Domestik
Regional Bruto (PDRB) Atas Dasar Harga
Konstan 2000 Menurut Lapangan Usaha di
Kota Batam, 2010 – 2013
**Percentage Distribution Gross Regional Domestic
Products (GRDP) at Constant Prices in Batam
City by Industrial Origin, 2010 – 2013
**... 279
Tabel. 10.5.
Indeks Perkembangan PDRB Atas Dasar Harga
Berlaku Menurut Lapangan Usaha di Kota
Batam, 2010 – 2013
**Gross Regional Domestic Products (GRDP) at
Current Market Price in Batam City by ndustrial
Origin 2010 – 2013
**... 285
Tabel. 10.6.
Indeks Perkembangan PDRB Atas Dasar Harga
Konstan 2000 Menurut Lapangan Usaha di
Kota Batam, 2010 – 2013
**Gross Regional Domestic Products (GRDP) at
Constant Rate 2000 in Batam City by Industrial
Origin 2010 – 2013
**... 282
Tabel. 10.7.
Indeks Berantai PDRB Atas Dasar Harga
Berlaku Menurut Lapangan Usaha di Kota
Batam, 2010 – 20131
**Sequence Index of Batam City GRDP at Current
Market Prices by Industrial Origin 2010 – 2013
**... 285
Konstan 2000 Menurut Lapangan Usaha di
Kota Batam, 2010 – 2013
**Sequence Index of Batam City GRDP at Constant
Rate by Industrial Origin 2010 – 2013
**... 288
Tabel. 10.9.
Indeks Implisit Produk Domestik Regional
Bruto (PDRB) Kota Batam Menurut Lapangan
Usaha, 2010 – 2013
**Gross Regional Domestic Products (GRDP) Implicit
Index in Batam City by Industrial Origin 2010 –
2013
**... 291
Tabel. 10.10.
PDRB dan Angka Per Kapita Atas Dasar Harga
Berlaku Kota Batam, 2010 – 2013
**GRDP and Per Capita Figure at Current Market
Price in Batam City, 2010 – 2013
**... 294
Tabel. 10.11.
PDRB dan Angka Per Kapita Atas Dasar Harga
Konstan Kota Batam, 2010 – 2013
**GRDP and Per Capita Figure at Current Market
Price in Batam City, 2010 – 2013
**... 295
xl Batam Dalam Angka 2014
LIST OF GRAPHICS
Halaman
Page
Grafik 3.1.
Penyebaran Penduduk Menurut Kecamatan di
Kota Batam Tahun 2013
Population of Batam by District, 2013
...
54
Grafik 3.2.
Jumlah Pencari Kerja yang terdaftar pada Dinas
Tenaga Kerja Kota Batam Tahun 1998 – 2009
Number of Registered Job Seekers at Man Power
Service of Batam City Year 1998 – 2009 ... 55
Grafik 3.3.
Banyaknya Sekolah di Lingkungan Dinas
Pendidikan Kota Batam Tahun 2009
Number of School Administered by the Education
Service City of Batam, 2013 ... 84
Grafik 3.4.
Banyaknya Sarana Kesehatan di Batam, 2008
Number of Medical Practitioners by Kind in Batam,
2013 ... 85
Grafik 3.5.
Perkembangan Jumlah Tempat Peribadatan di
Kota Batam, 1999 – 2007
Number of Religion Worship Facilities by Kind,
1999-2007 ... 87
Grafik 6.1.
Perkembangan Perusahaan Industri Besar dan
Sedang di Kota Batam
Growth of Large and Medium Scale Industry in
Batam 2011-2013 ... 175
Grafik 6.2.
Jumlah Daya Tersambung
Grafik 6.3.
Persentase
Banyaknya
Air
Minum
yang
Disalurkan ATB, 2009
Percentage of Number of Water Supply Distributed by
PT ATB ... 177
Grafik 7.1.
Perkembangan Nilai Ekspor Batam Menurut
Pelabuhan Muat (US$), 2004-2009
Value of Export of Batam by Port (US$), 2004-2009 ... 187
Grafik 7.2.
Kondisi Jalan di Kota Batam Tahun 2009
Number of Vehicles Compulsory by Kind Vehicle
2009 ... 201
Grafik 7.3.
Jumlah Wisman yang Berkunjung ke Batam
Menurut Kebangsaan, 2007-2009
Number of Foreign Countries Visit to Batam by
Nation, 2007-2009 ... 204
Grafik 9.1.
Jumlah dana dari masyarakat pada Bank – bank
2004-2009
Number of Publik funds at Banks 2004-2009 ... 233
Grafik 9.2.
Perkembangan Inflasi Kota Batam, Tanjung
Pinang dan Nasional Tahun 2013
Growth of Inflation of Batam, Tanjungpinang and
National, 2013 ... 235
xlii Batam Dalam Angka 2014