© 2014 The International Institute for Sustainable Development
Andrea M. Bassi Kieran McDougal David Uzsoki
September 2017
Sustainable Asset
Valuation Tool
WATER
Created by Oksana Latysheva
Head Ofice
111 Lombard Avenue, Suite 325 Winnipeg, Manitoba
The International Institute for Sustainable Development (IISD) is one of the world’s leading centres of research and innovation. The Institute provides practical solutions to the growing challenges and opportunities of integrating environmental and social priorities with economic development. We report on international negotiations and share knowledge gained through collaborative projects, resulting in more rigorous research, stronger global networks, and better engagement among researchers, citizens, businesses and policy-makers.
IISD is registered as a charitable organization in Canada and has 501(c)(3) status in the United States. IISD receives core operating support from the Government of Canada, provided through the International Development Research Centre (IDRC) and from the Province of Manitoba. The Institute receives project funding from numerous governments inside and outside Canada, United Nations agencies, foundations, the private sector, and individuals.
MAVA Foundation
The MAVA Foundation is a Swiss-based philanthropic foundation with a focus on the conservation of biodiversity. Since its inception in 1994, it has supported more than 700 projects, implemented by over 280 diferent organisations. These include international and local NGOs, research institutions, universities and occasionally government bodies or individuals. The foundation operates four diferent programmes. Three are region-based: Switzerland, the
Mediterranean Basin and West Africa. In each place it has strived to help build extensive conservation capacity, to create and support conservation institutions and inluence policy. Its fourth programme, the Sustainable Economy
programme, provides opportunities to afect global trends and have an impact that goes beyond the foundation’s priority regions by focusing on valuing natural capital, green inance and resource eiciency.
Sustainable Asset Valuation Tool: Water Infrastructure
September 2017
Written by Andrea M. Bassi, Kieran McDougal and David Uzsoki
© 2014 The International Institute for Sustainable Development
TABLE OF CONTENTS
PART I: SCREENING TEMPLATE: WATER MANAGEMENT ...1
PART II: IN-DEPTH REVIEW: WATER MANAGEMENT ...5
1.0 DEFINITION OF SUSTAINABLE INFRASTRUCTURE ...5
1.1 SHORTCOMINGS OF BAU INVESTMENTS ... 6
1.2 ADVANTAGES OF GREEN INVESTMENTS ...10
2.0 RISKS TO PROJECT FINANCING AND O&M ... 14
2.1 GREY INFRASTRUCTURE ... 14
2.2 GREEN INFRASTRUCTURE ...15
3.0 CHALLENGES AND OPPORTUNITIES ... 16
3.1 MAIN ROADBLOCKS FOR THE ADOPTION OF SUSTAINABLE INFRASTRUCTURE ...16
3.2 POLICY INTERVENTIONS ... 17
4.0 ACTORS INVOLVED ...20
5.0 MEASUREMENT STANDARDS AND DATA ... 21
5.1 EXISTING SUSTAINABILITY STANDARDS ...21
5.2 DATA ...23
6.0 MAIN ORGANIZATIONS WORKING ON THE ASSESSMENT OF INFRASTRUCTURE FOR SUSTAINABLE WATER MANAGEMENT ...42
PART I: SCREENING TEMPLATE: WATER
MANAGEMENT
Deinition of sustainable infrastructure
- A sustainable water system ensures “adequate supplies of water of good quality are maintained for the entire population of the planet, while preserving the hydrological, biological and chemical functions of ecosystems, adapting human activities within the capacity limits of nature and to combat vectors of water-related diseases” (United Nations, 1992).
- A sustainable water system is “one that is designed and managed to contribute fully to objectives of society, now and in the future, while maintaining ecological, environmental and hydrological integrity” (American Society of Civil Engineers & United Nations Educational, Scientiic and Cultural Organization, 1998).
- Sustainable urban water management relects growing concerns over “community wellbeing (rather than just public health), ecological health and sustainable development, all of which can be collectively labelled as ‘green’ issues (Bartone et al., 1994)” (Marlow, Moglia, Cook, & Beale, 2013, p. 7151). The main goals of sustainable urban water management are a more natural water cycle (pollution control, ecological regeneration and enhancement of urban amenities), enhancing water security through local source diversiication and resource eficiency.
- “For a water utility, sustainability is practically achieved when all its activities, both internal to the business and across its supply chain, achieve net added value when assessed across each of the triple-bottom-line outcomes (inancial, social and environmental) over the medium- to long-term timescales, considering all costs and beneits, including externalities” (Marlow, Beale, & Burn, 2010).
- The main water-related goals in the green economy are investing in degraded river systems and watersheds, developing localized water systems, ensuring universal access to clean drinking water and sanitation services, reducing water scarcity, and balancing supply and demand (United Nations Enviromment Programme [UNEP], 2011).
- Sustainable water infrastructure includes the “traditional human-made or built infrastructure components and the natural infrastructure, such as rivers, lakes, streams, groundwater aquifers, loodplains, loodways, wetlands and the watersheds that serve or are affected by water and wastewater systems” (The Aspen Institute, 2009). - Water management policies and technologies can be divided into three areas: water supply, water demand and
wastewater management. The following technologies are generally considered: o Supply
→ “Green” infrastructure techniques such as restoration of wetlands, riparian buffers, reforestation, etc.
o Demand
→ Water eficient appliances/ixtures → Smart water systems
o Wastewater management
→ “Green” infrastructure techniques such as restoration of wetlands, riparian buffers, reforestation, etc.
→ Grey water recycling/separation → Localized sanitation
→ Decentralized rainwater collection and drainage (green roofs, permeable pavements) - This review focuses primarily on built infrastructure for water supply in the agriculture sector (irrigation) and
wastewater management.
Indicators used to measure performance
- Five main categories for sustainability indicators: “(1) health and hygiene, (2) social-cultural criteria, (3) environmental criteria, (4) economic criteria, and (5) functional and technical criteria” (Hellstrom, Jeppsson, & Karrman, 2000).
- Indicators commonly used in the literature to assess the sustainability of urban water systems fall into the categories of economic indicators, environment indicators, technical indicators and socio-cultural indicators (Balkema, Preisig, Otterpohl, & Lambert, 2002)
- For service provision: service coverage, water quality samples, service effectiveness, cost of water, recovery of costs from charges, quality deterioration risk, environmental low regulation, unaccounted for water, per capita water use, resource capacity (Lundin, 2003)
- For water demand and supply management: withdrawal, water consumption, chemical and energy use for treatment of water supply, leakage, reused water, wastewater production per day, removal of pollutants, loads of pollutants, nutrients recycled, energy recovered (Lundin, 2003).
© 2014 The International Institute for Sustainable Development
- The current dominant model relies on large-scale, centrally managed infrastructure systems that are designed to deliver cheap and reliable services (Marlow, et al., 2013). However, the BAU model “is incurring increasing economic, social and environmental costs, even in countries with a long tradition of successful practices. This is a consequence of aging built infrastructure, increasing urbanization, emerging contaminants, competitive water uses, and measures to mitigate the effects of climate change (e.g., water-saving measures)” (Larsen Hoffmann, Luthi, Truffer, & Maurer, 2016, p. 929). The construction of water management systems in developing countries entails substantial costs, but there is little willingness and ability to embark on large-scale infrastructure projects (Larsen et al., 2016).
- “The downsides of the current [urban water management (UWM)] system are its strong dependence on large quantities of water, high investment costs and need for stable institutions, as well as long planning horizons and ineficient use of resources” (Larsen, et al., 2016, p. 928).
Ecological health (water-cycle and resource eficiency) - Supply
o Certain types of infrastructure can “lead to declines in the quality and quantity of water supply, as a result of ecosystem degradation. For example, conventional lood management infrastructure can disconnect rivers from loodplains and reduce or eliminate services such as lood control, groundwater recharge, pollution control and supply regulation (Opperman, et al., 2009; UNEP-DHI Paternership, 2014, p. 9).
o “Grey infrastructure is often designed to address a speciic water management problem (though some grey infrastructure may serve multiple purposes, such as reservoirs that provide water supply, lood control, hydropower, recreation, etc.). It can serve to shift ampliied risks to other locations. For example, canalized rivers and urban stormwater infrastructure may cause downstream looding” (UNEP-DHI Paternership, 2014, p. 9).
- Demand
o Systems are designed to supply large amounts of water, with little incentive to reuse water or reduce its use.
- Wastewater management
o The local built environment “has a strong inluence on the natural hydrological characteristics of a catchment. A substantial part of the global urban area of 658,760 km2 comprises impermeable surfaces. This leads to a higher surface runoff and a faster response time to the rain event” (Larsen, et al., 2016, p. 928).
o “In the process of urban water use, waste is produced in the form of waste water. However, waste water also contains important resources, including water, organic matter, heat and nutrients such as phosphorus and nitrogen. For example, the amount of nitrogen passing through the human metabolism on a global scale, and therefore potentially ending up in waste water, is on a par with major components of the nitrogen cycle” (Larsen, et al., 2016, p. 928).
Advantages of green investments
Institutional
- “Decentralized systems have the advantage that they can be installed in the short term when needed, thereby reducing the requirement for large-scale investment in sewers and centralized wastewater treatment plants. Moreover, they allow the local reuse of water and therefore increase water productivity” (Larsen, et al., 2016). Localized water management systems “require less upfront investment… and are more effective at coping with the need to expand services (USEPA, 2002)” (Organisation for Economic Co-operation and Development [OECD], 2015, p. 99).
- Smart water technologies contribute to “urban water management eficiency and inancial stability, as municipalities and water utilities are better able to recover costs from non-revenue water (e.g. stemming from leakages and illegal connections)” (OECD, 2015, p. 97).
Ecological health (water-cycle and resource eficiency) - Supply
o Green water infrastructure has a lower impact on the functioning and health of the watershed (UNEP-DHI Paternership, 2014).
- Wastewater management
o Decentralized rainwater collection reduces “pollution, as rain water gets more polluted as it runs long distances on streets, pavements and parking lots.” (OECD, 2015, p. 100)
o Permeable pavements also increase the quality of water returned to the environment, as it “allows rainwater to trickle through the ground and recharge aquifers” (OECD, 2015, p. 100).
Access and water security - Demand
o Increasing water productivity: Three main strategies designed to increase water productivity are reducing water waste, down-cycling or reuse of lower-quality water, and regenerating high-quality water from used water (Larsen, et al., 2016). Smart water systems can enhance water quality and reliability and decrease water losses due to leakage (OECD, 2015).
o Wastewater management
Main
roadblocks for the adoption of green infrastructure
- “Part of the challenge in changing the model of service provision is that investment cycles for infrastructure often occur over timescales that are too short (e.g., ive years) to allow effective adaptation to longer-term pressures. Another challenge is that the widespread adoption of a speciic technological solution leads to both institutional and technological ‘lock-in’ effects (Foxon et al., 2002). Arthur (1994) identiied four factors are identiied that generate such effects: (1) economies of scale, (2) learning effects that improve products or reduce their cost, (3) adaptive expectations (agents become increasingly conident about quality and performance of the current technology) and (4) network economies (agents adopting the same technologies as others)” (Marlow, et al., 2013, p. 7153).
- “There are a number of conceptual weaknesses associated with the arguments for SUWM and these provide alternative insights into why transformational agendas remain unfulilled: (1) dificulties in predicting the system effects of innovative solutions, (2) practical challenges in managing innovations in technologies and service provision strategies, (3) inancial considerations, and (4) the effect of bias and advocacy on the promotion of technologies and management paradigms” (Marlow, et al., 2013, p. 7153).
- Innovation effects:
o “The performance of an urban water system is multifaceted and dificult to predict from a system perspective. While this can be said of traditional systems, innovative solutions are, by deinition, introduced into new contexts, which implies there will be a lack of institutional capacity to manage uncertainties and risk. Changes to any part the system can have both upstream and downstream impacts that affect costs, performance and future opportunities” (Marlow, et al., 2013, p. 7193). - Practical challenges:
o “There are adoption issues to address, including increased management complexity, diffuse responsibilities, uncertain performance and community resistance to change. More speciically, innovative solutions often have requirements that are not necessarily clear from the outset, and institutional capacity therefore tends to develop over time” (Marlow, et al., 2013, p. 7155).
o “Who is in charge of –or accountable for- a particular issue is not always clear, especially when the issue cuts across domains such as urban planning, the environment and economic development. For instance, How should permeable surfaces used for parking lots and streets be deined in the context of urban drainage—as water related or transport infrastructure?” (OECD, 2015, p. 109)
- Financial considerations:
o “Water supply revenues are, to some extent, often linked to the volume of potable water used by customers, so widespread implementation of alternative water sources and/or water conservation measures could lead to reduced revenues” (Marlow, et al., 2013, p. 7154).
- Bias and advocacy
o When businesses, authorities, universities and related organizations build up knowledge and experience with any particular solution, it is inevitable that they will develop biases, intentionally or otherwise, toward their own commercial or institutional interests (Marlow, et al., 2013).
o Some communities may perceive that decentralized water systems leave them out of central infrastructure and result in lower-quality services. There is a risk that localized systems fragment cities and provide uneven levels of service (OECD, 2015).
Policy interventions
- Sustainable urban water management often beneits from policies not speciically aimed at improving green infrastructure, such as climate adaptation policies that restore watersheds or regulations on water pollution (OECD, 2015).
- Economic instruments such as water tariffs “can signal resource scarcity and relect some of the beneits of improved water security and improved water services”, while helping to cover the cost of sustainable infrastructure (OECD, 2015, p. 113).
Grey Infrastructure
- Regulatory: Environmental regulations around water use and pollution present the potential for increased costs. - Market: Centralized systems require substantial upfront inancing.
- Technical: Ageing infrastructure needs to be regularly repaired or replaced. Centralized systems are less able to deal with uncertainty around water supply due to climate change.
- Social pressure: Concerns arise over water pollution, declining health of lakes and rivers, and total water use, especially in water scarce regions.
Green Infrastructure
- Regulatory: Regulatory systems are developed to support large-scale centralized water management infrastructure.
- Market: Managing several small projects can be more of a burden for local institutions.
- Technical: Uncertainty remains regarding new technologies and lack of data on green infrastructure.
- Social pressure: Health concerns are related to reuse of grey water, decentralized sanitation and supply systems.
Existing sustainability standards
- Water Climate Bond Standard (http://www.climatebonds.net/standard/water)
Main
organizations working on the assessment of
- WaterNow Alliance (http://waternowalliance.org/)
© 2014 The International Institute for Sustainable Development Table 1. Assessment of selected green economy interventions in the water management sector
Goal Policy
Market support Multi-criteria analysis
Awareness Demand Supply Investment Avoided cost Added beneit
Incentives
PART II: IN-DEPTH REVIEW: WATER MANAGEMENT
1.0 DEFINITION OF SUSTAINABLE
INFRASTRUCTURE
Sustainable water management infrastructure takes into account environmental, social, and economic outcomes of the use of infrastructure. Sustainable urban water management is concerned with community well-being alongside with traditional concerns about public health. Main goals include a more natural water cycle, enhancing water security, and resource eiciency. Sustainable urban water management tends to focus on a more decentralized approach for infrastructure, and includes natural infrastructure such as rivers, wetlands and aquifers alongside human-made components. There are three components of water management infrastructure: water supply, water demand, and wastewater management.
IISD deines sustainable infrastructure as assets that optimize value for money economy-wide, and hence for all taxpayers. Sustainable water management infrastructure must be assessed based on both its upfront and lifetime costs, including resource use, pollution control, and health outcomes. A sustainable water system requires that water consumption is lower than the natural recharge rate, and that the material and energy use of water infrastructure is sustainable over the long term.
In the case of water management, the following technologies are considered:
• Supply
o “Green” infrastructure techniques such as restoration of wetlands, riparian bufers, reforestation etc.
o Dual supply
o Water recycling (Rainwater and greywater harvesting)
• Demand
o Water eicient appliances/ ixtures
o Smart water systems
• Wastewater management
o ‘Green’ infrastructure techniques such as restoration of wetlands, riparian bufers, reforestation etc.
o Greywater recycling/ separation
o Localized sanitation
o Storm water control (Green roofs, Permeable pavements)
• Irrigation
o Water use and leakage monitoring
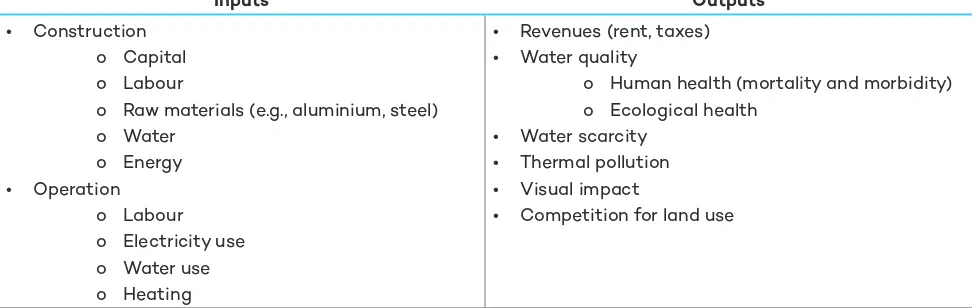
© 2014 The International Institute for Sustainable Development Table 2. Overview of required inputs and outputs generated by buildings
Inputs Outputs
• Construction
o Capital o Labour
o Raw materials (e.g., aluminium, steel)
o Water
o Human health (mortality and morbidity)
o Ecological health • Water scarcity
• Thermal pollution • Visual impact
• Competition for land use
1.1 SHORTCOMINGS OF BAU INVESTMENTS
The current water management infrastructure model relies on large-scale centrally managed systems, which are primarily aimed at afordable and reliable service delivery (Marlow, Moglia, Cook, & Beale, 2013). These systems are facing several challenges, including aging infrastructure, increasing urbanization, emerging contaminants, competitive water uses, and the need for measures to mitigate the efects of climate change. Centralized water systems depend on large quantities of water and require high levels of investments, and stable institutions. In developing countries, there is often little willingness or ability to build large scale infrastructure projects (Larsen, Hofmann, Luthi, Trufer, & Maurer, 2016).
Conventional water management has institutional drawbacks as well as drawbacks in water supply, water demand, and wastewater management.
• Institutional
o Conventional water management infrastructure requires a substantial amount of investment and maintenance. Once the infrastructure is in place, it is diicult to replace or retroit.
Example:
The US spent USD 137 billion on water infrastructure in 2014. USD 109 billion of that was spent on water utilities, including water supply infrastructure (pipes, sewers) and wastewater treatment plants. The remainder was spent on water resources, including dams, levees and sources of freshwater. Thirty three per cent of the spending on water utilities was capital investment, with the remaining 67 per cent spent on operation and maintenance. The breakdown for water resource spending is 36 per cent for capital expenditure and 64 per cent for operation and maintenance (Congressional Budget Ofice, 2015).
o Much of the existing conventional infrastructure is nearing the end of its life, increasing the cost of maintenance and water waste.
Example:
• Conventional centralized water management systems require well functioning governance systems, and extensive upfront infrastructural investment. This makes it diicult for conventional water management systems to keep up with population growth in the megacities of the developing world.
Example:
“As the population increased dramatically in the last 50 years, and the rate of urbanization began to accelerate, the provision of clean water and safe disposal of wastewater and stormwater in the megacities of developing countries became increasingly more complex and serious. […] The main problem of megacities often stems from the fact that the rates of urbanization have often far exceeded the capacities of the national and local governments to plan and manage the demographic transition eficiently, equitably and sustainably” (Varis, Biswas, Tortajada, & Lundqvist, 2006, p. 194). “The megacities of the developing world witnessed explosive growth during the post-1950 period, and especially after 1960. For example, the population of Mexico City Metropolitan Area increased from 3.1 million in 1950 to 13.4 million in 1980, a 425% increase in only 30 years. This expansion continues still as the City’s population has now exceeded 18 million. Such megacities were simply unable to manage such explosive growth rates. The fastest growing megacities are expected to grow more than fourfold in 25 years” (Varis, Biswas, Tortajada, & Lundqvist, 2006, p. 192).
Water supply:
• The construction and operation of large scale water supply infrastructure has multiple external
environmental impacts due to the life cycle impacts of inputs such as piping or the use of electricity. The electricity use related to treating and pumping water contributes a substantial amount of water supply environmental impact.
Example:
Global warming potential (GWP) values in units of equivalent carbon dioxide mass per km of pipeline were compared for six pipeline types (PVC, Ductile iron, concrete, reinforced concrete, cast iron and high density poly-ethelyene). Iron pipes have the highest GWP at 472 000 kg CO2/km (ductile iron) and 353,000 kg CO2/km (cast iron) for 12 inch diameter pipes. The production phase produced the largest amount of emissions (Du, Woods, Kang, Lansey, & Arnold, 2013).
The southern part of California has long relied on water imported from sources located hundreds of kilometers to the east and north. “In 2001, an estimated 4 percent of the electric power consumption in California was used for water supply and treatment (largely transportation) for urban and agricultural users; this estimate increases to 7 per cent if end uses in agriculture (which are mainly related to
pumping) are included (California Energy Commission, 2006). The depletion of source waters in the state has led to habitat deterioration, the decline and extinction of native ish species, the near-collapse of the Sacramento–San Joaquin River Delta ecosystem, and the desiccation of Owens Lake, whose dry lake bed is arguably the single largest source of asthma- and cancer inducing respirable suspended particles in the U.S.” (Feldman, 2017, p. 73)
o Water infrastructure can lead to declines in the quantity of water available. As cities grow, and agriculture and industry use more water, aquifers and other fresh water sources are depleted.
Example:
© 2014 The International Institute for Sustainable Development
Groundwater in Dhaka is used well beyond the recharge rate. “Almost 1000 private wells abstract another 0.35 km3 per year of groundwater, mainly for industrial purposes. Groundwater is used far beyond the sustainable
rate and this groundwater mining puts a serious strain on the environment. The groundwater table has gone down 20 to 30 m in the past three decades and continues to sink 1 to 2 m per year” (Varis, Biswas, Tortajada, & Lundqvist, 2006)
o Declines in water quantity can in turn decrease the quality of the water supply, as the watershed is less able to regulate itself, due in part to ecosystem degradation. Salt water intrusion takes place as freshwater in aquifers is replaced with salt water.
Example:
Salt water intrusion has become a problem in South Florida’s Broward County. Results of a numerical modeling analysis suggest that groundwater withdrawals were the dominant cause of a multi-decade salt water intrusion event, and that historical sea-level rise (about 25 cm for the simulation period) contributed to the extent of the intrusion by about 1 km. The model projects that drinking water
standards for total dissolved solids will be exceeded in 70 years with no sea-level rise, and 10 to 21 years earlier with IPCC predicted sea-level rise (Langevin & Zygnerski, 2013).
o Conventional infrastructure is often designed to address one speciic water problem. This narrow focus can shift or amplify problems in other areas.
Example:
Levees do a great job of minimizing impacts from moderate size loods for small areas. Ten out of 26 years since the Winona, Minnesota levee on the Mississippi River was completed have had peak lows above lood stage. “While levees are good for individual communities in small- to moderate-size events, levees are bad for the river system’s overall capacity to deal with lood lows. By literally walling off large sections of the loodplain, levees give the river much less room to spread out horizontally… But levees basically do nothing to change the discharge, or volume, of the lood. So if the water can’t spread horizontally, it has to either speed up or get higher. At St. Louis, the 1993 Mississippi lood peaked at a stage of 49 feet. In ~1927, the same volume of water at St. Louis would have reached only 39 feet” (Jefferson, 2011).
• Water demand:
o Water systems are designed to supply large amounts of water, and do not provide incentives to reduce or reuse water. Water demand is driven by a variety of uses, including landscaping and industrial uses.
Example:
• Wastewater management
o The vast majority of urban areas are impermeable. This increases the rate of runof and produces a quicker response to rain events. Runof also can have higher levels of pollutants, as water travels longer distances before absorption.
Example:
“Urban and exurban growth in the Spring Lake, Michigan watershed has resulted in an increase in total impervious area, particularly in the communities adjacent to Spring Lake. Between 1992–1997 and 2006, overall watershed mean percent impervious surface area increased from 8.9 to 15.1 %. In addition, watershed area with limited impervious surface areas (i.e., <10 %) decreased from 68 per cent in 1978 to only 27 per cent in 2006. […]Between 1992/1997 and 2006, total phosphorous increased 46 per cent from 3.96 to 5.76 metric tonnes/year, while total suspended solids increased an additional 36 per cent from 272.20 to 371.17 metric tonnes/year” (Steinman, Isely, & Thompson, 2015, p. 8)
Field assessments of urban streams in western North America have found that Coho salmon are dying prematurely at high rates. “Mixtures of metals and petroleum hydrocarbons – conventional toxic constitutents in urban stormwater – are not suficient to cause the spawner mortality syndrome. By contrast, untreated highway run-off collected during nine distinct storm events was universally lethal [100% mortality] to adult coho relative to unexposed controls” (Spromberg, et al., 2015)
o Wastewater treatment requires a signiicant amount of energy
Example:
“Wastewater treatment accounts for about 3% of the U.S. electrical energy load, similar to that in other developed countries. The energy needs for a typical domestic wastewater treatment plant employing aerobic activated sludge treatment and anaerobic sludge digestion is 0.6 kWh/m3 of wastewater treated, about half of which is for electrical energy to supply air for the aeration basins. With conventional approaches involving aerobic treatment a quarter to half of a plants energy needs might be satisied by using the CH4 biogas produced during anaerobic digestion, and other plant modiications might further reduce energy needs considerably. However, if more of the energy potential in wastewater were captured for use and even less were used for wastewater treatment, then wastewater treatment might become a net energy producer rather than a consumer” (McCarty, Bae, & Kim, 2011 p. 7100).
o Wastewater contains important resources, such as nitrogen and other nutrients, that are not properly captured by conventional wastewater infrastructure, which typically takes the form of aerobic wastewater treatment combined with anaerobic sludge digestion.
Example:
Wastewater contains high levels of nitrogen (N) and phosphorous (P),that is not fully utilized. “Concerning energy associated with N and P, ~7% of the world’s natural gas production was used in 1990 to ix atmospheric nitrogen through the Haber-Bosch Process to satisfy the demand for N. Somewhat less is associated with P production. From a broad environmental perspective world fossil fuel consumption could be reduced through the direct use of wastewater N and P for fertilizer instead of using manufactured fertilizers” (McCarty, Bae, & Kim, 2011, p. 7100).
• Irrigation
o Irrigation withdrawals reduce the overall level of water, whether sourced from groundwater or surface water.
Example:
© 2014 The International Institute for Sustainable Development
o Regular irrigation increases the incidence of water logging and raises soil salinity. Water logging occurs when the water table is high enough that the soil is nearly always saturated. Agricultural crops need air at varying depths in the soil. A related problem is soil salinity. The regular use of irrigation increases the salt in the soil. This salt most be continuously leached by continued application of water. Salts may rise to the surface in the absence of leaching, as in the case of a waterlogged ield.
Example:
It is estimated that 0.62 per cent of the 776,131 ha of agricultural land in South Africa is strongly saline. Within the Vaal Harts Irrigation scheme, the largest such scheme in South Africa with 35,000 ha, it is estimated that 13 to 18 per cent of the area is affected by water logging and salinization (Ojo, Ochieng, & Otieno, 2011).
Nine districts in India are impacted by the problems of water logging and soil salinization. More than 50,000 ha in Haryana have a water table less than 1.5 metres deep. The salinity in these waterlogged areas is 35 to 40 deci Siemens per meter, much higher than the normal limit of 2 dS/m, and higher even than seawater at 25dS/m. In the Rohtak district, 47.2 percent of agricultural land (78 694 ha out of 166 777 ha) falls into the potentially waterlogged category with 9.9 percent already being waterlogged and saline. The issue of salinity is made worse by the use of groundwater for irrigation, as the groundwater is already highly saline (Manav, 2016).
o Irrigation causes erosion, particularly in hilly or highland areas.
Example:
A study done in the Pamir region of Tajikistan found that irrigation driven erosion was not a problem for lowlands with a less than 3 degree slope (which lose an average of 2 t/ha per year). However for some agricultural plots with more than a 3 degree slope soil loss rates up to 30 t/ha per year were found (Golosov, Sosin, Belyaev, Wolfgramm, & Khodzhaev, 2015).
1.2 ADVANTAGES OF GREEN INVESTMENTS
Sustainable water management systems utilize more decentralized infrastructure in addition to natural features of the watershed such as lakes, rivers and streams. Decentralized systems can have lower cost to install, as well as being easier to maintain.
• Institutional
o Decentralized systems can be installed where and when they are needed, which reduces the need for large upfront investments as well as making it easier to expand services as necessary.
Example:
• Water supply: Water productivity can be increased in three main ways, reducing water waste, reuse of lower-quality water for other purposes, and regenerating high-quality water from used water.
o Dual and triple water supply systems reduce energy and water use by supplying water for speciic purposes, rather than supplying potable water for all purposes.
Example:
“Hong Kong’s dual water system, which has been in operation for over 50 years, supplies seawater for toilet lushing to 80% of its 7 million residents, cutting municipal water use in the city by 20 percent. A triple-water distribution system at Hong Kong’s International Airport, consisting of freshwater, seawater, and treated graywater from sinks and aircraft washdown, cuts municipal water use by over 50 percent” (Feldman, 2017).
o Rainwater, stormwater and greywater capture and reuse reduces municipal water use. This reduces the stress on water resources as well as reducing the energy use and costs associated with delivery, as water use is more decentralized and local.
Example:
“In a case study of a model home in Melbourne (Australia) the use of rainwater tanks to supply water for laundry, dishwashing, toilets, and an outside garden reduced household municipal water use by 40 percent (muthukumaran et al, 2011). However, even in Melbourne, where rainwater-harvesting schemes are commonplace, they contribute a modest 5 GL year to the city’s overall water budget, which represents 1.2 percent of the city’s total water use and 1.4 percent of its municipal supply” (Feldman, 2017).
For the cities of Pachuca and Mineral de la Reforma, State of Hidalgo, Central Mexico, rainfall harvesting is capable of supplying lush toilets and washing machines with consumptions of 4.8 L/lush and 70 L/ load, respectively. A maximum and a minimum consumption of eight and six lushes/day/person (lush toilets) and ive and four loads/week (washing machine), are possible (Lizarraga-Mendiola, Vazquez-Rodriguez, Blanco-Pinon, Rangel-Martinez, & Gonzalez-Sandoval, 2015).
“Stormwater harvesting couples lood control and urban runoff management with urban water supply by capturing runoff and recharging it to drinking water aquifers or by reusing stormwater for nonpotable uses. This underappreciated water source is already an important part of the supply for some cities. The Los Angeles County Department of Public Works operates 27 spreading basins that recharged 149 million m3 of surface runoff in the 2011-2012 water year” (Hering, Waite, Luthy, Drewes, & Sedlak, 2013).
o Waste water can be reused for irrigation, toilets, ire protection, laundry, ground water recharge and other urban and industrial uses.
Example:
“To avoid the need to locate reclamation facilities near users or to build dual distribution networks, some cities have turned to potable water reuse. For example, Singapore’s NEWater Project [produces] around 550 ML/day of reverse osmosistreated water from the city’s wastewater treatment plants. While much of the reclaimed water is used by industrial users who value the low salinity water, the reclaimed water provides around 2% of Singapore’s potable water supply and will increase in the future” (Hering, Waite, Luthy, Drewes, & Sedlak, 2013).
o Using natural water features as green infrastructure reduces the impact on the functioning and health of the watershed, while also providing other ecological beneits.
Example:
© 2014 The International Institute for Sustainable Development • Water demand:
o Use of more water eicient appliances reduces water use and energy use
Example:
“A modeling study of the water supply system in Florianopolis, Brazil, concluded that replacing single-lush toilets with dual-single-lush toilets would reduce municipal water use in the city by 14 to 28% and reduce energy use at upstream (drinking water) and downstream (wastewater) treatment plants by 4 GWh year–1 —enough energy to supply 1000 additional households” (Grant, et al., 2012).
“An analysis of 96 owner-occupied single-family homes in California, Washington, and Florida concluded that the installation of high-eficiency showerheads, toilets, and clothes washers reduced household use of municipal water by 10.9, 13.3, and 14.5%, respectively. Because water is not technically required for bathroom waste disposal, the installation of composting toilets and waterless urinals can reduce municipal water use even further” (Grant, et al., 2012).
o Smart water metering provides an incentive for reduced water use while also enhancing water quality and reliability. Smart water system also allow the early detection of leaks.
Example:
“In the U.S., an average of 14% of treated water is lost to leaks. The situation is even worse in many developing countries, where losses of up to 40% are common. Modern asset management schemes are capable of achieving substantial water savings through more effective leak detection and prioritization of pipe repair and replacement. The coming shift to real-time water metering and pressure sensors will create opportunities to identify and repair water leaks in a more cost-effective manner” (Hering, Waite, Luthy, Drewes, & Sedlak, 2013).
• Wastewater management:
o Recycling of wastewater reduces municipal water use, while also reducing the amount of wastewater that needs to be treated.
Example:
“The Rouse Hill Development Area (RHDA) is a new residential area about 45 km northwest of Sydney. The area is located close to the Hawkesbury-Nepean River, which would have been the natural treated wastewater receiver of the RHDA. However, due to environmental concerns on the impact of the discharge of treated wastewater into the above estuary, Sydney Water (the agency which designed the sewerage and wastewater treatment system), proposed to reuse the treated water in
non-potable domestic applications, such as garden irrigation, toilet lushing and car washing. As a result, a signiicantly smaller quantity of treated wastewater would have to be discharged into the river, with a parallel reduction in the demand for potable water. The reclaimed water is
stored close to the areas of use, in three reservoirs with total capacity of 6000 m3… The demand for
potable water has been reduced by approximately 35%, since the commissioning of the reclaimed water distribution system. Approximately 2000 m3/d of potable water are currently used to supplement the
demand in reclaimed water applications, thus the reclaimed water system has been scheduled to be expanded to approximately 5200 m3/d” (Gikas & Tchobanoglous, 2007).
o Decentralized rainwater collection reduces pollution, as it prevents rain water from running long distances on streets and parking lots. Permeable pavements also increase the quality of water returned to the environment
Example:
o Wastewater contains energy and nutrients that can be utilized for other purposes. Separating waste water streams as early as possible makes energy recovery and treatment easier
Example:
Microorganisms are capable of converting a wide variety of biodegradable organic compounds into CO2, water and energy. Microbial fuel cells harvest this microbially produced energy and also provide habitat to maintain their growth and metabolic activities. Power output by MFCs has increased considerably over the last decade due to several scientiic and technical advances. “Applications for the microbe– electrode interactions have also been expanded to waste/wastewater treatment, bio-remediation, toxic pollutants/xenobiotics removal, recovery of commercially viable products, i.e. resource recovery, sequestration of CO2, harvesting the energy stored in marine sediments, and desalination” (Pandey, Shinde, Deopurkar, Kale, & Patil, 2016).
• Irrigation
o Furrow irrigation is a common practice in many areas. Switching to sprinkler irrigation has a number of beneits. Sprinkler technology can reduce erosion and runof by reducing the rate and speed of water application. This in turn reduces nutrient loading to streams and rivers which improves the water quality. Switching to sprinklers can also reduce the total amount of water used.
Example:
A study conducted in the Upper Snake River/Rock Creek area of Idaho was conducted to compare the impacts of furrow and sprinkler irrigation on water quality and quantity. The study compares data from 1969 and 1971 (when furrow irrigation was practiced) to data from 2005 and 2006 (when sprinkler irrigation was practiced. The study found that water quality improved between 1971 and 2005. Net loss of suspended solids went from 460 kg ha to 22 kg ha from 1971 to 2005 (Bjorneberg, Westermann, Nelson, & Kendrick, 2008).
o Drip irrigation allows for greater crop productivity while reducing total water use.
Example:
Drip irrigation has a number of beneicial environmental and economic effects. Drip irrigation reduces the need for labour-intensive activities such as weeding and ploughing, therefore reducing the cost of cultivation. The cultivation cost for drip-irrigated chillis in India is INR 78,500 compared to INR 111,200 for non-drip irrigated chillis, a saving of 29 per cent. Water use, as measured by pump horsepower output, is also greatly reduced, falling from 1,674 HP per acre to 617 HP per acre (Narayanamoorthy, Devika, & Bhattarai, 2016).
o Sprinkler technology can improve the water use eiciency of irrigation
Example:
© 2014 The International Institute for Sustainable Development
2.0 RISKS TO PROJECT FINANCING AND O&M
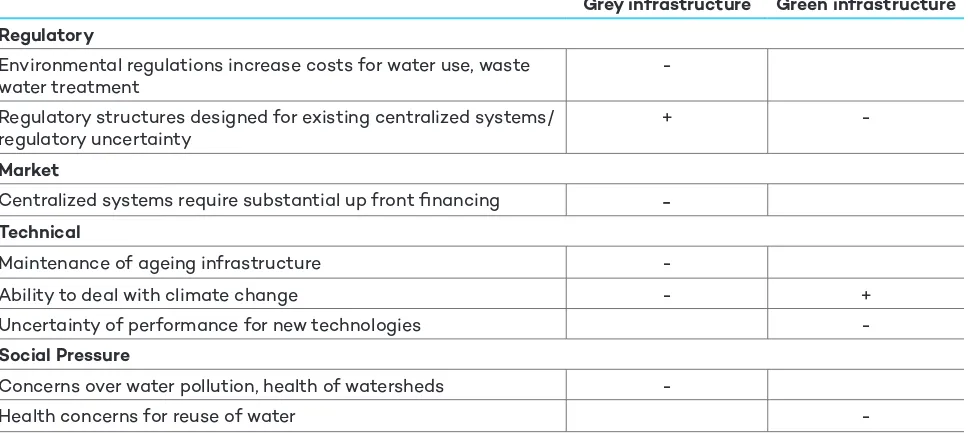
Table 3. The impact of project risks on green/ grey infrastructure
Grey infrastructure Green infrastructure
Regulatory
Environmental regulations increase costs for water use, waste water treatment
-Regulatory structures designed for existing centralized systems/ regulatory uncertainty
+
-Market
Centralized systems require substantial up front inancing
-Technical
Maintenance of ageing infrastructure
-Ability to deal with climate change - +
Uncertainty of performance for new technologies
-Social Pressure
Concerns over water pollution, health of watersheds
-Health concerns for reuse of water
-2.1 GREY INFRASTRUCTURE
• Regulatory: Environmental regulations around water use and pollution present the potential for increased costs, lower revenues
Example:
“The activities of water providers are inanced, in whole or in part, by selling water. If less water is sold, then revenues drop. Because many of a utility’s costs are ixed (e.g., the capital costs of existing infrastructure), conservation can drop revenue (income) faster than costs, leading to budgetary shortfalls that necessitate rate increases unpopular with customers, utilities, and political leaders. This link between the volume of sales and a utility’s inancial health is known as the “throughput incentive” and is a powerful conservation disincentive seen in several utility sectors (Erickson & Leventis, 2011)” (Kenney, 2014).
• Market: Centralized systems require substantial up front inancing, diicult to get private inancing
Example:
• Technical: Ageing infrastructure needs to be regularly repaired or replaced. Centralized systems less able to deal with uncertainty around water supply due to climate change.
Example:
The American Society of Civil Engineers estimates that there are 240,000 water main breaks every year. The majority of the water supply pipes in America were laid 75 to 100 years ago, and the rate of replacement is only 0.5%. It will take an estimated 200 years to replace all pipes at that rate, taking them well beyond their useful lifetime (ASCE, 2017).
“Where precipitation levels decline, sewerage systems may become more dificult to operate and maintain. This will be a particular problem for conventional sewerage with its relatively high water requirements. Further problems may also arise from the reduced capacity of water resources to absorb and dilute pollution, which will increase the performance requirements, and hence the cost and potentially the carbon footprint, of wastewater treatment. Sewers are also at risk from looding damage. Where sewers also carry stormwater, increased looding will result in widespread contamination, overwhelm treatment facilities and increase public health risks” (WHO & DFID, 2009).
• Social Pressure: Concerns over water pollution, declining health of lakes and rivers. Concerns over total water use, especially in water scarce regions.
Example:
“Between 1985 and 2000, the Centers for Disease Control (CDC) documented 251 separate disease outbreaks and nearly half a million cases of waterborne illness from polluted drinking water in the United States. Another study by the CDC and the National Academy of Sciences concluded that most illnesses caused by eating tainted seafood have human sewage as the root cause” (American Rivers, 2016). Many of the sewage plants in the United States are outdated and unable to handle wastewater lows. Older sewage systems combine stormwater with household sewage, but even in systems where they are separated some stormwater ends up in the sewer, where it contributes to raw sewage overlows (American Rivers, 2016).
2.2 GREEN INFRASTRUCTURE
• Regulatory: Regulatory systems are developed to support large scale centralized water management infrastructure.
Example:
“If use of decentralized systems were to expand, private companies could become more involved in the invention and manufacture of equipment. The current market is mixed. Large corporations are involved in water-eficiency appliances, such as washing machines. However, most of the decentralized wastewater system manufacturers are still relatively small due to great fragmentation in local regulations and systems that are permitted across the country. The larger companies look at the ield and back away. Companies do not want to have to redesign a new system for each different set of local regulations, nor go through the expense of getting their systems permitted in one locale after another” (Nelson, 2008).
• Social Pressure: Health concerns related to reuse of greywater, decentralized sanitation and supply systems.
Example:
“As a new non-potable water source, reclaimed water has been widely used for many purposes,
© 2014 The International Institute for Sustainable Development
3.0 CHALLENGES AND OPPORTUNITIES
3.1 MAIN ROADBLOCKS FOR THE ADOPTION OF SUSTAINABLE INFRASTRUCTURE
Conventional water management systems can be diicult to change once they have been implemented. The widespread adoption of a speciic water management solution leads to both institutional and technological ‘lock-in’ efects. This is due to both the diiculty of retroitting existing water systems, and the long expected life times of conventional water systems. Four factors contribute to these efects (Marlow, Moglia, Cook, & Beale, 2013):
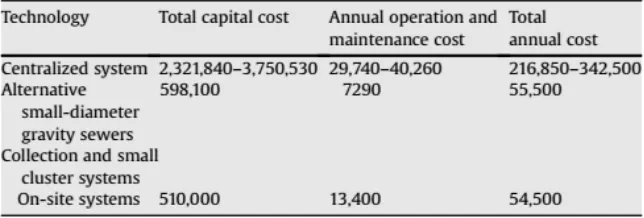
• (1) economies of scale: wastewater treatment costs decrease as the size of plants increases. This may put new, smaller treatment options at a disadvantage.
Example:
A survey of 176 water industry actors found that treatment costs declined as facility size increased. For facilities with lows less than 100,000 gallons per day, the treatment cost per 1000 gallons was nearly 15 times greater than that incurred by the largest facilities (Industrial WaterWorld).
• (2) learning efects that improve products or reduce their cost,
• (3) adaptive expectations (people become increasingly conident about quality and performance of the current technology. This can make it diicult to switch to new systems that have diferent quality expectations)
Example:
“For drinking water supply, decentralized solutions (e.g., point of entry systems, roof water collection) have usually been considered viable only for small service areas. A major impediment to expansion of such decentralization to urban systems is the need to frequently monitor water quality within the household. Further development of reliable real-time monitoring systems and successful demonstration projects are needed before decentralization will have a major impact on potable water supply” (Hering, Waite, Luthy, Drewes, & Sedlak, 2013).
• (4) network economies (agents adopting the same technologies as others)
In addition to the lock in efects that encourage the continued use and expansion of conventional water management, there are also shortcomings with sustainable water systems that hinder their use and expansion: (Marlow, Moglia, Cook, & Beale, 2013).
• (1) Innovation efects: a lack of capacity to manage the risks and uncertainties associated with novel water management systems.
• (2) Practical challenges: Issues such as day to day management complexity, community resistance to change
Example:
“A survey of water utilities in California found that inancial or economic challenges were the main hindrance to increasing water recycling. 87% of respondents cited inancial or economic challenges as one of the three most important hindrances to water reuse implementation. One respondent commenting on the single most important hindrance to implementation simply stated, ‘These projects are big ticket items outside the range of a rate base.’ Despite various sources of policy and inancial support for water reuse in California, lack of suficient funding may be the main factor preventing recycling goals from being achieved” (Bischel, Simon, Frisby, & Luthy, 2011)
“For 16 projects seeking regional federal funding as part of the San Francisco Bay Area Recycled Water Coalition, the total costs ranged from $220/Acre Feet (AF) to $3400/AF, with a $1200/AF median value, assuming a 20-year period for recycled water generated at the initial project yield. 31 Recycled water deliveries expected for these projects range from 115 AFY (0.0045 m3 /s) initially to up to 28,000 AFY
(1.1 m3 /s) in the future. A City of Palo Alto analysis indicated an annualized cost of $2700/AF (over 30 years, in March 2008 dollars) expected for expansion of distribution facilities. This compared with a projected cost of $1,600/AF by 2015 for wholesale purchase of potable water from the San Francisco Public Utilities Commission” (Bischel, Simon, Frisby, & Luthy, 2011).
• (4) Bias and advocacy: businesses, governments, and communities have built up familiarity with existing water systems, biasing them toward these systems. Decentralized systems may also be perceived to reduce water quality or service.
Example:
“Use of recycled water may face opposition from water users. While utilities and consultants have developed more appropriate modes of communicating with the public, some remain skeptical about the safety of the practice, especially as projects are proposed in their community and the likelihood of human contact increases. Nearly two-thirds of respondents (61%) to a 2010 Survey of water utilities in California cited perceptions or social attitudes as hindrances to program implementation, though these factors were less frequently considered among the most important challenges to overcome. ‘Perceived human or environmental health risks due to constituents of emerging concern’ was cited as a hindrance to implementation by almost half of respondents” (Bischel, Simon, Frisby, & Luthy, 2011).
3.2 POLICY INTERVENTIONS
Sustainable urban water management often beneits from policies not speciically aimed at improving green infrastructure, such as climate adaptation policies that restore watersheds, or regulations on water pollution (OECD, 2015).
Water consumption standards can be set for a variety of products.
Example:
© 2014 The International Institute for Sustainable Development
Subsidies for homeowners to install water management systems and eicient appliances can encourage uptake, as well as helping reduce costs. Installation of eicient appliances can also be mandated. Subsidies and incentive programs can also be used to encourage the adoption of water eicient irrigation technologies.
Example:
“In the mid-1990s, New York City provided cash rebates for 1.3 million toilets, reducing water consumption in the city by 80–90 million gallons (300–340 million l) per day, or about 20%. The Metropolitan Water District of Southern California, a consortium of 26 cities and water districts that provide water to 18 million people, currently offers residential rebates on high eficiency toilets, clothes washers with a water factor of 5.0 or lower, timers and water-eficient nozzles for irrigation systems, and artiicial turf. For commercial customers, 15 different products qualify for rebates” (Wilson, 2008). “Some jurisdictions encourage customers to save water by giving away replacement ixtures, or
providing rebates on replacement ixtures that reduce water use. The Southern Nevada Water Authority (SNWA), which serves Las Vegas and the surrounding region, has probably gone the furthest with direct payments. SNWA’s Water Smart Landscapes program pays customers to replace turf with xeriscaping. The current payment is $1.50 per ft2 ($16.15/m2), with no cap on the area—meaning that some
homeowners can earn tens of thousands of dollars through such conversions.
Each square foot of lawn conversion saves 56 gallons per year (2,300 l/m2/year). Since the program
began in 1999, SNWA has spent over $110 million on more than 30,000 conversion projects, paying for the removal of nearly four square miles (1,000 ha) of irrigated turf. The water authority can afford to spend so much money on water conservation because the cost of ensuring supply to support the growth that the Las Vegas region is experiencing is even greater” (Wilson, 2008).
“Between 1998 and 2005, the state of Kansas spent nearly $6 million on incentive programs, such as the Irrigation Water Conservation Fund and the Environmental Quality Incentives Program, to fund the adoption of more eficient irrigation systems. Such programs paid up to 75% of the cost of purchasing and installing new or upgraded irrigation technology, and much of the money was used for conversions to dropped nozzle systems” (Pfeiffer & Lin, 2013)
Economic instruments such as water tarifs can signal resource scarcity and relect some of the beneits of improved water security and improved water services, while helping to cover the cost of sustainable infrastructure (OECD, 2015).
Example:
“Over the past several decades, conservation has played an increasingly important role in satisfying demand, through the adoption of water-saving devices in the residential, commercial and industrial sectors. Singapore, for example, employed consumption-based tariffs and a water conservation tax to achieve an 11% reduction in average monthly water consumption between 1995 and 2004” (Hering, Waite, Luthy, Drewes, & Sedlak, 2013).
Installation and use of water meters ensures that water use is measured, and allows for pricing and feedback on actual water use.
Example:
Restrictions or water supply and sewerage standards may be placed on new buildings and developments in order to encourage the use of high eiciency technologies, water re-use technologies, or wastewater control.
Example:
The US Green Building Council’s LEED program for green buildings includes a water eficiency section for scoring. The section includes indicators such as outdoor water use, indoor water use, water metering, and water use reduction actions (USBGC, 2017).
Table 4. Policies to encourage deployment of renewable energy generation
Policy Deinition
Fiscal Incentives
Subsidies and rebates Cash transfers to help cover individuals costs for the installation of water eficient appliances and products
Water tariffs Water pricing structure that charges more for large water users. Attempts to charge full cost to encourage conservation
Regulations
Route design Routes can be designed to avoid sensitive ecosystems, reducing the potential impact from construction
Infrastructure and urban planning
Ensure that the transport system is designed in a holistic manner, and allows for multiple transport modes.
Regulations
Construction/ development Standards
Water supply and wastewater control standards for new buildings and developments
© 2014 The International Institute for Sustainable Development
4.0 ACTORS INVOLVED
Governments: to set standards for drinking water, water use, and water management systems. Governments also build and maintain water management systems and construction policy.
Example:
The Guidelines for Canadian Drinking Water Quality have been developed and published by the federal/ provincial/territorial Committee on Drinking water since 1968. The guidelines deal with microbiological, chemical and radiological contaminants, as well as concerns with physical characteristics such as colour, taste, and odour (Health Canada, 2016).
The City of Melbourne implemented permanent water use rules in December of 2012. These rules apply only to drinking water, and include restrictions on watering lawns and gardens, cleaning driveways and vehicles, and use in fountains. Further voluntary water eficiency was implemented in 2016 with the goal of limiting water consumption to 155 litres per person per day (Melbourne Water, 2017).
“The Southwest Virginia Regional Wastewater Study (SVRWS) was developed in 2005 as part of an attempt to manage wastewater in Southwest Virginia. The project focused largely on extending centralized sewer lines to areas with antiquated septic systems and considered some decentralized managed wastewater systems due to remote location, topographic situations, small size, or soil conditions. In all, over 136 sites were examined under the following criteria: degree of health hazard, severity of environmental problems, number of customers served, construction cost per connection, construction feasibility, as well as residential, commercial, and industrial growth potential. The top 44 centralized projects, 12 decentralized projects, and three hybrid projects were then recommended for implementation. Of the 44 centralized projects, 40 were sewer extensions to existing wastewater treatment plants” (Kautz, 2015).
Private sector: The private sector builds and maintains some water utilities, especially decentralized systems. The private sector also develops new technologies such as microbial sewage digestion.
Example:
In 1996, the EPA published a paper for congress that concluded that decentralized sewage systems can protect public health and water quality. Since then the EPA has partnered with public and private partners to improve the performance and management of decentralized systems. Members include the International Association of Plumbing and Mechanical Oficials, the National Association of Homebuilders, and the National Onsite Wastewater Recycling Association (EPA, 2014).
“Boston-based Cambrian Innovation began ield tests of what’s known as a microbial fuel cell at the Naval Surface Warfare Center in Maryland. Called BioVolt, in one day it can convert 2250 litres of sewage into enough clean water for at least 15 people. Not only that, it generates the electricity to power itself – plus a bit left over.
This is a big deal, as conventional treatment plants guzzle energy – typically consuming 1.5 kilowatt-hours for every kilogram of pollutants removed. In the US, this amounts to a whopping 3 per cent of the total energy demand. If the plants could be self-powered, recycling our own waste water could become as commonplace as putting a solar panel on a roof” (Adee, 2016).
Individual Households: Households can participate in water management through personal reductions in water use, installation of water eicient appliances, and household wastewater management.
Example:
5.0 MEASUREMENT STANDARDS AND DATA
5.1 EXISTING SUSTAINABILITY STANDARDS
Water Climate Bond Standard (http://www.climatebonds.net/standard/water)
The water Climate Bond Standard criteria are being developed by the Climate Bonds Initiative, AGWA, Ceres, CDP and the World Resources Institute. An initial phase to develop criteria for the assessment grey infrastructure has been completed. A second phase to develop criteria for the assessment of green infrastructure is underway.
Sustainable Urban Water Management Program Sweden (http://www.urbanwater.se/en)
The Sustainable Urban Water Management Program was initiated by the Swedish Foundation for Strategic Environmental Research (MISTRA) in 1999. The goal of the project was to make urban water systems both widely accessible as well as environmentally sustainable. Five areas of focus were chosen: moving towards nontoxic environment, improving health and hygiene, saving human resources, conserving natural resources, and saving inancial resources (Hellstrom, Jeppsson, & Karrman, 2000).
BREEAM for Communities (http://www.breeam.com/communities)
BREEAM for Communities expands the sustainability assessment standard from individual buildings to larger developments. Although the system is not focused on water management, it is included. The overall goal is to create communities that are good for the environment, the people, and are economically vibrant.
LEED Neighbourhood Design (http://www.usgbc.org/leed)
© 2014 The International Institute for Sustainable Development
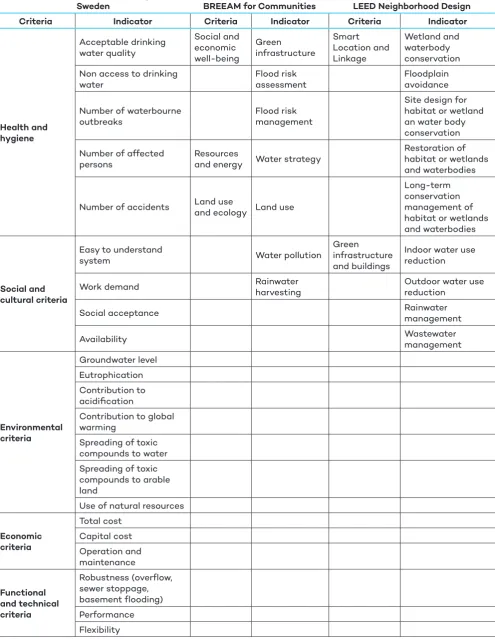
Table 5. Water system assessment categories and indicators (Hellstrom, Jeppsson, & Karrman, 2000) (BREEAM, 2012) (USGBC, 2016)
Sustainable Urban Water Management
Sweden BREEAM for Communities LEED Neighborhood Design
Criteria Indicator Criteria Indicator Criteria Indicator
Health and
Number of accidents Land use
5.2 DATA
In the case of water management, the data is required for the following technologies, as well as for existing business as usual technology.
• Supply: includes the use of water along with the external impacts associated with supply, such as the materials and energy used in infrastructure. Infrastructure costs are also included.
o ‘Green’ infrastructure techniques such as restoration of wetlands, riparian bufers, reforestation etc.
o Dual supply
o Water recycling (Rainwater and greywater harvesting)
• Demand: includes data on measures to reduce water demand, such as costs and water eiciency.
o Water eicient appliances/ ixtures
o Smart water systems
• Wastewater management: includes data on managing wastewater, such as pollutant loadings to the watershed, and cost data.
o ‘Green’ infrastructure techniques such as restoration of wetlands, riparian bufers, reforestation etc
o Greywater recycling/ separation
o Localized sanitation
o Storm water control (Green roofs, Permeable pavements)
Table 6. Overview of required inputs and outputs generated by water management
Inputs Outputs
• Construction o Capital o Labour
o Raw materials (e.g., aluminium, steel) o Water
o Human health (mortality and morbidity) o Ecological health
• Water scarcity • Thermal pollution • Visual impact
• Competition for land use
5.2.1 General Data
• Water infrastructure spending in the US, 2014: The US spent $137 billion on water infrastructure in 2014. $109 billion of that was spent on water utilities, including water supply infrastructure (pipes, sewers) and wastewater treatment plants. The remainder was spent on water resources, including dams, levees and sources of freshwater. Thirty three percent of the spending on water utilities was capital investment, with the remaining 67 percent spent on operation and maintenance. The breakdown for water resource spending is 36 percent for capital expenditure and 64 percent for operation and maintenance (Congressional Budget Oice, 2015).
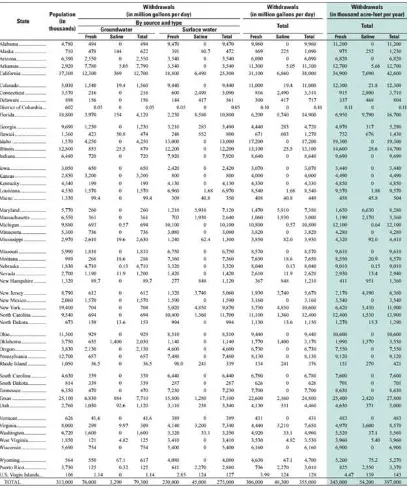
Table 8. Total water withdrawals by water-use category, millions of gallons per day (USGS, 2014)
© 2014 The International Institute for Sustainable Development Table 9. Performance grade and costs of roads for different asphalt binders (European Commission, 2012)
5.2.2 Supply Data
Rainwater harvesting
• Harvesting rainwater reduces municipal water use as well as reducing the amount of storm water runof. Recycling greywater further ampliies this efect. A study of Woden township (32,611 people in 13,890 houses), Australia found signiicant reductions in municipal water use, wastewater and stormwater runof (Sharma, Gray, Diaper, Liston, & Howe, 2008).
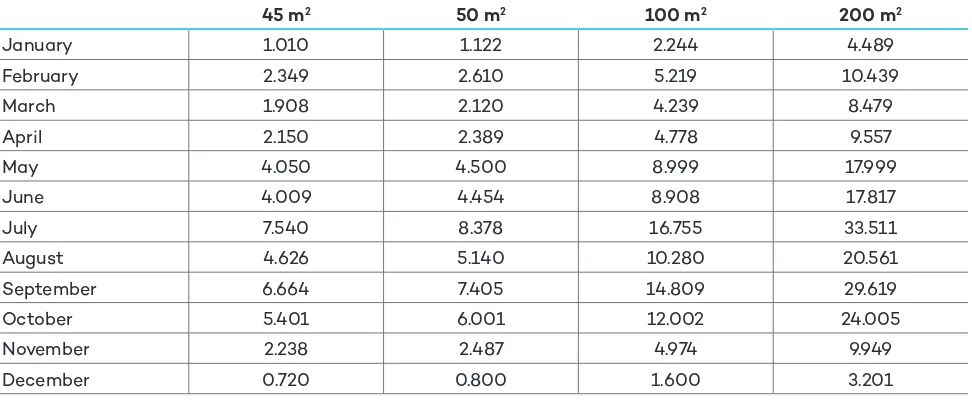
Table 10. Monthly volume of harvestable rainwater (in m3) as a function of household roof area in central Mexico (Lizarraga-Mendiola, Vazquez-Rodriguez, Blanco-Pinon, Rangel-Martinez, & Gonzalez-Sandoval, 2015)
45 m2 50 m2 100 m2 200 m2
January 1.010 1.122 2.244 4.489
February 2.349 2.610 5.219 10.439
March 1.908 2.120 4.239 8.479
April 2.150 2.389 4.778 9.557
May 4.050 4.500 8.999 17.999
June 4.009 4.454 8.908 17.817
July 7.540 8.378 16.755 33.511
August 4.626 5.140 10.280 20.561
September 6.664 7.405 14.809 29.619
October 5.401 6.001 12.002 24.005
November 2.238 2.487 4.974 9.949
December 0.720 0.800 1.600 3.201
Table 11. Effect of water saving measures in Woden township, Australia (Sharma, Gray, Diaper, Liston, & Howe, 2008)
Base case/ no rain tanks or greywater
recycling Rain tanks in use
Greywater for garden irrigation
Rain tanks and greywater in use
ML/yr ML/yr % reduction ML/yr % reduction ML/yr % reduction
Water 4765 3649 24 4166 13 3160 34
Wastewater 2836 2836 0 2256 20 2258 20
Water recycling
• The reuse of graywater for toilet lushing and yard irrigation can cut household municipal water use by 50% or more (Grant, et al., 2012).
• The reuse of potable water consumes less than one-half the energy [~1000 to 1500 kilowatt-hours per megaliter (kWh Ml−1 )] beyond conventional treatment) required for the desalination of seawater (~3400 to 4000 kWh Ml−1 )
• Energy and emissions by water source (Table 12).
Table 12. Water source comparison California (Energy: GJ/100Acre Foot, others: Mg/100Acre Foot) (Horvath & Stokes, 2011)
Imported Desalinated Recycled Local reservoirs
Energy 1900 4600 1300 2200
GHG 140 350 120 150
NOx 0.37 0.73 0.17 0.46
PM 0.067 0.11 0.026 0.11
Sox 0.36 0.71 0.090 0.54
VOC 0.084 0.26 0.027 0.15
CO 0.52 0.74 0.10 0.69
5.2.3 Demand Data
Water demand by building type
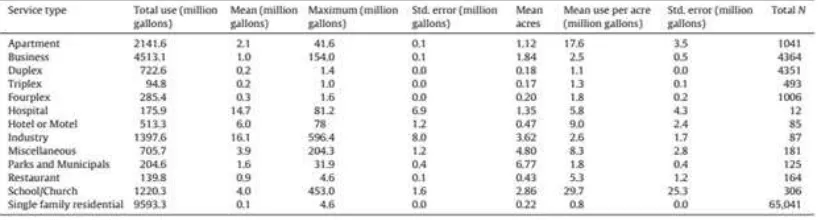
• A study of water demand in Salt Lake City found the average water demand by acre of diferent building types.
Table 13. Annual water use by building type, Salt Lake City (Stoker & Rothfeder, 2014)
Water eficient appliances
© 2014 The International Institute for Sustainable Development Table 14. Typical water use per person, Canberra (Sharma, Gray, Diaper, Liston, & Howe, 2008)
Water demand
• Non-revenue water (NRW) (due to leaks or mismanagement) “levels of 47 water utilities across Indonesia, Malaysia, Thailand, the Philippines, and Vietnam, average 30 percent of the water produced, with wide variations among individual utilities ranging from 4 percent to 65 percent … It is likely that the 35 percent igure is less than the global NRW level in the developing world because large developing countries with known high levels of NRW are still not covered by IBNET and the utilities that report operating data tend to be the ones with the better performance levels, while the worst-performing
utilities rarely report data or, if they do, the information is not reliable. The actual igure for overall NRW levels in the developing world is probably more in the range of 40–50 percent of the water produced” (Kingdom, Liemberger, & Marin, 2006, pp. 1–2).
Table 15. Non-revenue water losses by region (Kingdom, Liemberger, & Marin, 2006)
Supplied
Ratio Volume (billions of m3/year)
Physical
countries 744.8 300 15 80 20 9.8 2.4 12.2
Eurasia 178.0 500 30 70 30 6.8 2.9 9.7
Developing
countries 837.5 250 35 60 40 16.1 10.6 26.7
Total 32.7 15.9 48.6
Table 16. Estimated value of NRW (Kingdom, Liemberger, & Marin, 2006)
Marginal cost of
countries 0.3 1.00 2.90 2.40 5.30
Eurasia 0.30 0.50 2.00 1.50 3.50
Developing
countries 0.20 0.25 3.20 2.60 5.80