SUMMARY OF
Environmental and Social Impact Assessment
Central Java CFPP Project
Prepared for
Bhimasena Power Indonesia
Prepared by
POWER Engineers
Oradell, NJ 07649
Table of Contents
1. INTRODUCTION... 1
1.1 Objective and Scope of the ESIA ... 1
1.2 ESIA Methodology ... 1
1.2.1 ESIA Overview ... 1
1.2.2 Identification of Impacts from the Project ... 1
1.2.3 Document Review ... 1
2.3 International Standards Applied for the ESIA ... 3
2.3.1 EP III ... 3
2.3.2 IFC Performance Standards (2012) ... 3
2.3.3 Environmental, Health and Safety (EHS) Guidelines ... 4
2.3.4 Japan Bank for International Cooperation Guidelines ... 4
2.3.5 International Conventions and Treaties ... 4
5. EXISTING ENVIRONMENTAL AND SOCIAL CONDITIONS ... 9
5.1 Study Area ... 9
5.10.1 Overview of Terrestrial and Coastal Flora ... 21
5.10.2 Agricultural Land Use ... 22
5.10.4 Coral Reef Ecosystem ... 25
6. ANTICIPATED ENVIRONMENTAL AND SOCIAL IMPACTS AND MITIGATION MEASURES ... 42
6.1 Air Emissions Mitigation ... 42
6.1.1 Name of Pollutants ... 42
6.1.2 Emission Sources during Construction Stage ... 42
6.1.3 Construction Mitigation Efforts... 43
6.1.4 Emission Sources during Operational Stage ... 43
6.1.5 Operating Emissions Mitigation Efforts... 43
6.5 Terrestrial Flora and Fauna Impacts ... 49
6.5.1 Mitigation Measures ... 49
6.5.2 Marine Biota Impacts ... 50
6.6 Protected Species and IUCN Red List Species ... 53
6.7 Labor and Influx Management ... 54
7. LAND ACQUISITION, PUBLIC CONSULTATION AND DISCLOSURE ... 55
7.1 500 kV Switching Station ... 55
7.2 Transmission Line ... 55
7.3 Efforts Made for Minimizing Displacement ... 55
7.4 Landscape and Visual Impacts ... 56
8. PUBLIC CONSULTATION AND DISCLOSURE ... 59
8.1 Objectives ... 59
8.2 The Process ... 59
8.3 Information, Awareness and Consultation ... 59
8.3.1 Stakeholder Identification and Group Consultation ... 59
8.3.2 Official Website... 60
8.3.3 Grievance Mechanism ... 60
8.3.4 Contact Details for the Public ... 60
9. CLIMATE IMPACT ASSESSMENT – GREENHOUSE GASES ... 61
11. ANALYSIS OF ALTERNATIVES ... 63
11.1 Site Alternatives ... 63
11.2 Technology Options ... 63
ABBREVIATIONS
ANDAL Analisis Dampak Lingkungan (Environmental Impact Analysis)
AMDAL Analisis Mengenai Dampak Lingkungan (A thorough Environmental Impact Assessment)
BPI PT Bhimasena Power Indonesia
CFPP Coal Fired Power Plant
Contractor Contractor from Construction Contract & Supplier from Supply Contract
EHS Environmental, Health and Safety
EMaP Environmental Management Plan
EMoP Environmental Monitoring Plan
EP Equator Principles
EPC Engineering, Procurement, and Construction
ESIA Environmental and Social Impact Assessment
FGD Flue Gas Desulfurization
Ha Hectare
IFC International Finance Corporation
IPP Independent Power Project
JBIC Japan Bank for International Cooperation
PAP Project Affected People
PLN PT Perusahaan Listrik Negara (Persero) (The Indonesian State Electric Utility Company)
PS Performance Standard
ROW Right of Way
Switching Station / Substation
These terms are used interchangeably throughout the document because a switching station will be put in now and a substation is anticipated to be put in in the future. The same land will contain both.
UNDIP Universitas Diponegoro (University of Diponegoro)
1.
INTRODUCTION
This document is a Summary of the Environmental and Social Impact Assessment (ESIA) Report prepared for the proposed Central Java 2 x 1,000MW Coal Fired Power Plant (CFPP). The project is being developed in response to the ever increasing demand for electricity, which has reached a point of urgency in Indonesia.
Central Java CFPP will be built through a Public Private Partner scheme between PLN and Bhimasena Power Indonesia (BPI). The project plays a notable role to facilitate such an ambitious infrastructure development goal and will fulfill a portion of the electricity needs. The Project site is located approximately 80 km west of Semarang. The Project site is accessible via the northern coastal highway. The CFPP will provide Indonesia with 2×1,000 MW of electricity from the burning of coal.
1.1
Objective and Scope of the ESIA
BPI recognizes the importance of incorporating environmental and social protections and mitigations to avoid issues as early as possible for the project planning and design stages. This allows for any adverse risks and impacts to be acknowledged, understood, and addressed in a way that is sustainable and environmentally responsible.
The objective of the ESIA was to carry out an assessment to determine any potential environmental and social impacts of the project activities and implement proper control measures and management plans to mitigate the risks and impacts on the environment.
1.2
ESIA Methodology
1.2.1 ESIA Overview
The ESIA study was prepared over about 180 days and conducted from around February to August 2013 and has been revised through mid-2016. The AMDAL was generated alongside the ESIA in order to gain the earliest possible approval from Lenders for the Project. The ESIA is an extension of the AMDAL with focus on demonstrating compliance with the Equator Principles, IFC Performance Standards, IFC EHS guidelines, and JBIC guidelines. The AMDAL was approved by the Indonesian government.
1.2.2 Identification of Impacts from the Project
There will be various social and environmental risks and impacts assessed during the life of the Project. BPI must entertain each impact as a potential issue and determine whether these impacts will be considered significant, insignificant, or permanent. The ESIA has identified these impacts; discusses the justifications for the risks and impacts; and sets out mitigation measures for the severity of the risks and impacts.
1.2.3 Document Review
1.2.4 Benefits of the Project
The Central Java CFPP Project will be beneficial for the public, the government, and the developer.
1.3
Project Execution and Scheduling
Limited Notice to Proceed (LNTP) for the project occurred on November 14, 2011. Preliminary site preparatory work has been started before Full Notice to Proceed (FNTP). FNTP is now expected to occur in the first half of 2016.
2.
REGULATORY FRAMEWORK SUMMARY
2.1
Overview
The assessment of potential risks and impacts will be carried out by developing both qualitative and quantitative assessment processes.
2.2
National AMDAL Standards
The laws and decrees issued under Law No. 32 of 2009 concerning Environment Protection and Management and Government Regulation No. 27 of 2012 obligate each activity predicted to trigger substantial impacts on the environment to make an AMDAL.
The tasks related to the impact analysis for the AMDAL should include:
• Collection of comprehensive quantitative baseline data on ambient concentrations of parameters and averaging time consistent with relevant Indonesian air quality standards within the defined air shed encompassing the Project area;
• Evaluation of the baseline air quality (degraded/non-degraded);
• Evaluation of baseline water quality;
• When there is a reasonable assumption that in the long term the power plant will be expanded or other pollution sources will increase significantly, the analysis should take into account the impact of the proposed plant design both immediately and after any formally planned expansion in capacity or in other sources of pollution.
2.3
International Standards Applied for the ESIA
The Project will be financed by various groups. Lenders for this project are signatories to the Equator Principals (EP). Therefore, the guidelines for assessment of whether or not the Project meets Lender requirements will be assessed against the IFC Performance Standards and IFC EHS Guidelines. The EP compliance summary will include additional International environmental and social standards from the IFC Performance Standards.
2.3.1 EP III
EP encourages private lenders to consider the environmental and social impacts and risks prior to funding a large-scale project. The requirements in the EP guide companies with industry specific standards of environmental compliance, both nationally and internationally and include a focus on social issues through enhanced consultation, disclosure, and grievance mechanism requirements.
The EP applies to all new project financings globally with a total project capital cost of US$10 million or more. The IFC Performance Standards should be followed in order to comply with the EP.
2.3.2 IFC Performance Standards (2012)
requirements should be applied to projects that are determined to have moderate to high levels of environmental and/or social risks.
The following subsections identify and describe the Performance Standards with which the Project is compliant.
1. Performance Standard 1: Assessment and Management of Environmental and Social Risks and Impacts
2. Performance Standard 2: Labor and Working Conditions
3. Performance Standard 3: Resource Efficiency and Pollution Prevention 4. Performance Standard 4: Community Health, Safety and Security
5. Performance Standard 5: Land Acquisition and Involuntary Resettlement
6. Performance Standard 6: Biodiversity Conservation and Sustainable Management of Living Natural Resources
7. Performance Standard 7: Indigenous People 8. Performance Standard 8: Cultural Heritage
2.3.3 Environmental, Health and Safety (EHS) Guidelines
The General EHS guidelines are a set of the required steps to take when compiling important data. The IFC uses the EHS Guidelines as a technical source of information during project appraisal activities. In the Guidance Notes for Performance Standard 3, Good International Industry Practice (GIIP) is defined as the practice of professional skills, diligence, and insight that are expected from experienced professionals hired to engage in the same type of work under similar situations both globally and regionally. The use of GIIP should produce a project that employs the most appropriate technologies in project-specific circumstances. The EHS Guidelines provide general and industry-specific examples of GIIP.
The most recent EHS guidelines were applied to the Central Java CFPP. They are as follows: • IFC General Environmental, Health and Safety (EHS) Guidelines (2007)
• IFC Guidelines on Thermal Power (2008)
• IFC Guidelines on Electric Power Transmission and Distribution (2007) • IFC Guidelines on Ports, Harbors and Terminals (2007)
2.3.4 Japan Bank for International Cooperation Guidelines
Japan Bank for International Cooperation (JBIC) established a set of environmental and social guidelines in April 2002, entitled “JBIC Guidelines for Confirmation of Environmental and Social Considerations”. These guidelines were revised and put into effect on October 1, 2009. The JBIC Guidelines have been generated to encourage project proponents to implement appropriate environmental and social procedures.
2.3.5 International Conventions and Treaties
environmental and cultural conservation. Relevant conventions and agreements which BPI have recognized as appropriate for the Central Java CFPP are summarized below:
• International Convention for the Control Management of Ships’ Ballast Water and Sediments Convention by the International Maritime Organization, 2004;
• Guidelines for the Control and Management of Ships’ Ballast Water to Minimize the Transfer of Harmful Aquatic Organisms and Pathogens by the International Maritime Organization, 1997;
• International Code of Conduct on the Distribution of Pesticides by the Food and Agricultural Organization, 2002;
• Convention Concerning the Protection of the World Cultural and Natural Heritage by The General Conference of UNESCO, 1972; and
3.
PROJECT DESCRIPTION
3.1
Power Plant Overview
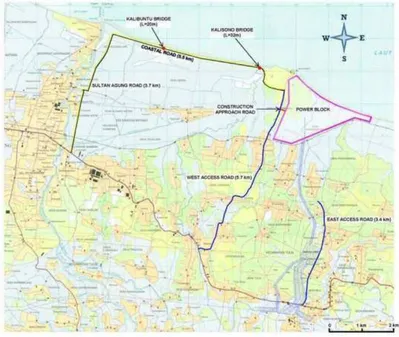
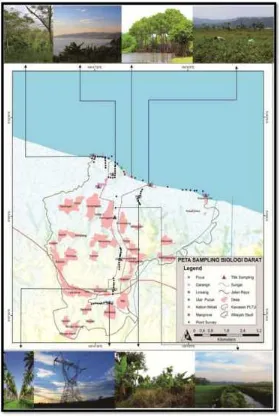
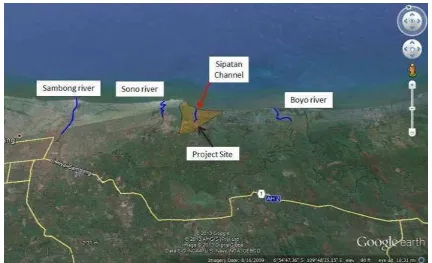
The proposed Central Java CFPP will be a 2 x 1,000 MW ultra-supercritical coal fired power plant in Central Java, Indonesia. The plant will mainly consist of two power block units, circulating water intake and discharge structures, a jetty, a switching station, transmission lines, and access roads. The facility layout is shown below in
Figure 3-1.
Figure 3-1: Central Java Facility Location
3.2
Facility Location
The CFPP Project site is located along the northern coast of Central Java that borders the Java Sea. It is approximately 80 km to the west of Semarang and 6 km from Pekalongan.
3.3
Project Configuration
with Low NOx burners, and back end emissions controls technologies including flue gas desulfurization (FGD) and Fabric Filters system, these coal fired units will provide critical electric needs with significant reducing in emissions as compared to alternate coal fired technologies.
The subbituminous coal supplied primarily from East and South Kalimantan will be transported by barges and/or special coal transporters to the Project site. Two coal conveyors will be installed to transport coal from the coal jetty to the storage yard and to the Plant’s coal silos. Coal will be conveyed from the storage yard and stored in silos prior to being fed into the boilers.
The boiler is started up and shut down using No. 2 fuel oil until coal combustion is stabilized. Coal is introduced to the boiler. The boiler generates steam which is provided to the steam turbine. The steam turbine and various ancillary equipment will be enclosed in a turbine building. Exhaust from the steam turbine will be condensed in a surface condenser with cooling water from the seawater intake pipelines. To prevent any destruction to the marine ecosystem, cooling water is pumped through a structure designed to draw water horizontally at a low velocity.
4.
ASSESSMENT METHODOLOGY
The main objectives of examining the present environment are to:
1. Defining an environmental and social baseline using accepted methods with quality assurance measures.
2. Identifying and quantifying existing (unacceptable) conditions that may need to be addressed by others, in terms of cause and remediation.
3. Providing engineering and social solutions that address the impacts from the proposed power plant on the existing site conditions.
The collection of baseline data focuses on information relevant to the proposed power plant project and its likely effects on the environmental and social condition.
The existing environmental and social baseline data was analyzed through infield and laboratory testing. The identification of baseline data and potential risks and impacts were carried out by on-site observations, consultations with local experts and stakeholders, literature review, and experience from similar projects. Environmental impact modeling was carried out for air, water, and noise impacts from Project construction and operation. Baseline data is collected based on the guidelines provided by a wide range of regulations, standards, and requirements of the EP, IFC Performance Standards, JBIC Guidelines, and Indonesian National Standards. A technical approach to data collection and analysis is presented. Limitations have also been indicated in the following sections of the report.
This ESIA includes all methodologies for the baseline sampling conducted for the Project. These methodologies include:
• Air Quality
• Noise
• Groundwater and Surface Water
• Solid Waste Disposal
• Hydrology and Hydro Oceanography
• Topographical Survey
• Soil Investigation
• Flora and Fauna
• Social and Socio-economic Impacts
5.
EXISTING ENVIRONMENTAL AND SOCIAL CONDITIONS
5.1
Study Area
The Proposed CFPP will cover an approximate land area of 226 ha with an additional 76 ha for transmission lines (including Right of Way (ROW)) and access roads. The Pemalang Switching Station, which will be built by the Project and turned over to PLN for operation, will occupy 19 ha. The type of land and its existing use varies. This section discusses the current condition of the Project site.
5.2
Data Sources
Some of the information and data presented in this section is based on primary surveys and environmental quality monitoring (ambient air quality, noise levels, etc.) carried out by Wiratman’s consulting firm with additional monitoring conducted by Air Laboratories from Semarang during March 2013. Additional sampling was also performed in June 2013. The purpose of the additional sampling is to assess baseline conditions during the dry season (March sampling occurred during the rainy season), as well as to vary the sampling schedule to assess anthropogenic influences on baseline data (e.g. sampling on a Sunday versus a weekday). Secondary information has been collected by Wiratman’s consulting firm, Air Laboratories, and UNDIP’s Pusat Pelayanan Perencanaan Pembangunan Parisipatif (P5) team from various governmental departments and agencies as well as other study reports available related to the subject area. In addition, a socio-economic household survey was undertaken in the Batang Regency by Wiratman’s consulting firm with additional social studies conducted by UNDIP’s P5 team and UNIKAL team (Coastal Study).
5.3
Proximity to Potential Hazards
The Project site is relatively free of potential hazards other than the hazards associated with natural phenomenon such as wind, rain, earthquakes, and rising sea levels. However, the area of the selected site is not known to have had disastrous environmental hazards.
Potential flooding at the Project site from rising sea levels will be avoided by raising the Project site elevation. Flooding from the existing irrigation channel at the south will be avoided by construction of a storm water drainage channel along the south boundary. According to tsunami analysis report, maximum water level rise is estimated to be only 5 cm. Therefore, there is no risk of flooding from tsunami.
All structures will be designed and constructed to resist the maximum wind and earthquake effects in accordance with the applicable codes and standards.
5.4
Topography
5.5
Climate
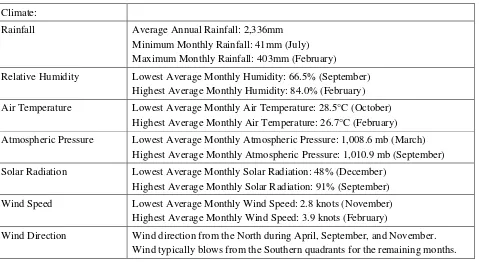
Climate data for the Project site are obtained from the Meteorology and Geophysics Agency/Department (BMKG) of Semarang. Semarang is located approximately 80 km to the east of the Project site and is considered representative of climatological conditions at the Project site since features that influence local meteorology, such as terrain, urban/rural characteristics, and proximity to large bodies of water, are the same or very similar. Climate data is shown in Table 5-1.
Table 5-1: Site Climate Data
Climate:
Rainfall Average Annual Rainfall: 2,336mm
Minimum Monthly Rainfall: 41mm (July) Maximum Monthly Rainfall: 403mm (February)
Relative Humidity Lowest Average Monthly Humidity: 66.5% (September) Highest Average Monthly Humidity: 84.0% (February)
Air Temperature Lowest Average Monthly Air Temperature: 28.5°C (October) Highest Average Monthly Air Temperature: 26.7°C (February)
Atmospheric Pressure Lowest Average Monthly Atmospheric Pressure: 1,008.6 mb (March) Highest Average Monthly Atmospheric Pressure: 1,010.9 mb (September)
Solar Radiation Lowest Average Monthly Solar Radiation: 48% (December) Highest Average Monthly Solar Radiation: 91% (September)
Wind Speed Lowest Average Monthly Wind Speed: 2.8 knots (November) Highest Average Monthly Wind Speed: 3.9 knots (February)
Wind Direction Wind direction from the North during April, September, and November. Wind typically blows from the Southern quadrants for the remaining months.
5.6
Air
The ambient air results were evaluated by comparing them to relevant national air quality standards.
The assessment process in any development project addresses compliance with the relevant host country laws, regulations, and permits that pertain to the social and environmental matters. For air quality standards, the national and regional standards are established from the following:
Government Decree of the Republic of Indonesia No. 41 (1999)
Central Java Governor Decree no. 8 (2001) - Ambient Air Quality Standards in Central Java Province
Minister of Living Environment No. 50 of 1996 Odor Standards
Evaluation of Monthly baseline air quality was not possible because the technology available for passive sampling does not provide for long term sampling.
The assessment of ambient air quality impacts from Project activities were done through a combination of field testing and modeling techniques as well as accounting for seasonal variability. Additional air sampling was conducted in June 2013 to capture potential seasonal variations in ambient air concentrations. The March 2013 sampling provided a record of ambient air quality during the rainy season, whereas the June 2013 sampling represents the dry season.
Local air quality is influenced by the pattern of air pollution emission sources located in the Project area and its vicinity as well as dominant sources farther away from the Project site. The following existing emissions sources contribute to the air quality in the project area:
Local Sources: Primary and secondary roads traverse the site border, as does a primary rail line. Local infrastructure improvements could be causing an increase in ambient concentrations of dust. As was previously noted, local sources of NO2, CO, SO2, TSP from traffic, household activities (cooking), agricultural activities, and natural sources may also be contributing to the local, baseline pollution concentrations.
Distant Sources: Three coal-fired power plants are located 110 to 130 kilometers from the proposed CFPP location: Cilacap, Tanjung Jati, and Cirebon. Wind rose data for Semarang indicates a predominating wind from the east-southeast direction and a secondary maximum from the west-northwest and northwest directions. The power plants are located west, east-northeast and southwest from the proposed CFPP location. Since these power plants are located where predominating winds will not carry emissions to the local monitoring sites, it is unlikely that measured, local concentrations of NO2, CO, SO2 and TSP are being influenced from these plants
Baseline Results: The results of ambient air quality monitoring produced during a 22.75 hour continuous measurement period were available for this analysis. The applicable Indonesian standards were compared to the results for each parameter including TSP, NO2, SO2, CO, HC, Pb. Grab samples were used to analyze ambient concentrations of H2S, O3, and NH3. The conclusions from the results are as follows:
All measurements were below the applicable standards for nitrogen dioxide (NO2). The measured sulfur dioxide (SO2) concentrations were <25 ug/Nm3 for every
sampling location during the 22.75-hour sampling period; below the minimal detection limit of the method used for the sampling. The results were significantly below both the Central Java 24-hour averaging standard of 365 ug/Nm3 and the WHO 24-hour averaging standard of 125 ug/Nm3.
All measurements of ozone (Ox) based on the 22.75 hour concentrations were found to be lower than the applicable standards.
Measured ambient CO concentrations range between 743 ug/m3 and 1,309 ug/m3. The highest concentration meets the air quality standards (Central Java Governor Decree No. 8 of 2001 and Government Regulation. 41, 1999, for a 24-hour averaging period, the CO parameter of 10,000 ug/m3, the concentration of CO values).
All measured Hydrogen Sulfide (H2S) concentrations were below the 0.02 ppm H2S air quality standard of Central Java Governor Decree No. 8 of 2001.
The Total Suspended Particulate (TSP) matter is predominantly from vehicular traffic and ground transportation, which suspends road dust that is then carried by the wind. Farming activities, such as rice paddy harvesting, are also a source of particulate matter. When compared to the ambient air quality TSP standard of 230 ug/m3, the maximum measured ambient air TSP concentration of 116.5 ug/nm3 was still approximately half the local standard.
The concentration of lead (Pb) results indicates a value below 0.030 ug/Nm3 at all monitoring location; the minimum detection level. The air quality standards of Central Java Governor Decree No. 8 of 2001 and Government Regulation. 41, 1999 for Pb parameter is equal to 2 ug/m3. Sampling results indicate levels well below the standard. The main source of Hydrocarbons (HC) is the firing of fossil fuels, including gasoline, oil,
and natural gas. Vehicular traffic is the main source of hydrocarbons in ambient air. Locally, residential use of fossil fuel for cooking is a likely secondary source of HC emissions. The sampled concentration of HC ranged between 450.5 to 1,099 ug/m3. This value is well above the recommended standards of 160 ug/m3 that is set by the Central Java Governor Decree No. 8 of 2001 and Government Regulation.
For all analyzed substances, no specific correlation of the measures values to local structural conditions could be identified.
With the exception of hydrocarbons, applicable standards were met for ambient air quality.
5.7
Water Quality
Water quality (seawater, river water and groundwater) is examined from primary and secondary data that is collected in accordance with applicable standards.
The assessment of groundwater impacts from project activities were done through a combination of field testing, and surface water modeling techniques. Water sampling was conducted in both the rainy and dry season to show seasonal variations. The assessment of dry and rainy season influences do not include groundwater sampling as seasonal influences are minimal due to the depth of the substrate. Water quality and various impacts were baselined for the tidal impacts, as well as seawater, river water, and groundwater quality evaluations.
5.7.1 Hydro-Oceanography
The coastal hydro oceanography was collected via secondary data, and information was collected from various references and library sources relating to oceanographic conditions of water around the CFPP site; this data is categorized as secondary data. Marine information is derived from blind interview with the locals; a method which provides more local information than available from the published journals or books.
Observations of tidal water levels are used to determine tidal constants which are then used:
o to obtain information of the water surface elevation at the location (both tidally influenced or not influenced);
o to get data to be analyzed for the use in the mathematical models;
o to determine the msl reference for example, lwl, hwl, etc.; and o to allow for correction of tidal sea depth measurements.
Existing hydrology: Hydrological data is derived from site observations and is related to the pattern and quality of river water and the size of the rainwater catchment area. Hydrological data is derived from secondary data. Hydrological aspects include the study of river currents as well as the identification of physical characteristics of the upstream/downstream bodies of water. Hydrological data, is obtained from onsite observations. Data relating to rivers and the size of the rain water catchment area is generated from secondary data obtained from few relevant institutions such as the Irrigation Department of Public Works Service Office. Hydrological characteristics of the site are observed from field studies. Two upstream and downstream points in close proximity to the proposed site were selected. The original, baseline condition of water body and any predicted changes that will occur as a result of the CFPP will be assessed and compared with water quality standards that are regulated under Government Regulation No. 82 of 2001. The Project was unable to conduct a full year of baseline river water quality sampling. The only available data for comparison involved single grab samples that were taken at each location on a single day. Seasonal variability was considered with sampling conducted in March and June 2013 to illustrate the baseline river water quality in both the rainy and dry season.
Power Plant Area Characteristics 5.7.1.1
The wave categorizations along the Batang coastal area are summarized as follows:
o December to February: waves head to the northwest (65.6%) with a 0.2 to 0.6 meter height and a dominant wave period of 3 to 5 seconds (45.9%).
o March to May: waves head to the northeast (42.9%) with a 0.6 to 1.0 meter height and a dominant wave period of 7 to 9 seconds (46.8%).
o June to August: waves head to the east (39.8%) with a 0.6 to 1.0 meter (40.9%) height and a dominant wave period of 7 to 9 seconds (46.9%).
o September to November: waves head to the east (22.7%) and the northeast (20%) with a 0.6 to 1.0 meter (32%) height and a dominant wave period of 7 to 9 seconds (30.7%).
o The annual wave characteristics are 0.6 to 1.0 meter (34.6%) in dominant height, has a 39.8% frequency, and has 7 to 9 seconds of dominant wave periods with 35.9% frequency.
Current Velocities: Based on the secondary data results for the coastal area, current flow velocities vary with an average speed ranging from 0.1 cm/s to 33.0 cm/s along the entire water column.
The minimum flow velocity ranges from 0.1 cm/s to 2.3 cm/s;
The lowest flow velocity occurs at a depth of one cell and the largest flow velocity at a depth of nine cells.
Tidal Observations: Tidal currents are horizontal movements of water masses produced by vertical movements in sea level caused by the gravitational pull from the moon. The high-low tidal range at the Marine Conservation Areas varies from 50-145 cm.
Dumping Area Characteristics 5.7.1.2
Wave Direction: The direction of wave generation is typically from the northwest, the north, and the northeast. In general, the velocity of the waves that occurs at the observation site is greatly influenced by monsoon movements and the water depth.
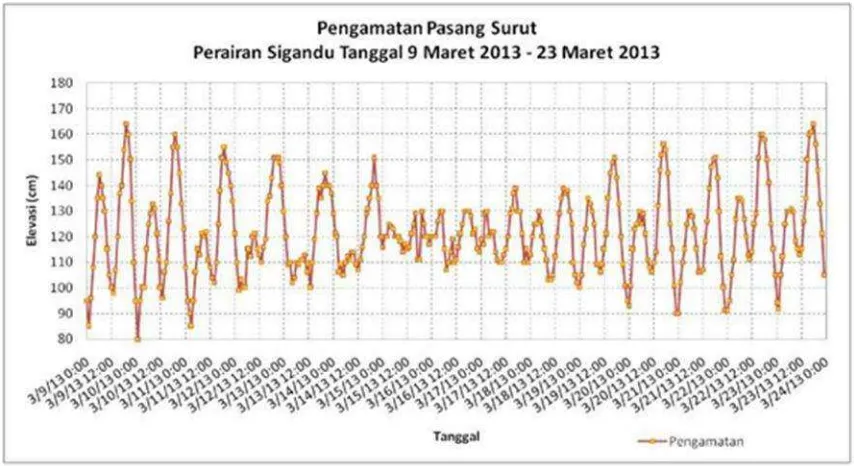
Flow Speed: Flow conditions show the relationship between the flow speed and tidal patterns. Dominant flow speeds for cell 1 to cell 10 ranges from 5 cm/s to 10 cm/s with a distribution between with an average speed of 6.4 cm/s.
Tidal Observations: The results from the analyses of the tidal data in the dumping area (from March 9-23, 2013) is shown in Figure 5-1 below:
Figure 5-1: Tidal Results
5.7.2 River Water Quality
Several baseline data parameters for river water do not meet the quality standards including, TSS, BOD, COD, Zn, Nitrite, Fecal Coliform and Total Coliform. The rivers studied are generally used by people as a place to dispose of domestic waste. The results are summarized as follows:
• Total Dissolved Solids (TDS): ranged from 82 to 274 mg/L and meets the quality standard at all points.
• Total Suspended Solids (TSS): ranged from 20 to 95 mg/L and TSS at sampling point AS-1 exceeds the quality standard.
• Biological Oxygen Demand (BOD): ranged from 2.150 to 4.646 mg/L with the highest BOD at sampling location AS-1. BOD at AS-1 and AS-2 did not meet the quality standard.
• Dissolved Oxygen (DO): ranged from 6.53 to 7.54 mg/L and meets the quality standard at all points.
• Other Parameters: Total phosphates, cyanide, fluoride, chlorine and phenol meet the quality standards at all sampling points.
• Chloride: ranged from 3.394 to 14.38 mg/L. All analyzed samples meet the quality standard.
• Nitrite: ranged from 0.002 to 0.062 mg/L. Nitrite at sampling point AS-2 did not meet the quality standard.
• Oils and Fats: ranged from <50 to 300 ug/L. All points meet the quality standards.
• Detergent: ranged from below 10 to 47 ug/L in march and met the quality standard. However, values in June were higher with a range of 139 to 349 and were above the quality standard.
• Metal Parameter: As, Co, B, Se, Cr VI, Cu, Pb, Mn were below the measurable amount (there is no water quality classification for Mn).
• Zn ranged from below the measureable amount of < 0.010 to 0.159 mg/L. All analyzed metal levels meet the quality standards.
• Fecal coliform: ranged from 0 to 35,000 Jml/100 ml with the highest fecal coliform at sampling location AS-4. Total coliform ranged from 2,700 to 54,000 Jml/100 ml with total coliform-highest at the AS-4. Fecal coliform at AS-2 and AS-4 did not meet the quality standard. Total coliform for sampling locations AS-2, AS-3, AS-4, and AS-5 did not meet the quality standard. This is likely the result of human wastes being disposed in the river.
5.7.3 Seawater Quality
The baseline study involved the collection of pollutants expected to be generated from the proposed power plant project.
Baseline Seawater Quality for Power Plant Area 5.7.3.1
The sampling period was carried out from March 18 to 22, 2013, representing the rainy season with additional sampling carried out in June 2013 and representing the dry season. There were fourteen (14) location points capturing the proposed locations of the inlet, outlet and jetty. Seawater samples were taken around the proposed power plant water intake, outtake, jetty, the Kretek coral, the Maeso coral, and the Boyo River and Estuary in Sambong River and compared with the seawater standard quality regulated under the Decree of State Minister of Environmental Affairs No. 51 of 2004. The following summarizes the baseline seawater quality parameters that were sampled and measured:
Brightness: Brightness at 10 of the 14 sampling locations did not meet the quality standards. Brightness at 4 of the locations met quality standards. The quality standard for brightness is less than 3 m.
Temperature: measurements ranged from 30.8 to 33.1°C, higher than other readings the Project has obtained for seawater temperature at the depth of the Plant’s water intake system. We believe the readings reported here were taken at locations that have shallow or stagnant waters. TSS: measurements ranged from about 8 to 18 mg/L with the highest TSS average between the two months occurring at location AL-4. TSS at all points meets the quality standard (20 mg/L). pH: measurements ranged from about 8.1 to 8.3, which meet the quality standard (7 to 8.5). Salinity: measurements ranged from 31.1 to 32.2% in March, higher than the water measurements were relatively lower in June 27.7 to 29,8%. The salinity of the water meets the quality standard.
DO: measurements ranged from 6.07 to 7.54 mg/L with the lowest DO located at AL-6, west of the power plant outfall. DO at all points meet the quality standard of greater than 5 mg/L.
BOD: measurements ranged from 1.190 to 2.381 mg/L in March with the highest BOD located at sample location AL-2, lower than the BOD levels in June with measurements ranging from 1.190 to 5.760 mg/L.BOD at all points meet the quality standard of less than 20 mg/L with the results indicating mostly clean water (<1mg/L) to slightly polluted waters (>2 mg/L) at AL-2 and AL-5. Hydrogen Sulfide (H2S): measurements ranged from <.002 to 0.5 mg/L with the highest sulfide
contained at location AL-2. H2S does not meet the quality standard of 0.01 mg/L at all points.
The high levels are likely the result of decomposing animal waste entering the river which discharges near the sampling point.
Other parameters: measurements of ammonia, phosphate, nitrate and cyanide at all points met environmental quality standards.
Baseline Seawater Quality for Dumping Area 5.7.3.2
Water quality measurements consist of pH, salinity, DO, and temperature in (2) points in the Bapang Coral area, eighteen (18) points in the dumping area, and ten (10) points in the surrounding area from the dumping site. The collection of water and bacteria data is important for the analysis of the chemical content of water (e.g. the Nitrates and Nitrites). The collection of seabed conditions by visual observation was performed to find out the actual condition of the dumping area, outer dumping area, and Bapang Coral reef. The divers observed the seabed by using video surveillance and photo documentation at 150 observation points with a varying depth of 33-45 meters.
The pH is in accordance with the standard and do not show any high acidity or low acidity in all sampling locations.
5.7.4 Groundwater Quality
Groundwater Quality at Power Plant Site 5.7.4.1
Groundwater sampling was taken from wells surrounding the site and analyzed for various water quality parameters. Groundwater is used by residents surrounding the site for various activities including those related to agriculture. Groundwater is collected during the design phase to observe any anthropogenic substances such as oil and grease already existing in the wells prior to the operation of the power plant project.
According to Indonesian Regulation, the groundwater is classified as quality class No. 416/1990. Most of the physical and chemical quality of the well water is still good except pH at AT-2 and AT-3 which shows more acidity. Exceedances of triggered values imply further investigations and a case-by-case study. The results are summarized below:
The groundwater samples taken were clear, tasteless, and odorless. There is also an extremely high level of total coliform at AT-3 and AT-4. Otherwise the results indicate normal conditions. The groundwater is generally used for daily residential needs such as drinking water, water for cooking and washing.
Turbidity was well within the Indonesian standard.
TDS ranged from approximately 74 to 332 mg/L. TDS on all points meet the standard of 1,500 mg/L.
Temperature ranged from around 28 to 29°C with the air temperature around the sites from 28.6 to 31.9°C. The water temperature meets the quality standard.
pH ranged from 5.2 to 6.9 pH. The points AT-2 (5.2) and AT-3 (5.2) were more acidic which means they do not meet the quality standard ranged of 6.5 to 9.
CaCO3 ranged from 64.76 to 79.00 with the highest hardness at AT-4 and meets the
quality standard.
Chlorine ranged from 6.589 to 53.11 mg/L with the highest chloride at AT-4 and meets the quality standard.
Nitrate ranged from 0.879 to 7.530 mg/L with the highest nitrate at AT-4 and meets the quality standard.
Nitrite ranged from 0.002 to 0.03 mg/L and meets the quality standard.
Cyanide was less than 0.002 mg/L at all points and meets the quality standard.
Anion surfactants/detergents MBAs: were less than 0.010 mg/L at all points.
KMnO4 ranged from 1.877 to 2.563 mg/L with the highest organic matter at AT-4.
Metal parameters measured were Hg <0.001; AS <0.003; Fe <0.010; Cd <0.005; Cr VI <0.001; Se <0.002; Pb <0.030; Zn <0.010 to 0.016, and Mn <0.010 to 0.102 mg/l. Each parameter at all sampling points meets the quality standards for their respective metals. Total coliform ranged from 0 to 18,000 Jml/100 ml with the highest total coliform found
Groundwater Quality at the Ash Disposal Area 5.7.4.2
Groundwater samples were taken from five locations from May 17th to May 29th, 2015.
There are 33 parameters that were analyzed during the ground water baseline study for the landfill permit. During a site verification meeting with KLH in Feb 2016, KLH informed BPI that the landfill permit application for the Project shall comply with new Landfill regulation. According to the new draft regulation that is going to be released by the Ministry of Environment and Forestry, parameters containing the highest levels from the groundwater baseline study need to be used to conduct periodic monitoring during the operation stage. This condition is included within the final approval of the permit by KLH and will be upheld.
5.8
Noise
Baseline noise was measured at 12 different locations. The ambient noise levels in the area are currently affected by transportation vehicles such as cars and trains. Accordingly, as part of the baseline studies, the ambient noise levels at the Project site were measured.
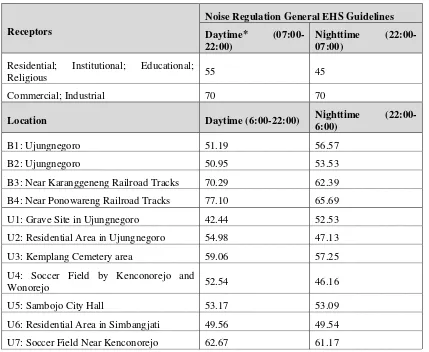
The measured daytime noise levels range from 42.44 dB(A) to 77.10 dB(A). The nighttime noise levels range from 44.34 dB(A) to 65.69 dB(A). Detailed results are indicated Table 5-2 below and are compared to both Decree of Minister of Environmental Affairs No. 48 of 1996 and EHS Guideline Standards.
Table 5-2: IFC Noise Standards compared to Baseline Results
Receptors
Location Daytime (6:00-22:00) Nighttime
(22:00-6:00)
B1: Ujungnegoro 51.19 56.57
B2: Ujungnegoro 50.95 53.53
B3: Near Karanggeneng Railroad Tracks 70.29 62.39
B4: Near Ponowareng Railroad Tracks 77.10 65.69
U1: Grave Site in Ujungnegoro 42.44 52.53
U2: Residential Area in Ujungnegoro 54.98 47.13
U3: Kemplang Cemetery area 59.06 57.25
U4: Soccer Field by Kenconorejo and
Wonorejo 52.54 46.16
U5: Sambojo City Hall 53.17 53.09
U6: Residential Area in Simbangjati 49.56 49.54
U8: Ponowareng City Hall 55.86 44.34
[*Daytime EHS regulation is the same as the National Standard (no difference in time) (KEP-48/MENLH/11/1996)]
As indicated in above, the results of noise monitoring at the twelve (12) noise measurement locations show four (4) locations with noise levels (Lsm) above the national quality standard. The locations include near the railroad tracks (70.29 and 77.10 dB(A)), the Kemplang Cemetery (59.06 dB(A)), and the Soccer Field in Kenconorejo Village (62.67 dB(A)). High noise levels at these sites are from activities associated with transportation. The noise source in Ponowareng (B4) comes from passing trains. By the Cemetery (U1) and Kenconorejo (U7), the measurement location is next to the main village road which has a high level of noise from a passing motor vehicles. Details regarding additional exceedances are below:
• B1: The night time exceedances are due to the presence of the Atlas Beetle (Chalcosoma atlas). This insect is nocturnal and only appears during sampling segment 6 (L6)) from 12:00 am until 3:00 am with a noise emission of 59.70 dB(A), thus causing the average noise to be 56.57 dB(A).
• B3 and B4: The noise exceedances are due to the trains passing through.
• U3: The daytime exceedances are caused by traffic as the road near the cemetery is a public road and is used constantly during the day. For the nighttime exceedances, the results are influenced by nightly celebrations, such as Karaoke, that carries on from 6:00 pm until 12:00 am in front of the cemetery area.
• U7: This field is located near a public access road and both the daytime and nighttime noise exceedances are caused by passing cars, trucks, and motor bikes.
• U8: The village hall is a public service area that maintains a high concentration of activity during the day, thus causing daytime exceedances.
The general EHS standards are more stringent than the National Indonesian Standards. The ambient noise sampling results above meet the EHS daytime noise standards of 55 dB(A) and all the relevant Indonesian standards. However, the EHS standard for night time noise of 45 dB(A) limit is exceeded.
5.9
Geology and Soil Quality
5.9.1 Geology
The geological structure in the area consists of fold and ungrowing fault. This condition is supported by the tectonic order of the Java Island region with a subduction zone at the south.
The Project site area is located in the coastal-alluvial plain which is usually occupied by disintegrated fluvial and marine deposits. However, locally in the northwestern part of the Karanggeneng site, there is a solitary hill formed by volcanoclastic deposits such as volcanic breccias and tuff.
The lithology of the region can be divided in the rock units described below in order of old to young:
The outcrop of tuffaceous sandstone has a brownish red/reddish grey color. This unit belongs to the Tapak Formation from the Tertiary Product Unit (Pliocene) and is identified as the oldest sedimentary product in the area.
b. Welded Breccia from Tertiary Product Units
This breccia is a brownish yellow color consisting of andesitic/basaltic fragments. The fragments are grey to red in color consisting of iron oxide cement matrix. This unit belongs to the Tapak Formation from the Tertiary Product Unit (Pliocene).
c. Tuffaceous Sandstone from Tertiary Product Units
The outcrop of tuffaceous sandstone is white to brownish in color and contains quartz and plagioclase. This unit belongs to the Tapak Formation from the Tertiary Product Unit (Pliocene) and is distributed on the southern part of the region.
d. Agglomerate from Quaternary Product Units
Agglomerate is pebble to boulder grained with a dark color. The fragments indicated andesitic/basaltic grains. This unit belongs to the Ligung Formation from the Quaternary Product Units (Pleistocene). This unit is able to transmit water in the field due to its high porosity and fracture system.
e. Volcanic Breccia from Quaternary Product Units
Volcanic breccia is brownish in color with a fine grained fragment which indicates andesitic/basaltic and pebble to boulder grained matrix. It is locally covered by alluvium/soil. This unit belongs to the Ligung Formation from the Quaternary Product Units (Pleistocene).
f. Sandy Soil from Old Alluvial Deposits
This soil is fine to coarse grained, dark brown in color, consists of andesitic/basaltic rock fragments, and locally shows discontinuous iron bedding.
g. Modern Soil from Coastal-Alluvial Deposits
This soil is coarse grained, brownish/reddish brown in color, and consists of andesitic/basaltic rock fragments.
5.9.2 Soil Quality
Subsurface soil investigation of the Project site area was performed by PT Geomarindex in December 2010. A total of 33 borings were drilled onshore and 23 borings were drilled offshore. Onshore boring areas included the power block area, coal yard area and other areas. Offshore borings included the jetty, intake pipe and discharge pipe areas. Additional 5 onshore and 3 offshore borings were drilled in April 2013. Onshore borings were in solid waste disposal area and turbine building area. Offshore borings were in jetty area and intake area.
5.10
Flora and Fauna
The total of flora and fauna recorded during the primary data collection process were 64 flora species and 149 fauna species. Among all the flora species detected, there were 33 trees, 30 pillars, 29 stakes, and 28 seedlings recorded. The total fauna comprised of 70 bird species, 5 mammal species, 18 reptile species, and 56 invertebrates species.
Overall, the majority of the land, according to Performance Standards 6, would be classified as modified-land. The animals that settled there are a result of human-induced impacts on the land and, therefore, would not be considered native species. The evaluation also considered any local land use, river estuary ecosystem, coral reef ecosystems, terrestrial fauna, and marine biota.
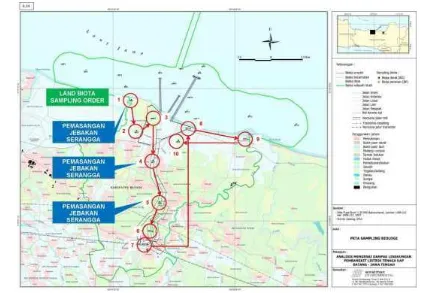
5.10.1 Overview of Terrestrial and Coastal Flora
Figure 5-2: Terrestrial and Coastal Flora
• Agriculturally Farmed Land: technical/non-technical paddy fields, Jasmine orchards, mixed orchards and fisheries;
• Parklands; and
• Coastal: the Marine Conservation Area, river estuaries, coral and mangrove ecosystems.
5.10.2 Agricultural Land Use
A baseline study was conducted to collect data and assess the flora within the Project area. An Importance Value Index was documented for the leading species. Importance Value is a measure of how dominant a species is in a given area. It is a standard tool used to inventory an area. 64 different types of vegetation was observed and documented to exist as a Tree, Pole, Sapling or Seedling.
The trees found with the Top Importance Value Index (IVI) included: the coconut tree (Cocos nucifera) with an IVI of 66.12%, Cocoa (Theobroma cacao) with an IVI of 54.26%, Silk tree (Albizia falcataria) with an IVI of 49.64%, Jack fruit (Atrocarpus integra) with an IVI 18.49%, West Indies Mahogany (Swietania mahogani) with an IVI of 13.30%, Rambutan (Nephelium lappaceum) with an IVI of 11.24%, Kapok Tree (Ceiba pentandra) with an IVI of 9.24%, Durian tree (Durio zibethinus) with an IVI of 7.87%, Weeping fig (Ficus benjamina) with an IVI of 6.92%, and the Banana tree (Musa x paradisiaca) with an IVI of 6.31%. The cocoa and silk tree species had a high density, frequency, and dominance, and they were constantly found in every observational location except in coastal and rice field areas.
The pole habitat contains 10 species with large IVI. Those poles are the cocoa species (Theobroma cacao), Silk trees (Albizia falcataria), Banana trees (Musa x paradisiaca), West Indies Mahoganys (Swietania mahogani), Jack fruit trees (Atrocarpusintegra), Rambutan trees (Nephelium lappaceum), Bamboo trees (Bambusa sp.), White leadtrees (Leuchaena glauca), Sugar-apple trees (Anona squamosa), and Flamboyant trees (Delonix regia). The Durian pole (Durio zibethinus) was found in numerous locations and is one of the most popular pole species planted. However, it cannot be planted regularly like the silk, coconut, or cocoa pole. The Durian species is a very useful source of food and income. This species was frequently found in plantation areas or in the yard in both tree habitats (IVI = 7.869) and pole habitats (IVI = 1.9).
The top seedling species found with large IVI include the Blady grass species (Imperata cylindrica), Costus megalobrachtea, Achasma megalocheilus, Banana tree (Musa paradisiaca), Cocoa (Theobroma cacao), Arabian jasmine (Jasminum sambac), Ipomea pes-caprae, Cyperus kyllingia (Kyllinga monocephala), Papaya (Carica papaya) as well as 18 other species.
5.10.3 River Estuary Ecosystem
Figure 5-3: River Estuary Ecosystem
The mangroves that were identified are categorized into major, minor, and associative groups. Three species of major mangrove were identified in Batang particularly in the Regional Marine Conservation Area. Two species of minor mangroves and ten associated mangroves were also found.
Based on the baseline observations conducted, the condition of the mangrove vegetation along the Project site shoreline of the study location resides predominantly in the western coast of the shore line.
• The kind of mangrove roots (Rhizophora) have as much as 6 individual poles with an IVI of 3.63% and diversity (H') of 0:07; and
• Saplings have as much as 1 individual level with an IVI of 1.92% and diversity (H') of 0.02.
Additional types of coastal vegetation (mangrove associates) that were found are:
• Bastard poon tree (Sterculia foetida) with IVI 1.77% and diversity index (H') 0.01%;
• Cornbeefwood (Barringtonia) from pole stage IVI 2.57% with diversity index (H’) 0.04;
• Beach sheoak (Casuarina equisetifolia) pole stage IVI 2.94% and H’ 0.05; and were
found in the sapling stage with an IVI of 1.93% with H’ 0.02;
• Tropical almond (Terminalia catappa) in the tree stage with an IVI of 3.37% and H’
0,07; from pole stage IVI 2.24% with H’ 0.03; and from sapling stage IVI 4.63% with H’0.06;
• Ipomea (Ipomoea pes-caprae) with an IVI of 6.95 % and diversity (H’) 6.95.
Figure 5-4: Mangroves Found Near Points 1, 8 and 9
A secondary review done by Dinas Kelautan and Perikanan Kabupaten Batang (Marine and Fishery Services of Batang Regency) of Central Java in 2011 concludes that the mangroves on the northern coast of Central Java cover an area of 2,458.39 hectares traversing from the coast of Rembang Regency to Brebes Regency. The Batang Regency has a total mangrove coverage of 65.85 hectares. However, the mangrove areas in Batang only make up 2.68% of the total population.
5.10.4 Coral Reef Ecosystem
The coral reef ecosystem is a unique ecosystem with a high diversity value and must always be preserved for their ecological and economic values. Coral Reefs surrounding the proposed site area are preserved in the Coastal Park Ujungnegoro – Roban (KP3K).
Batang spans coastal and oceanic areas. Its coastline stretches over 38.75 km in length and 4 miles in width, encompasses waters with an area of 287.06 km2, and covers thirteen (13) coastal villages. Within the villages, there are unique reef ecosystems or rocky shore/massive coral reefs. The ecosystems are as follows:
• Ujungnegoro with a coastline extending across 1.3 km; and
• Celong with a coastline extending across 5 km.
where virtually all coral reefs thrive in waters having boundaries of a 20°C surface isotherm. Hermatypic coral can survive for some time at temperatures slightly below 20°C, but no coral reefs will flourish at a mean annual temperature that is lower than 18°C. The most optimum growth of coral takes place in waters with an average annual temperature between 23°C and 25°C. Coral reefs, however, can tolerate temperatures from 36°C to 40°C. The depth is also significant because they cannot develop in waters at depths that are greater than 50 to 70 meter. Most of them develop at the depth of 25 meters or less. Different types of coral reefs are generally grouped into three (3) categories; atoll, barrier reefs, and fringing reefs.
The coral reef ecosystem is important to evaluate because several areas surrounding the site are under legal protection from the Indonesian government. The identification of the coral and its condition is an important aspect to analyze when establishing relevant mechanisms for external review of the Project’s risks and impacts identification process and proposed mitigation measures.
Coral reefs at the Project site are found in a number of spots with dead and weakening conditions. The locals are quite familiar with the different coral reefs in the area. Their names in order from west to east along the KP3K coast: Maeso, Pancer Darat Coral, Pancer Coral, Angrik Coral, Wuluhan Coral, Jojogan Coral, Guo Coral, Kepuh Coral, Kembar Coral, Ipik Coral, and Kretek Coral. The Karang Bapang coral reef also exists at the dredging dump site.
Only one of the existing Coral Communities is thriving although it has low diversity: the Kretek Coral. The coverage of hard corals is 6%. The only type discovered through a transect is Porites Lobata, hard coral with massive and sub-massive forms of growth. Beyond transect, a little amount from the Faviidae family, namely Favites species, is also found in a form of growth. The largest composition is Rock, which is dead coral (the origin is unidentifiable) that has been covered by algae. It is referred to as Dead Coral with Algae (DCA). Other dominant substrate is sand. The only abundantly found forming substance of coral reef is Sponge, a filter feeder organism that can survive, and often found in, waters having high rates of sedimentation.
The environmental quality of Ujungnegoro’s coastal areas has been impaired from sedimentation and abrasion. Despite the less considerable environment for coral reefs to thrive, there is an Coral as a “core zone”. It is suggested in the review of Ujungnegoro-Roban Sea Conservation area which was endorsed by Marine and Fishery Agency of Batang Regency to downgrade its status from Core Zone (fully protected) to Limited-Use Zone for Protection and Development of Biota Population (ZLP2B). ZLP2B should be focused on enhancing and promoting the restocking and stock enhancement or Fisheries Refuges. The major threat of sedimentation and fish net/fishing tools should be addressed by artificial coral reefs as protection.
serious sedimentation. However, with its close position to mainland, it eases the ability to monitor the reef’s condition.
Coral Reef Ecosystem Near Dumping Area 5.10.4.1
The CFPP construction phase will require extensive dredging and excavation at the Project site location. To mitigate the disposal of excess materials extracted from dredging, the Project proposed a dumping location approximately 16 km offshore. The bottom substrate conditions of the observation points at the Dumping Area, Outer Dumping Area and Bapang Coral ecosystem are entirely covered with mud. Mud on the bottom substrate rarely includes a living biota and is commonly barren. This condition is very different with the bottom substrate of a coral reef ecosystem that has various marine organisms and fish. Thus, the baseline studies did not find live coral reef ecosystem at the observation location of the dumping area. Several aspects could cause the absence of coral reefs including:
1. Mud on the bottom substrate: Coral reefs live in areas with a solid bottom substrate and on grounds that are not easily shifted. Bottom substrate at the Dumping Area and Outer Dumping Area contains mud that is easily stirred if exposed to currents or from fishing gears such as beach seine and trawl. Planula would not survive on the bottom substrate. Moreover, mud on the bottom substrate is easily stirred and could clog feeding structures for corals (Nybakken, 1992).
2. Depth and sunlight penetration: Coral reefs can only live at certain depths, mainly in a 25 meter depth or less. The depth is related to sunlight penetration capabilities and the ability to reach the coral reef. Zooxanthela, single cell algae, needs sunlight to be symbiotic with coral reefs in order to carry out photosynthesis. Not enough sunlight can lower the rate of photosynthesis along with the coral reefs ability to produce calcium carbonate. Thus, the ability for coral reefs to form and grow will be reduced exponentially as the sunlight penetrates less. The Dumping Area and Outer Dumping Area observation points have sunlight penetration levels of 8.5 to 18.68 meters for waters that are 34 to 40 meters deep. These conditions are not conducive for coral growth. 3. Salinity: Coral reefs typically live at the normal range of salinity of 32% to 35%
(Nybakken, 1992), but coral reefs can also live at high levels of salinity of 42% (e.g. in the Persian Gulf). Several observation points at the Dumping Area and Outer Dumping Area have level of salinity below normal.
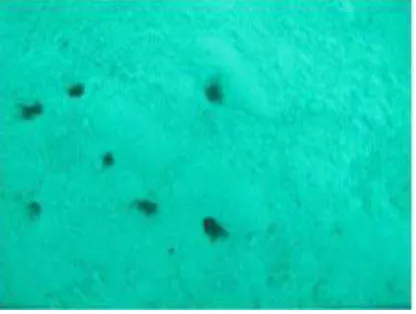
Figure 5-5: Holes Found in the Seabed
The dumping area, the outside dumping area, and the area around Karang Bapang have the following characteristics:
The sea floor’s substrate is muddy with big and small holes above floor’s substrates.
No coral reefs or protected marine biota were found.
Marine biotas found on the surface of the sea floor’s substrates are Goby Fish (Ctenogobiops aurocingulus), Star Fish (Asteria sp), Tube Anemone (Cerianthus Sp), Sand dollar (Laganum Sp), Sea pen (Pennatula Sp), and Pig Hair (Diadema setosum). Marine biotas living under the floor’s substrates are worms (polychaeta) and shells
(bivalve).
Small fish (Stolephorus Sp) and cob fish (Euthynnus spp.) are rare but were found one time.
At the three locations, traditional fishermen were seen using fishing gear including arads and cantrangs.
The results of the survey for the area surrounding the Bapang coral reef system are summarized below.
Q1 point: is a point around Bapang Coral Reef with a depth of 34 m. The ocean floor here receives very little sunlight. Substrates at the ocean floor are easily mixed mud. Neither coral reefs nor marine life were found at the ocean floor.
Q2 point: The pH at Q2 has a pH of 8.38 and is in accordance with the Decree of the Minister of the Environment No 51/2004 annex 3 on standard of seawater for marine biota. That means that there is minimal influence from other chemical factors that affects the seawater’s pH (thus, becoming too acid or too basic). A coral reef can tolerate temperatures in the range of 36°C to 40°C; as such, it is still possible for coral reefs to grow here. However, there is no coral found at this location. This is due to the substrate’s muddy condition and the deep depth reaching 45 meters. No fish were seen and no fishermen’s activity was seen around this point.
penetrating sunlight and the muddy substrate conditions. There were 6 fishermen’s boats operating near this point at a distance of less than 800 m east of Q3. An additional boat was also seen at a distance of 400 m north of Q3.
Q4 point: conditions are similar to Q3 point. The ocean floor’s condition was relatively muddy. No coral reefs were found and fish were observed during the sampling period.
5.10.5 Overview of Terrestrial Fauna
The region has been settled on for centuries and has become a farming community with agricultural industries that include chicken farming, raising livestock, and fishing.
The results of the baseline studies indicate that there are “protected species” (according to Indonesian Regulation No. 7, 1999) as well as species that are identified under the IUCN Red list under the “near threatened” and “least concern” categories in the area. The IUCN Red list is referenced under Performance Standard 6: Biodiversity Conservation and Sustainable Management of Living Natural Resources. The Central Java site is considered a modified habitat.
Birds 5.10.5.1
The Central Java region is home to thousands of birds with 70 different species recorded during the faunal study period. There were two (2) types of birds that are identified as “near threatened” under the IUCN Red list, and fourteen (14) “protected species” identified on a list under Indonesian National law PP No. 7 of 1999.
The values of the bird diversity index, indicated in the collected data revealed that H' is 2.595 and Σ is 0.611. This means that the diversity of the bird species is and its similarity is stable. Although the number of birds encountered is relatively diverse, the dominating population of one species in particular, the Cave Swiftlet, is affecting analysis results. The domination of one species could happen when there are limited resources, or when a species has a rapid reproduction rate.
The Cave Swiftlet (Collocalia linchi) species recorded a total of 595 birds during the study period. Encounters with this bird occurred at every observation location with a predominant number found in locations TB 3 and 4. The Olive-backed Sunbird (Nectarina Juncidis) and Javan Munia (Lonchura leucogastroides) were also the most common types of birds that could be seen in the secondary crop fields and wild bushes.
Of the 70 bird species that were found, 14 bird species are protected under the Government Regulation Number 7 Year 1999 and 2 bird species were identified on the IUCN Red list under the “near threatened” category.
Details on the two types of birds identified as “Near Threatened” are as follows:
1. Oriental Darter (Anhinga melanogaster): This bird prefers mangroves, lakes, swamps, and river estuaries. Its dispersion pattern is endemic, spanning across Southeast Asia. The mating season is between December to March and in some areas from March to June, which is the wet season and the beginning of the dry season.
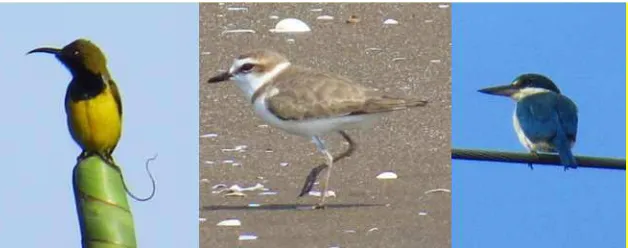
2. Javan Plover (Charadruis javanicus): This bird typically lives on the shoreline within a small group. They prefer open coastal regions, sandy beaches, and swampy estuaries. The bird has been identified in various regions in Indonesia (i.e. Sumatra, Sumbawa, Flores, Sulawesi, Bali and Kangean) and is, therefore, endemic to Java Island. The nesting periods vary depending on the microclimate and food availability. However, they predominantly nest during January-October in West Java and April-May in Central and East Java.
The fourteen (14) “protected species” identified on a list under Indonesian National law PP 7, 1999 are as follows:
1. Oriental Darter, Anhinga melanogaster; 2. Black Eagle, Ictinaetus malayensis; 3. Javan Kingfisher, Halcyon cyanoventris; 4. Collared Kingfisher, Todirhamphus chloris; 5. Cerulean Kingfisher, Alcedo coerulescens; 6. Blue-eared Kingfisher, Alcedo meninting; 7. Little Egret, Egretta garzetta;
8. Pacific Reef Heron, Egretta sacra; 9. Cattle Egret, Bubulcus ibis;
10.Intermediate Egret, Egretta intermedia; 11.Pied Fantail, Rhipidura javanica; 12.Curlew, Numenius sp;
13.Olive-backed Sunbird, Nectarinia jugularis; and 14.Brown-throated Sunbird, Anthreptes malacensis.
Mammals 5.10.5.2
The surveyors did not observe many mammals surrounding the proposed site due to the agricultural modification to the land and the heavy residential presence. The habitat lacks a suitable location for local mammals both large and small. There were 5 species of mammals spotted during the assessment process.
All five species were listed in the IUCN Red list under the “Least Concern” category. These species were most likely not native to the land and mostly inhabit the land because they thrive off of the agriculturally farmed land. The five species are the the Banded Linsang (5), the Small Asian Mongoose (1), Ricefield Rat (6), Plantation Squirrel (4) and Three-striped Ground Squirrel (1). Of the five species, the banded linsang and the three-striped ground squirrel are also listed as protected fauna under Indonesian National Law.
The rice-field rat species are smaller than brown rats (Rattus norvegicus). Based on additional information collected from interviews, the rice-field rats are frequently found when the rice (Oryza sativa) starts to yellow, causing these rice-field rats to become pests to the farmers. There were fewer encounters with the rice-field rats because the rice-field was not turning yellow during the survey process.
The Banded Linsang species is yellowish white with brownish-black spots, slender with a conical head, and its stripes extend along its upper neck. Its body is 350 to 411 mm in length with a tail that is 295 to 363 mm long and typically weighs 598 to 798 grams. Direct encounter with Banded Linsangs occurred at locations which are close to coast and plantation areas but far from the residential areas.
The Plantain squirrel species is a small diurnal (active in daylight), arboreal mammal. There were direct encounters with 2 Plantain squirrelsThey were found in a coconut plantation. Based on information collected from interviews, plantain squirrels are hunted for food which could be the reason for the limited numbers of the Plantain squirrels in the study area.
The Mongoose has a body that is covered with a brown pelag and similar in size to a cat’s body. The Mongoose were found in TB 1 and TB 4 (those that were found in TB 4 were dead). The mongoose typically eats crabs, snakes, birds, and chickens. This diet makes Mongoose a pest to chicken farmers and residential chicken owners.
The three-striped ground squirrel species was observed. A direct encounter with this mammal was made in TB 9. The small number of three-striped ground squirrel may be due to hunting activities. According to the local people, this squirrel meat is very desirable to consume.