Indonesian Journal of Geography Vol. 49, No.1, June 2017 (1 - 10)
DOI: http://dx.doi.org/10.22146/ijg.11821, website: https://jurnal.ugm.ac.id/ijg © 2017 Faculty of Geography UGM and he Indonesian Geographers Association
Spatial Temporal Analysis of Urban Heat Hazard on Education Area
(Univer-sity of Indonesia)
Adi Wibowo, Jarot Mulyo Semedi and Khairulmaini Osman Salleh
Received: 25 06 2016 / Accepted: 23 01 2017 / Published online: 31 06 2017 © 2017 Faculty of Geography UGM and he Indonesian Geographers Association
Abstract As education area, campus or university is full with various activities which have an impact on the existence of land-use or land-cover. he variation of activities dynamically change the shape of land-use or land-cover within the campus area, thus also create variations in Land Surface Temperature (LST). he LST are impacting the coziness of human activity especially when reaches more than 30 oC. his study used the term Urban Heat Signature (UHS) to explain LST in diferent land-use or land-cover types. he objective of this study is to examine UHS as an Urban Heat Hazard (UHH) based on Universal Temperature Climate Index (UTCI) and Efective Temperature Index (ETI) in University of Indonesia. hermal bands of Landsat 8 images (the acquisition year 2013-2015) were used to create LST model. A ground data known as Air Surface Temperature (AST) were used to validate the model. he result showed an increased level of maximum temperature during September-October since 2013 until 2014. he maximum temperature was reduced in October 2014, however it increased again in August 2015. he UTCI showed “moderate” and “strong heat stress”, while EFI showed “uncomfortable” and “very uncomfortable” categories during that period. his research concluded that build up area in UI Campus highest temperature on UI campus based on UHS. Range UHS in Campus UI on 2013 (21.8-31.1oC), 2014 (25.0-36.2oC) and 2015 (24.9-38.2oC). his maximum UHS on September (2014 and 2015) put on levelling UTCI included range temperature 32-35oC, with an explanation of sensation temperature is warm and sensation of comfort is Uncomfortable, Psychology with Increasing Stress Case by Sweating and Blood Flow and Health category is Cardiovascular Embarrassment. his UHS occurs in September will give impact on psychology and health, that’s become the UHH of the living on education area.
Abstrak Sebagai kawasan pendidikan, kampus atau universitas memiliki berbagai jenis aktivitasi yang mungkin ber-dampak pada keberadaan penggunaan atau tutupan lahan. Variasi dari aktivitas tersebut secara dinamis dapat merubah bentuk dari penggunaan atau tutupan lahan di dalam kawasan kampus, yang secara langsung juga dapat berdampak pada variasi Suhu Permukaan Tanah (SPT). SPT akan berdampak pada kenyamanan aktivitas manusia terutama pada saat suhu mencapai lebih dari 30 oC. Istilah Urban Heat Signature (UHS) digunakan dalam studi ini untuk menjelaskan perbedaan SPT pada jenis penggunaan atau tutupan lahan yang berbeda. Tujuan dari studi adalah untuk memeriksa UHS yang dikategorikan sebagai Bahaya Panas Perkotaan atau Urban Heat Hazard (UHH), yang berdasarkan pada Universal Temperature Climate Index (UTCI) dan Efective Temperature Index (ETI) di lingkungan kampus Universitas Indonesia. Saluran thermal pada citra Landsat 8 (periode pengambilan 2013-2015) digunakan untuk membuat model SPT. Data lapangan atau Suhu Udara Permukaan (SUP) digunakan untuk menguji validitas dari model SPT. Hasil pengolahan data memperlihatkan kenaikan suhu maksimum selama September-Oktober sejak 2013 hingga 2015. Terjadi penurunan suhu maksimum pada Oktober 2014, akan tetapi kembali meningkat pada Agustus 2015. Hasil UTCI memperlihatkan kategori “sedang” dan “tekanan panas kuat”, sementara EFI memperlihatkan kategori “tidak nyaman” dan “sangat tidak nyaman” pada periode tersebut. Penelitan ini berkesimpulan bahwa wilayah terbangun di Kampus UI memiliki suhu terpanas ber-dasarkan UHS. Rentang UHS di Kampus UI tahun 2013 (21.8-31.1oC), tahun 2014 (25.0-36.2oC) dan tahun 2015 (24.9-38.2oC). Suhu Maksimum terjadi pada bulan September (2014 dan 2015) yang menyebabkan level UTCI termasuk rentang 32.0-35.0oC, dengan penjelasan untuk sensasi temperatur termasuk panas dan sensasi nyaman termasuk tidak nyaman, psikologi termasuk peningkatan stress karena berkeringatdan aliran darah dan kesehatan termasuk Cardiovascular Em-bararasment. UHS yang terjadi pada bulan September akan berdampak pada keadaan psikologi dan kesehatan, hal ini menjadikkan UHS sebagai UHH pada area pendidikan.
Keywords: Education Area, Spatial Temporal Analysis , Urban Heat Hazard.
Kata kunci: Analasis Spasial-Temporal, Area Pendidikan, Bahaya Suhu Perkotaan
1.Introduction
Urban heat is a normal phenomenon in the urban area. It is a consequence of urbanization process [Mirzaei & Haghighat, 2010], where air temperatures in
densely built cities are higher than the suburban rural areas [Wong & Chen, 2005]. Others deined urban heat as a phenomenon of rising air temperature in urban settings [Ichinose et al, 2008; Kim & Baik, 2005]. Urban heat has a strong relation with land use/land cover. he Land cover had the ability to absorb and reradiate sunradiation to generated urban heat [Wong & Chen, 2005; Srivanit & Hokao, 2013].
Diferent type of cover will have a diferent level of emitted heat energy. Previous studies have proved the relationship between a pattern of urban heat and land
Adi Wibowo, Jarot Mulyo Semedi
Department of Geography, Faculty of Mathematics and Natural Sciences, Universitas Indonesia.
Adi Wibowo, Khairulmaini Osman Salleh
Department of Geography, Faculty of Arts and Social Sciences, University of Malaya, Malaysia.
use/land cover changes [Kim & Baik, 2005; Chen et al., 2005; Memon et al., 2009; Ichinose et al., 2008 Mirzaei & Haghighat, 2010]. In general, an urban land cover can be associated with buildings, road pavement, highways, green parks and also bare soil [Ahmad & Hashim, 2007; Steeneveld et al., 2014; Rena et al., 2012, Lenzholzer & Brown, 2013].
Urban Heat Signature (UHS) explains the heat characteristics of a certain land cover measured from a diferent period of time. Although it is a natural phenomenon in an urban area, UHS could become a threat in tropical cities, especially when the temperature was more than 30 oC [Tursilowati, 2008; Ichinose et al., 2008; Tursilowati et al., 2012]. he simple UHS can be explained from a diferent temperature between built-up area and surface with vegetation. he built-up surface in an urban area is related to high temperature [Tran et al, 2006; Taha, 1997], while the vegetated surfaces with moist soil might usually have around 18 oC for its temperature [Gartland, 2008].
Urban temperatures have been measured employed data from a range of satellite sensors, medium spatial resolution thermal images provided by the Landsat [Tran et al. 2006; Kuşcu and Sengezer 2011]. his Temperature information provides a powerful way to monitor urban environment [Asmat et al, 2003]. Land Surface Temperature (LST) or UHS collected from land surface temperature generated by acquisition thermal infrared (TIR) band from satellite image [Wong & Chen, 2005; Wong et al, 2007; Mallick et al, 2008; Tursilowati, 2008; Mirzaei & Haghighat, 2010; Tursilowati, et al, 2012, Wibowo, et al, 2013; Weng & Gao, 2014; Rozenstein et al., 2014]. he variation of UHS used analysis spatial-temporal [Tran et al, 2006; Wong et al, 2007; Wong & Jusuf, 2008; Srivanit & Hokao, 2013] to generated spatial pattern related the highest vegetation cover with low temperature and without vegetated cover with the highest temperature [Wong et al., 2007; Wong & Jusuf 2008; Srivanit & Hokao, 2013]. he air surface temperature (AST) from survey based on land uses [Suzuki, 2008] and land cover [Oke, 2004] by mobile surveys with thermometric [Suzuki, 2008; Wibowo, et al, 2013], to generated validation of LST based on valued from predictor (LST) and actual (AST).
Environmental issues, for example, urbanize areas, had signiicantly higher midday surface temperature as compared to those of the surrounding rural relatively vegetated areas [Tran et al, 2006]. According to Chen & Edward [2012], urban heat has become serious in zones where inadequate shading and green spaces are unable to intercept and balance the heat from direct solar gains [Srivanit & Hokao, 2013]. Urban air temperatures can be on the average 2°C higher than rural areas [Taha, 1997] and the maximum surface temperature was also associated with the high-rise city core areas of an urban area [Tran H, et al, 2006]. According to Shahidan et al [2012] and Tran et al [2006], the highest outdoor thermal stress is observed during clear sunny days with a calm
wind in the summer season. However, in subtropical and tropical climate zones, the greatest thermal stress may occur during the yearly hot dry season at noon due to the greater solar radiation exposure throughout the year [Srivanit & Hokao, 2013].
Human bodies perform within an internal temperature range much narrower than external temperatures when external temperatures are high human may overheat or feel warm [Boduch & Fincher, 2009]. Urban heating causes many problems for the inhabitants of cities and areas, in particular, those with a tropical environment, included the deterioration of living environment [Memon et. al, 2009]. In addition, Chen and Edward [2012] addressed the typical use of dark materials in buildings and pavement collect and trap more of the sun’s energy and use of dark materials has led to increasing ambient air temperatures, reduces human comfort and produces many problems for urban inhabitants [Srivanit & Hokao, 2013]. High temperature, sometimes, gives damage to natural ecosystem in cities [Ichinose et al, 2008]. Furthermore, high temperature may increase the potential risk of ill-health for urban populations to thermal extremes [Yuan, et al, 2012]. Temperature is the most signiicant component to the experience of comfort in a space [Boduch & Fincher, 2009]. hat’s no doubt that temperature in an environment as importance to investigation and assessment as UHS in urban area impeding human comfort. More people are afected by higher temperatures for a longer period, make life uncomfortable for urban resident and adversely afect people’s health [Ichinose et al, 2008]. Comfortless in daily activities is a very importance of human live according to Koenigsberger’s said that comfort thermal for tropical area range between 22.0-27.0 0C [Karyono, 2001]. Lehman in 1964 said workers in tropical areas, not lassie, but they comfort drop cause hot climate in tropical areas [Setiono, et al, 1998]. he New Index called Universal hermal Climate Index (UTCI) for assessment scale by categorized in thermal stress (Sookuk et al, 2014) with four categories like Extreme Heat Stress (> +460C), Very Strong Heat Stress (+38 to +46 0C), Strong Heat Stress (+32 to +38 0C), Moderate Heat Stress (+26 to +32 0C) and No hermal Stress (+9 to +26 0C). he Efective Temperature Index (ETI) explain thermal with Level of Sensation Temperature by Comfort, Psychology and Health.
et al, 2007]. A green campus improved on university community’s well-being [Srivanit & Hokao, 2013]. Nowadays campus sustainability has become a major issue of global concern for university leaders (Suwartha & Riri, 2013) as they have realized that impact on university activities [Srivanit & Hokao, 2013]. Based on the background of this research, the University of Indonesia Campus in a tropical area is chosen as study region to answer the objective of this research. he objective of this research to examine a UHS as Urban Heat Hazard (UHH) with Universal Temperature Climate Index (UTCI) and Efective Temperature Index (ETI) in Campus.
2.he Methods
his study used thermal bands from Landsat 8 OLI-TIRS imagery. It is known that Landsat 8 OLI-OLI-TIRS imagery has two thermal bands (T1 and T2). Instead of using both thermal bands, the study used the 10th (or T1) band rather than the 11th band. According to Qin et al. [2015] used T1 band of Landsat 8 OLI-TIRS rather than T2, because T2 had large data uncertainty [Wang et al., 2016]. A 100x100 meter grid was used as a unit of analysis, which also has been utilized in a previous study [Suzuki, 2008; Oke, 2004, Qin et al., 2015]. he size of the grid was also being matched with a pixel size of Landsat 8 OLI-TIRS thermal band.
UHS was analyzed by observing LST in diferent land cover types and in diferent period of time. he LST data was derived from a thermal band. Landsat 8 OLI-TIRS path/rows no. 122/064 with cloud cover less than 10% were used in this study. he selected months were September-October for 2013 and 2014 and August-October for 2015 (Table 1). According to Srivanit & Hokao [2013], those were the months when the solar radiation exposure has greatly occurred.
he irst step is to a conversion LST from the thermal band by transforming digital number (DN) of the band to radian using Equation 1.1 below.
Lλ = (M*DN of Band10) + A (1.1)
where, Lλ is spectral radiance (wm-2sr-1μm-1), M is multiplicative digital number value at band 10, DN of Band 10 is Digital Number of Band 10 Landsat 8 OLI-TIRS and A is additive value of spectral radiance at band 10. he second step is to produce estimation of LST from the spectral radiance value using Equation 1.2, which has been performed by previous studies [Wong & Chen, 2005; Hernina et al., 2008; Tursilowati, 2008; Ichinose et al., 2008; Mirzaei & Haghighat, 2010; Tursilowati et al., 2012].
T=K2/ln ((K1/Lλ) +1) (1.2)
T is the temperature at the satellite sensor (Kelvin), K1 is the calibration constant 1 for Landsat 8, K2 is the calibration constant 2 for Landsat 8, and Lλ is the spectral radiance of band [modiication from Tursilowati et al., 2012]. he last process is conversion from Kelvin to Celsius using Equation 1.3 [Wibowo et al., 2013]. his result of LST also known as UHS.
Temp-CELCIUS = Temp-KELVIN - 272.15 (1.3)
he LST model was validated using ground data or Air Surface Temperature (AST). he AST were collected in October 2014. he AST data were collected from 14 points spread around campus area from north to south. he placement of the points was based on diferent land cover types such as buildings, dense vegetation cover and open space area in order to capture diferent variations of temperature (from high to low). RMSE were used to analyze the error of LST, using AST as observed data to examine the accuracy of the error.
More people are afected by higher temperatures for a longer period, not only make life uncomfortable for urban residents but also increased temperatures adversely afect people’s health [Ichinose et al, 2008]. he new index called Universal hermal Climate Index (UTCI) for assessment UHS behavior on 2013-2015. he UTCI had categorized in thermal stress with four category Extreme Heat Stress until No hermal Stress to detect the UHS on UI Campus, and then detect the UHS as Urban Heat Hazard in University Campus
Year Acquisition Date
2013 September (10/09/2013)
October (12/10/2013
2014 September (12/09/2014)
October (15/10/2014)
2015 August (31/08/2015)
October (02/10/2015)
Table 1. Landsat 8 OLI-TIRS imageries used in this study
Source : primary data processing
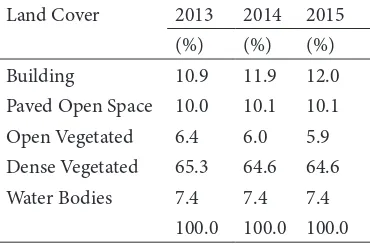
Table 2. Percentage Land Cover Types
Land Cover 2013 2014 2015
(%) (%) (%)
Building 10.9 11.9 12.0
Paved Open Space 10.0 10.1 10.1
Open Vegetated 6.4 6.0 5.9
Dense Vegetated 65.3 64.6 64.6
Water Bodies 7.4 7.4 7.4
100.0 100.0 100.0
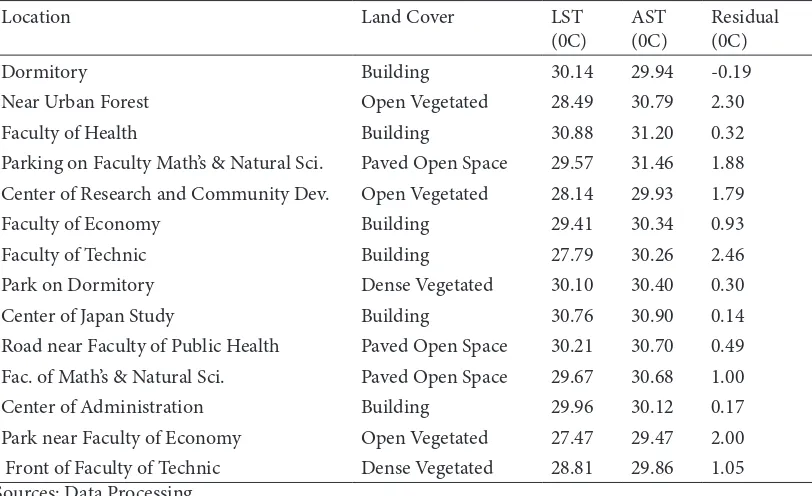
Table 3. Average AST in UI Campus on 13-17 October 2014 and LST 15 October 2014
Location Land Cover LST
(0C)
AST (0C)
Residual (0C)
Dormitory Building 30.14 29.94 -0.19
Near Urban Forest Open Vegetated 28.49 30.79 2.30
Faculty of Health Building 30.88 31.20 0.32
Parking on Faculty Math’s & Natural Sci. Paved Open Space 29.57 31.46 1.88
Center of Research and Community Dev. Open Vegetated 28.14 29.93 1.79
Faculty of Economy Building 29.41 30.34 0.93
Faculty of Technic Building 27.79 30.26 2.46
Park on Dormitory Dense Vegetated 30.10 30.40 0.30
Center of Japan Study Building 30.76 30.90 0.14
Road near Faculty of Public Health Paved Open Space 30.21 30.70 0.49
Fac. of Math’s & Natural Sci. Paved Open Space 29.67 30.68 1.00
Center of Administration Building 29.96 30.12 0.17
Park near Faculty of Economy Open Vegetated 27.47 29.47 2.00
Front of Faculty of Technic Dense Vegetated 28.81 29.86 1.05
Sources: Data Processing
Table 4. UHS Behavior in UI Campus on 2013-2015
UHS 2013 2014 2015
Sept 10/9/13
Oct 12/10/13
Sept 13/9/14
Oct 15/10/14
Aug/Sept 31/8/15
Oct 2/10/15
Maximum 30.1 31.1 36.2 33.1 38.2 32.6
Minimum 21.8 25.0 28.2 25.0 25.8 24.9
Mean 25.4 28.4 31.0 28.4 31.1 28.1
Std-Dev 1.8 1.8 1.7 1.8 2.5 1.5
Source: Data Processing
Table 5. Universal hermal Index (UTCI) in UI Campus
UTCI(0C) Stress Category 2013 2014 2015
10 Sept 12 Oct 13 Sept 15 Oct 31 Aug 2 Oct
Above + 46 Extreme heat stress 0 0 0 0 0 0
+38 to +46 Very Strong heat
stress
0 0 0 0 38.2 0
+32 to +38 Strong heat stress 0 0 31.1-36.2 31.1-33.1 31.1-38.0 31.1-32.6
+26 to +32 Moderate heat stress 27.0-30.1 27.0-31.1 27.0-31.0 27.0-31.0 27.0-31.0 27.0-31.0
+9 to +26 No thermal stress 21.8 25.0 0 25.0 25.8 24.9
Source: Analysis data
Table 6. Efective Temperature Index in 2013-2015 on UI Campus
2013 2014 2015
Tem-perature (0C)
SENSATION
10 Sept 12 Oct 13 Sept 15 Oct 31 Aug 2 Oct Temp. Comfort
>40 Very Hot Very Uncomfortable
MAX MAX MAX 35 – 40 Hot
MAX MAX 32 – 35 Warm Uncomfortable
MAX, MEAN
MAX, MEAN
MEAN MEAN 30 – 32 Slightly
Warm
MIN MEAN,
MIN
MIN MEAN,
MIN
MIN MEAN,
MIN
25 - 30 Neutral Comfortable
20 – 25 Slightly
Cool
Figure 3. UHS Behavior on September and October in 2014 at UI Campus
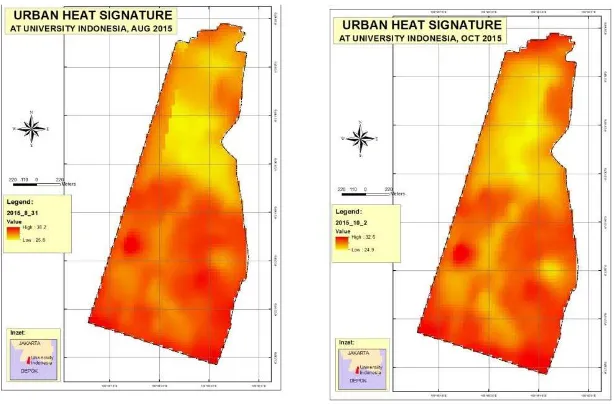
Figure 4. UHS Behavior on August/September and October in 2015 at UI Campus
used the EFI with a level sensation of temperature and comfort within the sensation of temperature level had a Verry Hot until Neutral and the level sensation of comfort had very uncomfortable until comfortable (Sookuk et al, 2014).
Remote Sensing (RS) and Geographic Information System (GIS) used in this research to explain the spatial-temporal variation of UHS. he analysis of UHS using spatial-temporal analysis, spatial analysis using spatial pattern, density and overlay between land cover and UHS and trend analysis to get a temporal trend in both campus universities. he rest result saw a land cover and its impact on UHS in university campus using remote sensing.
3. Result and Discussion Urban Heat Signature (UHS)
Land cover types in the University of Indonesia Campus are water bodies laid on a middle of campus from south to north, the building was covered from center to south campus, and dense vegetated covered from center to north campus. Percentage of land cover types between 2013 until 2015 saw on Table 2.
he Land cover types in UI Campus had relation with highest temperature and lowest temperature with previous study since 1997 (Taha, 1997; Kim & Baik, 2005; Wong & Chen, 2005; Tran et al, 2006; Gartland, 2008; Memon et al., 2009; Tursilowati, 2008; Ichinose et al, 2008; Mirzaei & Haghighat, 2010; Rena et al, 2012; Tursilowati et al., 2012; Srivanit & Hokao, 2013).
Figure 1 explains distribution of UHS on minimum temperature until maximum temperature. Yellow color is lowest temperature and red color was highest temperature. his spatial distribution similar with spatial distribution of build-up covered on UI Campus. UHS Behavior in UI Campus covered diference area in 2013-2015. UHS Behavior in UI Campus as spatial density within the distribution of UHS with high temp was relative centralized on south UI Campus area and UHS with lowest temp concentrated from middle until north area of UI Campus. he UHS with yellow color covered 70% UI campus and UHS with red color covered almost 30% area. UHS in UI Campus found as spatial pattern in 2014 until 2015 related with land cover.
he Air Surface Temperature (AST) was collected in October 2014. he AST data were collected from 14 points spread around campus area from north to south. he placement of the points was based on diferent land cover types such as buildings, dense vegetation cover and open space area in order to capture diferent variations of temperature (from high to low). he data collection started at 6 AM and ended at 6:30 PM. he data were compared with Land Surface Temperature (LST) derived from 15 October 2014 Landsat 8 thermal bands. he AST and LST data collection in UI campus showed on Table 3.
AST data were used to verify Land Surface
Temperature (LST) model derived from Landsat thermal bands. Based on the calculation, the average value of LST was less than AST (29.39 for LST and 30.43 for AST). his study used Root Mean Square Error (RMSE) to assess errors from LST model. he residual between observed value (AST) and model value (LST) ranged from 0.19 to 2.46. he RMSE showed 1.35, which indicates a relatively low error and a minimum variation between LST and AST. his study also tested the relationship between LST and AST. A Pearson’s correlation test was used to determine the correlation between model temperature and observed temperature. he test showed a signiicant diference of mean value between LST and AST, with the linear correlation of 0.56.
he result of UHS behavior in 2013-2015 was dynamic based on land cover types. UHS behavior in the year 2013 until 2015, had variations temperature with minimum 21.80C and maximum 38.20C, with the highest of UHS saw in August 2015 and the lowest of UHS saw in September 2014 (Table 4).
Based on Figure 2 UHS in UI Campus explains UHS behavior in the year 2013 from yellow color as lowest temperature and red color as highest temperature. he spatial pattern of yellow to red color related with a spatial distribution of land cover on UI Campus. he UHS on 10 September 2013 had minimum temperature is 21.80C and the maximum temperature is 30.10C and UHS on 12 October 2013 had minimum temperature is 25.00C and the maximum temperature is 31.10C saw on Table 1. UHS in UI Campus year 2014 on igure 3 saw the distribution of UHS with a spatial pattern similar but UHS 2014 had the highest temperature compare to UHS 2013. he UHS on 10 September 2014 had minimum temperature is 28.20C and the maximum temperature is 36.20C and UHS on 12 October 2013 had minimum temperature is 25.00C and the maximum temperature is 33.10C.he UHS in 2014 upper 2-30C than UHS 2013. Figure 4 saw UHS in UI Campus with a spatial pattern similar with UHS 2013 and UHS 2014. he UHS on 31 August 2015 had minimum temperature is 25.80C and the maximum temperature is 38.20C and UHS on 2 October 2015 had minimum temperature is 24.90C and the maximum temperature is 32.60C. In general UHS 2013-2015 had maximum temperature > 300C. his result of UHS on UI Campus had the maximum temperature > 300C related with the previous study in tropical cities (Tursilowati, 2008; Ichinose et al., 2008; Tursilowati et al., 2012). he spatial pattern related with a land cover in UI Campus, the build-up related with highest temperature (Tran et al, 2006; Taha, 1997) and the lowest temperature related with vegetated surfaces (Wong et al., 2007; Gartland, 2008, Wong & Jusuf 2008; Srivanit & Hokao, 2013).
Spatial-Temporal Analysis UHS Spatial Distribution
diferentiations in every month on 2013 until 2015 as saw on igure 1-3. he percentage of spatial distribution UHS saw on Table 4 with tree scale’s temperature related with Karyono [2001], Ichinose et al [2008], Tursilowati et al [2012] and Sookuk [2013]. Based on Figure 1 and Table 4, the spatial distribution of UHS on September 2014 covered with 45.5% maximum temperature (>300C), covered with 24.1% moderate temperature (27-300C) and covered with 30.4% minimum temperature (<270C). Spatial distribution of UHS on October relative similar with September 2013, it’s covered with 31.5% moderate temperature and 24.5% low temperature. Spatial distribution UHS on September 2014 covered with 77.8 of maximum temperature and 22% moderate temperature. he other hand, UHS October 2014 covered 43.0% with maximum temperature, 32.5% with moderate temperature and 24.5% with the lowest temperature. he spatial distribution of UHS in 2015 on August covered with 77.4% maximum temperature, 14.4% with moderate temperature and only 8.2% minimum temperature. Spatial distribution of UHS on October 2015 had similarity with a spatial distribution of UHS in October 2014.
Temporal Trend
Based on UHS on Figure 5 and Table 2, those are explained that the behavior of UHS on 2013 with minimum temperature is 21.80C and the maximum temperature is 31.10C, UHS on 2014 with minimum temperature is 25.00C and the maximum temperature is 36.20C, and UHS on 2015 with minimum temperature is 24.90C and maximum temperature is 38.20C. he temporal trend since 2013 until 2015, both of maximum and the minimum temperature had temporal trend positive, trend maximum is positive 7.10C (31.1 become 38.20C) and trend minimum is positive 3.2 (21.8 become 25.00C). his result saw trend temporal UHS Behavior 2013-2015 had a positive trend with R2 0.00175. his temporal trend related with temperature global trend.
UHS as Urban Heat Hazard
To address the urban hazard in education area based on UHS, this research used UTCI. his index used for assessment UHS scale by UTCI categorized in term thermal stress (Sookuk et all, 2014). his research use ive categories start from No thermal stress (>9 – 260C) until Extreme heat stress (>460C). UHS behavior since 2013-2015 seen on Table 5. he UHS on 2013 (21.8-31.10C) only had moderated heat stress and no thermal stress without strong heat stress. he UHS on 2014 (25.0-36.20C) had no thermal stress and strong heat stress. he UHS on 2015 (24.9-38.20C) had strong heat stress and very strong heat stress.
hose are UHS categories strong heat stress and very strong heat stress in 2014 had distribution totally covered 55% (between 43.0-77.8%) and 2015 had
distribution totally covered 50% (between 31.8-77.4%) area of UI Campus. his condition on September and October since 2014 include categories strong heat stress and very strong heat stress to be UHH. hose are importance information for University of Indonesia to anticipate the efect of that hazard and implication for student and their activity, especially outdoor activity.
he analysis UHS as UHH this research also uses ETI to explain thus heat stress category with Level of Sensation Temperature and Comfort. hus result shown in Table 6. For Sensation Temperature for UI Campus are Neutral until hot temperature Sensation and Sensation Comfort level for UI Campus is Comfortable until Very Uncomfortable. If very uncomfortable level input into phsychology and health this level included Increasing Stress Caused by Sweating and Blood Flow and Health level had Cardiovascular Embarrassment level and Heat Atack.
he maximum UHS as UHH in 2013 on September and October had a level of sensation temperature is Slightly warm with a level of sensation comfortable is Uncomfortable. he maximum UHS as UHH in 2014 and 2015, both on September and October, had level of sensation temperature is Warm-Hot sensation with level of sensation comfortable is Very Uncomfortable sensation
In general levelling of Efective Temperature on UI Campus [2013, 2014 and 2015] had the maximum UHS in September between 35-400C with level sensation for temperature is hot and for comfort level is very uncomfortable. Level sensation in October [2013, 2014 and 2015] had the maximum UHS between 32-35oC with level sensation for temperature is Warm and for comfort level is very uncomfortable. his result conclusion that UHS behavior on UI Campus in September and October had sensation level is very uncomfortable. hat’s condition will become the hazard for living on education area.
5. Conclusion
Build up area in UI Campus highest temperature on UI campus based on UHS. Range UHS in build-up area on 2013 (21.8-31.1oC), 2014 (25.0-36.2oC) and 2015 (24.9-38.2oC). his maximum UHS on September (2014 and 2015) put on levelling of Efective Temperature included range temperature 32-350C, with an explanation of sensation temperature is warm and sensation of comfort is Uncomfortable, Psychology with Increasing Stress Case by Sweating and Blood Flow and Health category is Cardiovascular Embarrassment. his temperature occurs in September will give impact on psychology and health, become the heat hazard of the living on education area.
Acknowledgement
Department of Geography, Faculty of Mathematics and Natural Sciences, University of Indonesia. his also based on MOU between University of Indonesia and University of Malaya.
References
Ahmad S, and Hashim NM (2007). Efects of Soil Moisture on Urban Heat Island Occurrences: Case of Selangor, Malaysia. Humanity & Social Sciences Journal 2,132-138. http://idosi.org/hssj/hssj2(2)07/8.pdf.
Asmat A., Mansor S., and Hong T.F., (2003). Rule Based Classiication for Urban Heat Island Mapping. 2nd Fig Regional Conference Marrakech, Morocco, December 2-5 http://www.ig.net/pub/morocco/proceedings/TS18/ TS18_4_asmat_et_al.pdf.
Boduch, M., and Fincher, W., (2009). University of Texas at Austin, School of Architecture-Seminar in Sustainable Architecture, Meadows Seminar Fall 2009, Center for Sustainable Development.
Chen, L., and Edward Ng., (2012). Outdoor thermal comfort and outdoor activities: A review of research in the past decade. Cities, 29, 118-125. doi:10.1016/j. cities.2011.08.006.
Chen, X., Li, P., Yin, Z., and Zhao, H., (2005). Remote Sensing Image-Based Analysis of he Relationship Between Urban Heat Island and Land Use/Land Cover Changes, Remote Sensing of Environment.
Gartland, L., (2008). Heat Island: Understanding and Mitigating a Heat in Urban Areas, Earthscan.
Hernina, R, Hanaiah, I., and Wikantika, K., (2008). Urban Heat Island Analysis Use Satellite Data (Case Study Bekasia Areas, West Java), Geography Journal, 1(2) 73-80.
Ichinose, T., Matsumoto, F., and Kataoka, K., (2008). Urban thermal environment and its mitigation through urban planning process. Geographical Reports of Tokyo Metropolitan University, 43, 33-40.
Kim Y.H., and Baik, J.J., (2005). Spatial and temporal structure of the urban heat island in Seoul. Journal American Meteorological Society, 44, 591-605.
Karyono, H.T., (2001). Teori dan Acuan Kenyamanan Termis dalam Arsitektur, PT. Catur Libra Optima, Jakarta. Kuşcu C., and Şengezer B., (2011). Determination of Heat
Islands from Landsat Tm Data: Relationship between Surface Temp and Urbanization Factors in Istanbul. he GEOSS Era: Towards Operational Environmental Monitoring: International Symposium on Remote Sensing of Environment. http://www.isprs.org/ proceedings/2011/ISRSE-34/.
Lenzholzer S., and Brown R.D., (2013). Climate-responsive landscape architecture design education. Journal of Cleaner Production 61, 89-99. http://dx.doi. org/10.1016/j.jclepro.2012.12.038.
Makaremi N., Elias Salleh, Mohammad Zaky Jaafar, and Amir H. G. H., (2012). hermal comfort conditions of shaded outdoor spaces in hot and humid climate of Malaysia, Building and Environment, 48, 7-14.
Mallick, J., Kant Y., and Bharath B. D., (2008). Estimation of land surface temp over Delhi using Landsat 7 ETM+, Journal of Indian Geophysics Union, 12(3), 131-140 http://www.igu.in/12-3/5javed.pdf.
Mirzaei, P.A. and Haghighat, F., (2010). Approach to study urban heat island: abilities and limitation, Journal of Building and Environment, 45, 2192-2201.
Memon, R.A, Dennis, Y.C. Leung and Chun-Ho Liu, (2009). An investigation of urban heat island intensity (UHII) as an indicator of urban heating, Journal of Atmospheric Research, 94(3), 491-500.
Oke, T.R., (2004). Siting and exposure of meteorological instruments at urban sites. 27th NATO/CCMS International Technical Meeting on Air Pollution Modelling and its Application, Banf, 25-29 October, 2004. To be published by Kluwer. http://www.urban-climate.org/ITM04-Oke.pdf.
Qin, Z., Wang, F., Karnieli, A., Song, C., Tu, L., and Zhao, S., (2015), An Improved Monowindow Algorithm for Land Surface Temperature Retrieval from Landsat 8 hermal Infrared Sensor Data, Remote Sensing, 7(4), 4269-4289. Rena, C., Spit, T., Lenzholzer, S., Yim, H. L. S., Heusinkveld,
B., van Hove, B., Chen, L., Kupski, S., Burghardt, R. and Katzschner, L, (2012). Urban climate map system for Dutch spatial planning, International Journal of Applied Earth Observation and Geoinformation, 18, 207-221. Rozenstein O., Zhihao Qin, Yevgeny Derimian and Arnon
Karnieli, (2014). Derivation of Land Surface Temp for Landsat-8 TIRS Using a Split Window Algorithm, Sensors, 14, 5768-5780; doi:10.3390/s140405768 Saadatian, O, Kamaruzaman, B.S, and Elias S., (2013).
Adaptation of sustainability community indicators for Malaysian campuses as small cities, Journal Sustainable Cities and Society, 6, 40–50.
Setiono, (1991). Arsitektur Kemapanan, Pendidikan, Kenyamanan, dan Penghematan Energi, PT. Catur Libra Optima, Jakarta.
Shahidan, M.F., Phillip J. Jones, Julie Gwilliam, and Elias Salleh, (2012). An evaluation of outdoor and building environment cooling achieved through combination modiication of trees with ground materials, Building and Environment, 58, 245-257.
Sookuk, P., Stanton E. T., & Myunghee, J., (2014). Application of Universal hermal Climate Index (UTCI) For microclimatic analysis in urban thermal environments, Landscape and Urban Planning, 125, 146–155.
Srivanit, M. & Hakao, K., (2013). Evaluating the cooling efects of greening for improving the outdoor thermal environment at an institutional campus in the summer, Building and Environment, 66, 158-172.
Steeneveld GJ, S. Koopmans BG, Heusinkveld NE, and heeuwes, (2014). Refreshing the role of open water surfaces on mitigating the maximum urban heat island efect. Landscape and Urban Planning 121, 92–96. http:// doi:10.1016/j.landurbplan.2013.09.001.
Suwarta, N. and Sari, R. F., (2013). Evaluating UI Green Metric as a tool to support green universities development: assessment of the year 2011 ranking. Journal of Cleaner Production, 61, 46-53. http;//doi:10.1016/j. jclepro.2013.02.034.
Suzuki, C., (2008). Improvements of Heat Island Monitoring Network in Tokyo. Geography Reports of Tokyo University, 43, 33-40.
Taha, Haider., (1997). Urban Climates and Heat Islands: Albedo, Evapotranspiration, and Anthropogenic Heat. Energy and Buildings, 25, (2), 99-103.
Tran, H., Daisuke, U., Shiro, O., and Yoshifumi, Y., (2006). Assessment with satellite data of the urban heat island efects in Asian mega cities. International Journal of Applied Earth Observation and Geo-information, 8 (1), 34-48.
contribution on climate change and relationship with land use change. Proceeding National Seminar on Global Warming and Global Change: Fact, Mitigation and Adaptation. ISBN : 978-979-17490-0-8.
Tursilowati, L., Sumantyo, J.T.S., Hiroaki, K., & Adiningsih, E.R., (2012). Relationship between urban heat island phenomenon and land use/land cover changes in Jakarta, Indonesia. Journal of Emerging Trends in Engineering and Applied Sciences, 3(4), 645-653.
Weng Q., Fu p., and Gao F., (2014). Generating daily land surface temperature at Landsat resolution by fusing Landsat and MODIS data, Remote Sensing of Environment, 145, 55-67.
Wibowo, A., Rustanto, A., & Shidiq, I.P.A., (2013). Spatial-temporal analysis of urban heat island in tangerang city. Indonesian Journal of Geography, 45 (2), 101-112. Wong, N.H. and Chen Y., (2005). Study of green areas and
urban heat island in a tropical city. Journal of Habitat International, 29, 547-558.
Wong, N.H., Jusuf, S.K, Win A.A.L., hu, H.K., Syatia, T., and Xuchou, W., (2007). Environmental study of the impact of greenery in an institutional campus in the tropics, Journal of Building and Environment, 42, 2449-2970. Wong, N.H., and Jusuf, S.K., (2008). GIS-based greenery
evaluation on campus master plan, Landscape and Urban Planning, Volume 84, pp. 166-182.
Wang, S., Ding, H., Liang, H., and Ma, Q., (2016). Detection of Urban Expansion and Land Surface Temperature Change Using Multi Temporal Landsat Image, Conservation and Recycling.