Which
firms
benefit
from
foreign
direct
investment?
Empirical
evidence
from
Indonesian
manufacturing
Suyanto
a,
Ruhul
Salim
b,*
,
Harry
Bloch
ba
FacultyofEconomics,UniversityofSurabaya,EastJava,Indonesia b
CurtinBusinessSchool,CurtinUniversity,Perth,WA6845,Australia
1. Introduction
Thespillovereffectsofforeigndirectinvestment(FDI)havebeenamajorconcernforresearchersandpolicymakers duringthelasttwodecades.AnumberofstudieshaveexaminedthespillovereffectsofFDIondomesticfirmproductivity
(Chakraborty&Nunnenkamp,2008;Haddad&Harrison,1993;Hu&Jefferson,2002;Javorcik,2004;Liang,2007;Negara&
Firdausy,2011;Takii,2005,2011). Thesestudiesprovidesomeusefulinsightsregarding theevidenceof thespillover
benefitsand offersomerecommendationstomaximizethebenefits.However, mostexistingstudiesexcludetechnical efficiencyandfocusmainlyontechnology,ignoringthattheFDIpresenceinhostcountriesistheimpetusforefficiency improvementthroughcompetitionanddemonstrationeffects(Wang&Blomstrom,1992).AstudyofFDIspillovereffectson firm-leveltechnicalefficiencyisimportanttoprovideevidenceastowhetherthelargeamountofFDIinflowsgenerate positiveexternalitiestodomesticfirmsthroughefficiencyimprovement,thusindicatingwhetherthespilloverhypothesisis justifiedinthecontextoftechnicalefficiency.SuchastudycanexploretowhatextentFDIcaninduceefficiencyspillovers, andwhichfirmtypesreallybenefitfromthespillovers.
JournalofAsianEconomics33(2014)16–29
ARTICLE INFO
Articlehistory:
Received22November2012 Receivedinrevisedform8May2014 Accepted11May2014
Availableonline19May2014
JELclassification:
D24 D29 F23
Keywords:
Foreigndirectinvestment Spillovereffects Technicalefficiency Stochasticproductionfrontier Indonesia
ABSTRACT
Despite growing concern regarding the productivity benefits of foreign direct investment (FDI),veryfewstudieshavebeenconductedontheimpactofFDIonfirm-leveltechnical efficiency.Thisstudyhelpsfillthisgapbyempiricallyexaminingthespillovereffectsof FDI on the technical efficiency of Indonesian manufacturing firms. A panel data stochastic productionfrontier(SPF)methodisappliedto3318firmssurveyedovertheperiod1988– 2000. The results reveal evidence of positive FDI spillovers on technical efficiency. Interestingdifferencesemergehoweverwhenthesamplesaredividedintotwoefficiency levels.High-efficiencydomesticfirmsreceivenegativespillovers,ingeneral,while low-efficiencyfirmsgainpositivespillovers.Thesefindingsjustifythehypothesisofefficiency gaps,thatthelargeristheefficiencygapbetweendomesticandforeignfirmstheeasierthe formerextractsspilloverbenefitsfromthelatter.
ß2014ElsevierInc.Allrightsreserved.
*Correspondingauthorat:SchoolofEconomics&Finance,CurtinBusinessSchool,CurtinUniversity,WA6845,Australia.Tel.:+61892664577; fax:+6192663026.
E-mailaddress:[email protected](R.Salim).
Contents lists available atScienceDirect
Journal
of
Asian
Economics
http://dx.doi.org/10.1016/j.asieco.2014.05.003
Amongthedevelopingeconomies,IndonesiaisparticularlysuccessfulinattractingFDI.NetFDIinflowstoIndonesiahave risenmorethan30timessince1986,reachingarecordlevelofUS$8.3billionin2008(theCentralBankofIndonesia,2011). However,thereisadearthofresearchonefficiencyspilloversinIndonesia.Mostempiricalstudiesexaminespillovereffects undera frameworkofthelong-runequilibriumproductionfunction,whichassumesthatfirmsareproducingata full efficiencylevel.Underthisframework,theFDIspilloversontechnicalefficiencyarenotcaptured.
Twopreviousstudiesbytheauthorsfocusontechnicalefficiencyusingastochasticproductionfrontierframeworkfor individual Indonesian manufacturing industries. Suyanto, Salim, and Bloch (2009) examine the pharmaceutical and chemicalindustries,whileSuyantoetal.(2012)examinetheelectronicandgarmentindustries.However, thereareno studiesprovidingcomprehensiveresultsforthewholeIndonesianmanufacturingsectorusingastochasticframework.
AstudybyTemenggung(2007)examinesthewholeIndonesianmanufacturingsector.Ourcurrentresearchdiffersfrom Temenggunginthreeimportantpoints.Firstly,Temenggungappliestheordinaryleastsquared(OLS)regressionmethodfor paneldata,whichdoesn’tdistinguishbetweenfixedeffects(FE)andrandomeffects(FE).Secondly,theclassicalproduction function,employedinTemenggung(2007),assumesthatallfirmsarefullyefficient,sothatthespillovereffectsofFDIreflect technological progress. In contrast, the current paper employs the stochastic production frontier, which relaxes the assumptionoffullefficiencyoffirms,sothatbothtechnologicalprogressandefficiencyimprovementareexamined.Thirdly, wecalculatethescoresoftechnicalefficiencyofeachfirmandestimatesspillovereffectsseparatelyforhigh-efficiencyand low-efficiencyfirms,providingausefulinsightintothedifferencesintheabilityofhigh-efficiencyandlow-efficiencyfirms inabsorbingspillovereffectsfromFDI.
Thisstudycontributestotheexistingliteratureinseveralways.Firstly,itexaminesthespilloverhypothesisbyfocusing ontechnicalefficiency,animportantaspectthatisoftenneglectedinthepreviousstudies.Theadoptionofastochastic productionfrontierallowstheauthorstoinvestigatetheeffectsofFDIspilloversonfirm-leveltechnicalefficiency.Secondly, thisstudycoversalongseriesofsurveyedfirms,whichincludesalsotheperiodoftheAsiancrisisonwards.Thirdly,this study evaluates horizontal, backward, and forward spillovers of FDI. Most importantly, by examining the whole manufacturing sector,it is possibletoidentifycharacteristics ofindustries that affect thesizeof thetechnology and efficiencyspilloverstodomesticfirmsfromFDI.Inparticular,wefindevidencethatthesizeofthetechnologygapbetween foreignanddomesticfirmsiscritical,withlargerefficiencygapsassociatedwithgreaterefficiencyspilloversfromFDI.
Weproceedbyreviewingtheconceptofspillovereffectsinthenextsection.Wethendiscussmethodologyanddata. EmpiricalresultsarepresentedinSection4andtheconclusionsaregiveninthefinalsection.
2. FDI,spillovereffects,andtechnicalefficiency:theoreticalconceptandempiricalevidence
2.1. FDIandspillovereffects
Foreigndirectinvestmentisbelievedtoprovidehostcountrieswithdirectandindirectbenefits.Thedirectbenefitstake theformsofnewinvestmentsthatboostnationalincome,increasetaxrevenues,andprovidenewemployment;whereasthe indirectbenefitsareintheformsofexternalitiesthataregeneratedthroughnon-marketmechanismstorecipienteconomies anddomesticfirmswithintheeconomies(Hymer,1960).TheseindirectbenefitsarecommonlyknownasFDIspillovers. TheliteratureidentifiesatleastthreetypesofFDIspillovers.Theseareproductivityspillovers,market-accessspillovers, and pecuniaryspillovers.Productivityspilloversaredefinedastheexternalities fromFDI thatleadtoincreasesinthe productivityofdomesticfirms(Aitken&Harrison,1999).Market-accessspilloversexistwhenthepresenceofFDIgenerates anopportunityfordomesticfirmstoaccessinternationalmarkets(Blomstrom&Kokko,1998).Pecuniaryspillovershappen iftheexistenceofFDIaffectstheprofitfunctionsofdomesticfirmsthroughareductionincostsoranincreaseinrevenues (Gorg&Strobl,2005).
OfthethreetypesofFDIspillovers,productivityspillovershavebeenaparticularconcernamongpolicymakersand researchersinthelasttwodecades.VariousincentiveshavebeenprovidedbypolicymakerstoattractFDIandsubstantial effortshavebeendevotedbyresearcherstoevaluatetheproductivityadvantage.However,theempiricalevidenceismixed atbest.Somestudiesfindevidenceofpositiveproductivityspillovers(Caves,1974;Javorcik,2004;Kugler,2006;Schiff&
Wang,2008;Temenggung,2007),butothersdiscovernonexistentorevennegativespillovers(Aitken&Harrison,1999;
Blalock&Gertler,2008;Djankov&Hoekman,2000).Thus,therelationshipbetweenFDIspilloversandfirmproductivity
remainsacontroversialissue.
2.2. Spillovereffectsandfirm-specificcharacteristics
Some researchersarguethat themixedevidenceintuitively impliesthat thespillover effects arenotan automatic consequenceoftheforeignpresenceinaneconomy,rathertheydependsignificantlyonthecharacteristicsoffirmsinthe industries(Gorg&Greenaway,2004;Lipsey&Sjoholm,2005;Smeets,2008).Oneimportantcharacteristicoffirmsisthe technologygapbetweenforeignanddomesticfirms.InastudyonUKmanufacturingfirms,Griffith,Redding,andSimpson
(2002)findthatthewiderthetechnologygapthelargertheFDIspillovereffectsthatareobtainedbydomesticfirms.This
findingindicatesabenefitofbeinglessadvancedintermsoftechnology,whichsupportsthetheoreticalargumentinFindlay
(1978).AsimilarresultisdiscoveredalsobyCastellaniandZanfei(2003)forFranceandSpain,andbyPeriandUrban(2006)
forItalyandGermany.
Althoughthereisanadvantageinbeinglessadvanced,thetechnologygapshouldnotbetoowide(Wang&Blomstrom, 1992).Aminimumleveloftechnologyisrequiredfordomesticfirmstoabsorbthenewtechnologyfromforeignfirms.When thegapistoowide,thelimitedkindabsorptivecapacityofdomesticfirmsmaynotpermitassimilationthenewtechnology (Glass&Saggi,1998).
2.3. TechnicalefficiencygainsfromFDIspillovers
EarlierstudiesonFDIproductivityspilloversfocusontechnologyadvantages(Gorg&Greenaway,2004).Theknowledge from foreignfirms is regarded synonymously withtechnological knowledge, as this is consistent with the useof a conventionalproductionfunction.Managerialandorganizationalknowledgethatmayleadtoefficiencyspilloversarenot portrayedsincefirmsareassumedtobeproducingatthelong-runequilibriumwithafullefficiencycapacity.Thus,the productivityspilloversintheseearlystudiesareidenticallymeasuredastechnologyspillovers.
Morerecentstudiesfocusonbothefficiencyandtechnologyadvantages.Inthesestudies,knowledgeisdefinedbroadlyas product,process,managerial,andorganizationalknowledge.Hence,productivityspilloversleadtobothtechnologyand efficiencyadvantages.Unfortunately,studiesthatinvestigateefficiencyadvantagesarenotplentiful.InastudyonGreek manufacturingfirms,DimelisandLauri(2002)examinetheeffectofforeignequitysharesonefficiencyandfindapositive relationshipbetweenthesetwovariables.Also,GhaliandRezgui(2008)analyzetheTunisianmanufacturingsectorandfind thathigherforeignshareincreasefirmefficiency.Addressingthesameissuebutemployingadifferentestimationmethod, ourstudyinvestigatestheefficiencyspilloversinIndonesianmanufacturingfirms.WeextendthestudiesbyDimelisand
Lauri(2002)andGhaliandRezgui(2008)byfocusingonverticalspilloversaswellashorizontalspillovers.
3. Methodology,dataset,andvariables
3.1. Methodology
There are twocommonly used methods in measuringefficienciesand productivityat thefirm level, namelydata envelopment analysis(DEA) and stochastic frontieranalysis (SFA).1 Eachof thetwo methods hasits advantages and
disadvantages,asexplainedbelow.Thechoicebetweenthesemethodsthusdependsontheobjectiveoftheresearch,the typeoffirmsinthechosenindustry,andthenatureofthedata(Coelli,Rao,O‘Donnell,&Battese,2005;Olesen,Peterson,&
Lovell,1996).
DEAisalinearprogrammingmethodthatobservesproductionpossibilitiesusingthetechniqueofenvelopmentand measuresefficiencyasthedistancetothefrontier(Banker,Charnes,&Cooper,1984;Charnes,Cooper,&Rhodes,1978).This methodhastheprimaryadvantageofbeingofanon-parametricnatureandhastheabilitytohandlemultipleoutputsand multipleinputs.2However,ithasthedisadvantageofproducingbiasedestimatesinthepresenceofmeasurementerrorand
otherstatisticalnoise,asthismethoddoesnotseparatethestochasticrandomnoisefromtheinefficiencyeffects(Schmidt, 1985).Hence,theestimationresultsunderthismethodtendtobeverysensitivetosmallchangesinthedata.
Alternatively,thestochasticfrontiermethodisaregression-basedmethodthatassumestwoseparateunobservederror terms,onerepresentsefficiencyandtheotherrepresentsstatisticalnoise(Aigner,Lovell,&Schmidt,1977;Meeusen&van
denBroeck,1977).Ithasachiefadvantageintheabilitytomeasureefficiencyinthepresenceofstatisticalnoise.However,
thismethodisparametricandrequiresaspecificfunctionalformanddistributionalassumptionsfortheerrorterms(Coelli etal.,2005).
InthisstudythestochasticfrontiermethodisappliedtoanalyzethespillovereffectsfromFDI.Theone-stagestochastic productionfrontier(SPF)isusedtoestimateaproductionfrontierandatechnicalinefficiencyfunctionsimultaneously.As pointed out by Kumbhakar,Ghosh, and McGuckin(1991) and Wangand Schmidt (2002),the one-stage approach is preferable than thetwo-stage approach,as thelatter exhibitsat least twolimitations in estimation that can leadto potentiallyseverebias.Thefirstlimitationisthattechnicalefficiencymightbecorrelatedwiththeproductioninputs,which maycauseinconsistentestimatesoftheproductionfrontier.ThesecondlimitationistheOLSmethodinthesecondstageis inappropriatesincetechnicalefficiencydistributionisassumedtobeone-sided.Consideringtheadvantages,thecurrent studyadoptstheone-stageapproach,followingBatteseandCoelli(1995).
TheBattese–Coelliproductionfrontiercanbeexpressedasfollows:
yit¼ fðxit;t;
b
Þexpðv
ituitÞ (1)andtheinefficiencyfunctionmaybewrittenas:
uit¼zit
d
þwit (2)1
ComprehensivereviewsofthetwomethodsareprovidedbyForsundetal.(1980),Bauer(1990),Bjureketal.(1990),Bravo-UretaandPinheiro(1993),
Greene(1993),Lovell(1993),andCoelli(1995).
2 Thenon-parametricnatureofDEAallowsformeasuringefficiencywithoutimposingaspecificfunctionalformandadistributionalassumptionondata. Suyantoetal./JournalofAsianEconomics33(2014)16–29
whereyitdenotestheproductionoftheithfirm(i=1,2,...,N)inthetthtimeperiod(t=1,2,...,T),xitdenotesa(1k)vector
ofexplanatoryvariables,
b
representsthe(k1)vectorofparameterstobeestimated,expdenotesexponential,v
itisthetime specificandstochasticerror,withiidN(0,s
2v),anduitrepresentstechnicalinefficiency,whichisassumedasafunctionofa
(1j)vectorofobservablenon-stochastic explanatoryvariables,zit,anda(j1)vectorofunknownparameterstobe
estimated,
d
,andwitisanunobservablerandomvariable.TheparametersofEqs.(1)and(2)areestimatedusingthemaximumlikelihoodestimator(MLE)byfollowingthethree stepsasexplainedinCoelli(1996).Withsimultaneousequationestimation,theMLEestimatesareunbiasedandefficient. ThevarianceparametersoftheBattese-Coelli’smodelaredefinedas
s
2sBB
s
2v+s
2
uand
g
BBs
2u/s
2s.3g
isanimportantparametertodecidewhetherthereistechnicalinefficiencyornotinthemodel.Iftheestimatedvalueofg
isnotstatisticallysignificant,thereisnotechnicalinefficiencyandtheresultsobtainedfromestimatingEq.(1)byordinary leastsquares(OLS)wouldbeefficient.Incontrast,iftheestimatedvalueofg
isstatisticallysignificant,thenthereistechnical inefficiencyandEqs.(1)and(2)shouldbeestimatedsimultaneously.ThetechnicalefficiencyoftheithfirmcalculatedfromtheEqs.(1)and(2)istheratioofobservedoutputofthefirmtoits potentialmaximumoutput,whichcanbewrittenas:
TEit¼ yit yP it
¼expðuitÞ (3)
FollowingBatteseandCoelli(1988),thebestestimatoroftheexp(uit)isitsconditionalexpectation,E[exp(uit)],so
technicalefficiencycanbewrittenas:
TEit¼E½expðuitÞ (4)
Ifitisassumedthattheproductionfrontiertakestheformofalog-linearproductionfunctionandtherearefourinput variables(labour,capital,material,andenergy)intheproductionprocess,theempiricalmodelcanbeexpressedinnatural logarithmsofvariablesas:
lnYit¼
b
oþb
1lnLitþb
2lnKitþb
3lnMitþb
4lnEitþþb
5Tþb
6lnFDlSectorþv
ituit (5)whereYisoutput,Lislabour,Kiscapital,Mismaterial,Eisenergy,Tisatime-trendvariablethatincreasesbyoneforeach year,FDI_SectorisameasureofFDIhorizontalspilloversasexplainedinthenextsectionandtheothervariablesareas previouslydefined.
TheinefficiencyeffectasafunctionofasetofFDIvariables,ayeardummy,anindustrydummy,andafirmdummycanbe writtenas:
uit¼
d
0þd
1FDIFirmitþd
2FDISectorjtþd
3FDIFirmitFDISectorjtþd
4Yearþd
5Industryþd
6Firmþwit (6)whereFDI_Firmisadummyvariableforforeigndirectinvestmentthattakesavalueofzeroifafirmhasnoforeignownership shareandtakesavalueofoneifaforeignfirmhasapositiveshare,FDI_Sectorisasdefinedabove,Yearisayeardummy variable,IndustryisanindustrydummyandFirmisafirmdummy.TheinteractiontermofFDI_FirmFDI_Sectorisincluded intheinefficiencyequationtoestimatewhetherforeignanddomesticfirmsbenefitequallyfromthepresenceofanew foreignfirm.Apositive(negative)coefficientontheinteractiontermindicatesless(more)efficiencygainforforeignfirms thanfordomesticfirms.
Eq.(6)isusedtoestimatetheintra-industryspillovers,whichcapturetheeffectsofforeignpresenceonthetechnical efficiencyoffirmsinthesameindustry.Theinter-industryspilloversarecommonlyestimatedbyreplacingthe horizontal-spillovervariable(FDI_Sector)withvertical-spillovervariables.Theinefficiencyfunctionfortheinter-industryspilloverscan beexpressedas:
uit¼
d
0þd
1FDIFirmitþd
2FDIDownstreamSectorjtþd
3FDIFirmitFDIDownstreamSectorjtþd
4Yearþd
5Industryþ
d
6Firmþwit (7)or
uit¼
d
0þd
1FDIFirmitþd
2FDIUpstreamSectorjtþd
3FDIFirmitFDIUpstreamSectorjtþd
4Yearþd
5Industryþ
d
6Firmþwit (8)whereFDI_Downstream_Sector isaproxyfor spillovereffectsfromforeignfirmstoforeignand domesticsuppliersand
FDI_Upstream_Sectorisaproxyforspillovereffectsfromforeignfirmstoforeignanddomesticbuyers.
3
Thecompletederivationthelog-likelihoodfunctionoftheBattese-CoellimodelanditsrelatedvarianceparametersarediscussedinBatteseandCoelli (1993).
3.2. Dataanddatasetconstruction
Theprimarydataforourstudyaretheannualsurveysofmediumand largemanufacturingestablishments(Survey TahunanStatistikIndustriorSI)conductedbytheIndonesianCentralBoardofStatistics(BadanPusatStatistikorBPS).These annualsurveyscoverawiderangeofinformationfromeachsurveyedestablishment.Thebasicinformationincludesyearof starting production, industrial classification, location, and the specific identification code. There is also information regardingownership,whichincludesforeignanddomesticownership,andinformationrelatedtoproduction,suchasgross output, number of workers in production and non-production, value of fixed capital, material usage, and energy consumption.
Theannualsurveyshavebeenconductedsince1975andthemostrecentavailabledatarelatestotheyear2007.However, thisstudyusesthedatafrom1988to2000.Theyear1988ischosenasastartingyearsinceitisthefirstyearthatthe replacementvalueoffixedassets,whichisusedasameasureforcapital,isavailable.Theyear2000isselectedasthelastyear becausetheBPSchangedthespecificidentificationcodein2001tothenewidentificationcode(KIPN)withoutprovidinga concordancetabletotheprevioususedidentificationcode(PSID).Effortstomatchtheobservationsintheyears2001–2005 totheyears1988–2000usingoutputvaluesandlabourdonotyieldconsistentresults.Therefore,thelongestpossibleperiod forthisstudyis1988–2000.
Inconstructingaconsistentdataset,severaladjustmentsareconducted.Theseincludeadjustmentforindustrialcode, adjustmentforvariabledefinitions,cleaningfornoiseandtypologicalerrors,backcastingmissingvaluesofcapital,matching firmsforabalancedpanel,andchoosingindustrieswithforeignfirms.Thebalancedpaneldataarepreferableinthisstudy duetotwoadvantages:(1)itenablestracingthetechnicalefficiencyscoresofeachobservedfirmduringtheperiodofstudy; (2)itremovestheinfluenceofafirmthatappearsonlyinoneortwoyears,whiletheperiodofestimationisfor13years.The detailsofadjustmentsarepresentedinAppendix1.Aftertheadjustments,thefinalbalancedpanelofdataconsistsof3318 establishmentswith43,225observations.
Toshowtheinfluenceoftheconstructionofthebalancedpaneldataset,thedescriptivestatisticsoftherelatedvariables arecalculatedforthebalancedpaneldataandfortheoriginaldatabeforetheadjustmentprocess.Theoriginaldataconsistof establishmentsthatdonotreportcompleteinformationon output,labour,capital,material,orenergy.Thereforethese establishmentsarenotincludedinthecalculationofthedescriptivestatisticsfororiginaldata.FollowingTakii(2005),(1)0.5 percentobservationswiththelowestvaluesofoutputand1.5percentobservationswiththehighestvaluesofoutputare removed.Afterthesedeletions,thedescriptivestatisticsfortheoriginaltotaldata,aspresentedinTable1,consistsof24,188 establishmentsforanunbalancedpanelof238,628observations.
Table1showsthattheminimumvaluesofvariableslnY,lnL,lnK,lnM,lnEfortheoriginaldataarelowerifcomparedtothe
minimumvaluesofthosevariablesfromthebalancedpanel.Thismakessenseasthebalancedpaneldataremovessome observations duringthe adjustment process. The maximum values of those variables are higher in theoriginal data comparedtothoseinbalancedpaneldata.Themeanvaluesofthesefivevariablesarehigherinthebalancedpaneldata comparedtothoseinoriginaldata,whilethestandarddeviationsofthesefivevariablesarelowerinbalancedpanelwhen comparedtothoseinoriginaldata.
ForFDI_Firm,theminimumvalueiszeroandthemaximumvalueisonebothfororiginaldataandthebalancedpanel
data,becausethisvariableisadummyvariable.Further,theminimumvalueandthemaximumvalueofvariablesFDI_Sector,
Table1
Descriptivestatisticsfortheoriginaldataandthebalancedpaneldata. Originaldataa
Balancedpaneldata
Min Max Mean SD Min Max Mean SD
ProductionFrontier
lnY 6.461 20.980 12.514 2.256 6.591 20.761 13.964 2.006
lnL 2.398 10.649 4.079 1.327 2.639 10.292 4.702 1.088
lnK 4.105 23.398 12.308 2.268 4.220 23.106 13.152 2.245
lnM 3.871 20.033 11.765 2.418 4.239 19.454 12.164 2.221
lnE 1.791 16.583 9.377 2.221 1.882 15.836 9.587 2.077
FDI_Sector 0 1.492 0.208 0.218 0 1.492 0.234 0.209
InefficiencyFunction
FDI_Firm 0 1 0.064 0.273 0 1 0.072 0.258
FDI_Sector 0 1.492 0.208 0.218 0 1.492 0.234 0.209
FDI_Downstream_Sector 0.002 5.443 0.176 0.212 0.002 5.443 0.176 0.204
FDI_Upstream_Sector 0 0.921 0.160 0.181 0 0.921 0.160 0.174
NumberofEstablishments 24,188 24,188 24,188 24,188 3318 3318 3318 3318 NumberofObservation 231,064 231,064 231,064 231,064 43,225 43,225 43,225 43,225
Source:Authors’calculationsfromtheannualsurveysoftheIndonesianCentralBoardofStatistics(BadanPusatStatistikorBPS).
Y=output,L=labour,K=capital,M=materialandE=energy.
aTheoriginaldatainthistableexclude:(1)theestablishmentsthatdonotreportinformationonoutput,labour,capital,material,orenergy;(2)1.5
percentobservationswiththelowestvaluesofoutputand1.5percentobservationsthehighestvaluesofoutput.
Suyantoetal./JournalofAsianEconomics33(2014)16–29
FDI_Backward,andFDI_Forwardarethesamefororiginaldataandforthebalancedpanel,asthecalculationofthese inter-industryvariablesisbasedonallfirmsintheoriginaldataasinBlalockandGertler(2008).Themeanvaluesofthesethree spillovervariablesarehigherinthebalancedpanelcomparedtothoseintheoriginaldata,whereasthestandarddeviations arelowerinbalancedpanel.FromthedescriptivestatisticsinTable1,theauthorsconcludethatthereisnosubstantialbiasin theadjustmentprocesssincethereisnosubstantialdifferenceinthemaximumvalue,minimumvalue,meanvalue,and standarddeviation.
3.3. Measurementofvariables
Therearetwosetsofvariablesincludedinthisstudy:productionvariablesandinefficiencyvariables.Theproduction variables consistofoutput,labour,capital,material,energy,time trendandFDI_Sector,whiletheinefficiencyvariables includeFDIvariables(FDI_Firm,FDI_Sector,FDI_Upstream_Sector,andFDI_Downstream_Sector),ayeardummy,anindustry dummy,andafirmdummy.TheprecisedefinitionofeachvariableisgiveninAppendix2.
Inthisstudy,grossoutputisusedasthemeasureforoutput(y).Itreferstothetotalvalueofoutputproducedbyafirm. Thenumberofemployeesdirectlyandindirectlyengagedinproductionisusedforthemeasureoflabour(L).Asameasureof capital(K),thisstudyusesthereplacementvalueofcapital,whilematerial(M)ismeasuredusingthetotalvalueofrawand intermediatematerialsandenergy(E)ismeasuredasthesumofelectricityandfuelexpenses.
FDI_Firmismeasuredbyadummyofforeigndirectinvestment,whichtakesavalueofoneifafirmhasapositiveforeign ownershipandtakesavalueofzeroifotherwise.AsameasurefortheFDIhorizontalspillovers,thisstudyusestheshareof foreignfirmoutputtothetotaloutputatthefive-digitISICsectorallevel,whichisexpressedasinAitkenandHarrison
(1999):
FDISectorjt¼ P
i8i2jFDIFirmityit P
i8i2jyit
(9)
Eq.(9)capturestheeffectofFDIatthesectorallevelonproductivityatthefirmlevel.Itshowsthespillovereffectsof foreignpresenceondomesticfirmsinthesamefive-digitISICindustry.
TwoalternativemeasuresofFDIspilloversinthisstudyaremeasuresofinter-industryspillovers.Thepresenceofforeign firmsin certainfive-digit ISICindustriesmay createproductivityexternalities forfirmsin upstreamanddownstream industries.Thisstudymeasurestheinter-industryspilloversbyusingvariablesthatreflecttheextentofbackwardand forward linkages between industries. Following Javorcik(2004), themeasure for FDI spillovers fromforeign firmsin industriesk(k6¼j)thatarebeingsuppliedbydomesticfirmsinindustriesjis:
FDIDownstreamSectorjt¼
X
kifk6¼j
a
jkFDISectorkt (10)where
a
jkistheproportionofsectorj’soutputsuppliedtosectork,whichistakenfromtheinput–output(IO)matrixoffour-digitindustries.4Similarly,themeasureforFDIspilloversfromforeignfirmsinindustriesmwhoseproductsarebought bydomesticfirmsinindustriesnis:
FDIUpstreamSectormt¼ X
nifn6¼m
g
mnFDISectornt (11)where
g
mnistheproportionofinputspurchasedbyindustrynfromindustrymintotalinputsourcedbyindustryn,whichistakenfromtheinput–output(IO)matrixoffour-digitindustries.
Atime-trendvariableisincorporatedintheproductionfunctiontomeasuretechnicalchange.Thetime-trendvariable takesavalueofonefortheyear1988,avalueoftwofortheyear1989,andsoon.Anindustrydummycaptureseffectsspecific toaparticularindustryand hasa valueofoneforanindustry foranobservationofthatindustryand avalueofzero otherwise.Asimilarprocedureisalsoappliedtothefirmdummyandyeardummyvariables.
4. Empiricalresults
Weestimatea stochasticfrontierestimationandfirsttestforconstantreturnstoscaletocheckwhethertheCobb– Douglasproductionfrontierisbestsuitedtothedata.FollowingtheprocedureofjointrestrictiontestinBaltagi(2011,p.80), thetestofconstantreturnstoscaleisconductedunderthenullhypothesisthatthesumoftheestimatedparameters(
b
i)in4Duringtheselectedperiodinthisstudy,therearefouravailableIOmatrixes,whichwerepublishedin1990,1993,1995,and2000.Thisstudyusesthese
fourinput-outputmatrixesforcalculatingthebackwardcoefficientajk.Thefollowingistheprocedureforobtainingvaluesofajk.Valuesofajkbeforeand
including1990aretakenfromthe1990IOmatrix.Valuesofajkfor1991and1992arelinearlyinterpolatedfromthe1990and1993IOmatrixes.Valuesof
ajkfor1993aretakenfromthe1993IOmatrix.Valuesofajkfor1994arecalculatedfromthelinearinterpolationofthe1993and1995IOmatrixes.Valuesof
ajkfor1995aretakenfromthe1995IOmatrix.Valuesofajkfrom1996to1999arelinearlyinterpolatedfromthe1995andthe2000IOmatrixes.Finally,
valuesofajkfor2000aretakenfromthe2000IOmatrix.
productionfrontierinEq.(5)isequaltoone.Theregressionsumofsquaresforunrestrictedmodel(RSSU)is39,631.63, whereastheregressionsumofsquaredforrestrictedmodel(RSSR)is25,549.50.TheF-statisticsis392.52,suggestingthatthe nullhypothesisisrejected.ThisresultconfirmsthattheCobb–Douglasproductionfrontierisnotthebestsuitedmodelfor thestochasticfrontierestimation.Rather,asthesumofthecoefficients oftheinputvariablesis greaterthanone,the unrestrictedmodelwithvariablereturnstoscaleisappropriateandisusedbelow
4.1. Intra-industryspillovers
Webeginwithestimationofintra-industryspillovers.UsingEqs.(5)and(6),theproductionfrontierandtheinefficiency functionare estimatedsimultaneouslyfor observing theeffects offoreign investmenton theproduction frontierand technicalefficiencyoffirms.Fortheinefficiencyfunction,thetechnicalefficiencyvariable(uit)isspecifiedasafunctionofa
foreignsharedummy(FDI_Firm),theshareofforeignfirms’outputsovertotaloutputsinthefour-digitindustry(FDI_Sector), andaninteractingtermbetweenFDI_FirmandFDI_Sector.Whenforeigninvestmentincreasesthefirm’stechnicalefficiency, thecoefficientofFDI_Firmisnegative.5Whentechnologyspillsoverfromfirmswithforeigndirectinvestmenttopurely
domesticfirmsinthesameindustry,thecoefficientofFDI_Sectorisnegative.Asfortheinteractionterm,thesignofthe coefficientshowswhetherornotforeigndirectinvestmentaffectsthefirm’sabilitytobenefitfromspilloversoriginating fromotherforeign-ownedfirmsinthesameindustry.
Weestimatefouralternativemodelsinordertotesttherobustnessoftheestimatedparameters.Inthefirstmodel,ayear dummyandanindustrydummyareincludedintheinefficiencyequation.Theestimatedparametersarepresentedinthe Model(1)columnofTable2.Theresultsfromtheproductionfrontiershowthatthefourinputvariablescontributepositively andsignificantlytooutput,suggestingapositiveelasticityofeachinputonoutput.Thereisalsoapositiveandstatistically significantcoefficientof thetime-trendvariableindicating that technicalchangecontributespositivelytooutput.The positiveandstatisticallysignificantcoefficientofFDI_Sectorsuggestshorizontalspilloversfromintra-industryforeigndirect investmentincreasetheproductionfrontierforallfirms.
Fromtheestimatesoftheinefficiencyfunction,whichisthemainfocusofthisstudy,thecoefficientofFDI_Firmis negativeandhighlysignificant,indicatingthatforeigndirectinvestmentdecreasesthefirm’stechnicalinefficiency.This suggeststhatfirmswithforeignownershipare,onaverage,moreefficientthanpurelydomesticfirms.Thisfindingconfirms theargumentinCaves(1971)andDunning(1988)thatforeignfirmsaremorelikelytooperateontheproductionfrontier. Furthermore,thenegativeand statisticallysignificantestimateofFDI_Sectorsuggeststhat knowledgespillsoverfrom foreign-ownedfirmsincreasesthetechnicalefficiencyofallfirmsintheindustry.Thisresultisinlinewiththeargumentin
WangandBlomstrom(1992)andfindingsinGhaliandRezgui(2008).ThisresultisalsoconsistentwithfindingsinTakii
(2005),Temenggung(2007)andBlalockandGertler(2008),whichusedifferentmethodsofanalysis.
Thepositivesignificantestimateofinteractingtermmeansthat,althoughtheforeign-ownedfirmsalsobenefitfromthe presenceofotherforeigninvestmentintheindustry,thebenefitissmallerthanfordomesticfirms.Giventhattheestimated coefficientofFDI_FirmandtheestimatedcoefficientofFDI_Sectorarenegativeandstatisticallysignificant,thepositive coefficient of the interaction term means that uit/FDI_Firm=0.5763+0.0330FDI_Sector and that uit/FDI_Sector=
0.2224+0.0330FDI_Firm.AsbothFDI_FirmandFDI_Sectorareeachalwayslessthanorequaltoonebyconstruction,
theneteffectof FDI_Sectoris negativefor allforeignfirmsaswellasdomestic firms.However,themagnitudeofthe improvementinefficiencyfromhavingforeignfirmsintheindustryisalwaysgreaterfordomesticfirmsthanforforeign firms.
Inaddition,weconductjointsignificancetest(F-test)onthemagnitudeofspilloversforforeignestablishmentsinorder tochecksignificanceofthedirecteffectandtheinteractingeffectofspilloversonforeignfirms.6Thevalueof
F-statisticis calculatedfromthelog-likelihoodvalueoftheunrestrictedmodelandtheloglikelihoodvalueoftherestrictedmodel(when boththecoefficientofFDI_SectorandthecoefficientofinteractingvariableFDI_FirmFDI_Sectorequaltozero).Thevalueof loglikelihoodfortheunrestrictedmodelis7704.48,whereasthevalueofloglikelihoodfortherestrictedmodelis7643.00, Sothat,theF-statisticis13.22,whichsuggeststhattheunrestrictedmodel(byincludingvariablesFDI_Sectorandinteracting variableFDI_FirmFDI_Sector)isthecorrectmodelandthetwovariablesarejointlysignificantaffectingspilloverson foreignestablishmentsat1%level.
Theestimatedcoefficientofyeardummyisnotstatisticallysignificant,suggestingthatonaveragethereisnosignificant differenceintechnicalinefficiencyscoresoffirmsacrossthesampleyears.Thestatisticallysignificantestimatedcoefficient ofindustrydummysuggeststhatthereisasignificantdifferenceininefficiencyscoresacrossfive-digitindustries.
Thehighlysignificantestimateofgammaimplicatesthatestimationofstochasticfrontiershouldincludeaninefficiency effect. This finding provides the justification for the simultaneous estimation of stochastic production frontier and inefficiencyequation.Inotherwords,themodelisappropriatelyrepresentingtheobservedfirms.
Inthesecondmodel,industrydummiesarereplacedbyfirmdummies,inordertocontrolforfirmheterogeneityacross thesample.TheresultsaregivenintheModel(2)columnofTable2.Thesignandsignificanceofestimatesaresimilarto
5
Thedependentvariablefortheinefficiencyfunctionistechnicalinefficiency.ThenegativecoefficientofFDI_Firmindicatesthatforeigninvestment decreasesinefficiency,whichimpliesanincreaseinthefirm’sefficiency.
6 Wearegratefultooneofthereviewersforsuggestingthispoint.
Suyantoetal./JournalofAsianEconomics33(2014)16–29
thoseinthefirstmodel.Thenotabledifferenceisonlyinthemagnitudeoftheestimates.FocusingontheFDIvariables,the magnitudesofcoefficientsaresmallerinthissecondmodelcompared tothose inthefirstmodel. Inotherwords,the inclusionoffirmdummyandtheexclusionofindustrydummyinthesecondestimation(Model2)resultsinasmallereffect ofFDIspilloversontechnicalinefficiency.Thisisnotsurprising.Firm-specificeffectsarelargelycapturedbythefirmdummy, whichremovesapotentialsourceofbiasintheestimatesofothercoefficients.Notably,theresultsregardingthedirectionof spillovereffectsarethesameasinthefirstmodel,asthecoefficientofFDI_Sectorisnegativeandstatisticallysignificantin bothmodels.
Forthethirdmodel,onlyatimedummyisincludedasacontrollingvariableintheestimation.Theresultingestimates, whicharepresentedintheModel(3)column,areverycomparablewiththeresultsinModel(1)andModel(2).Similar findingsarealsoobservedinModel(4),whenthetimedummy,industrydummyandfirmdummyandareallexcludedfrom estimation.TheresultsfromthesefourmodelsconfirmtherobustnessoftheestimatesofthepositivespilloversfromFDIon thetechnicalefficiencyofdomesticfirms.
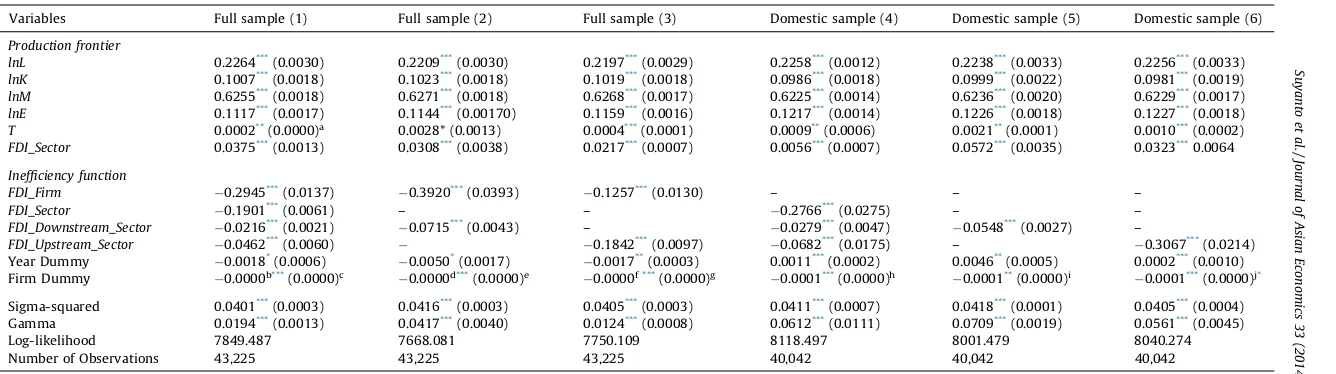
4.2. Inter-industryspillovers
Besidestheeffectsondomesticfirmsinthesameindustry,FDIcanalsogeneratespilloversondomesticfirmsinother industries.Weestimatesixmodelsoftheinter-industryspillovers,andtheresultsofeachmodelarepresentedinTable3. Thefirstthreemodelsareestimatedonthefullsampleandthelastthreemodelsareestimatedonthesub-sampleofonly domesticfirms.Inthethreefull-samplemodels,thefirstmodelistocapturethesimultaneouseffectofthethreespillover variablesontechnicalinefficiency.ThesecondandthethirdmodelfocusontheindividualeffectofeachoftheverticalFDI spillovers(i.e.thedownstreamspilloverandtheupstreamspillover).Thesamestructureisalsoappliedtothesub-sampleof onlydomesticfirms,withModel4capturesthesimultaneouseffectofthethreespillovervariables,Model5capturesthe downstreameffectonly,andmodel6capturesonlytheupstreameffect.
In thefirstmodel (thefirst resultscolumnof Table3), thethree proxiesofspillover variables areincludedin the estimations.Theresultsshowthatthehorizontalspillovervariable(FDI_Sector)hasanegativeandstatisticallysignificant coefficient,suggestingthatanincreaseintheshareofforeignfirmoutputdecreasestechnicalinefficiencyacrossfirmsinthe industry.Similarly,thespilloversfromFDIindownstreamindustriesalsodecreaseinefficiencyofsuppliers,asdemonstrated bythenegativeandhighlysignificantcoefficientofthebackwardspillovervariable(FDI_Downstream_Sector).Inaddition, the coefficientof the forwardspillover variable (FDI_Upstream_Sector) is negativeand highly significant,indicating a negativerelationshipbetweenFDIinsupplierindustriesandtheindustry’sowntechnicalinefficiency.Althoughweemploy adifferentmethodologyanduseadifferentdataset,thefindingsaresimilartothoseinLiang(2007).
Inthesecondandthethirdmodels(thesecondandthethirdcolumnsofTable3),theimpactsofbackwardspillover variableandtheforwardspillovervariableareestimatedseparately.Ineachmodel,themagnitudeofthecoefficientofthe includedspilloversvariableislargerthaninModel1,butneitherthesignnorthestatisticalsignificanceofthecoefficient changes.Clearly,thereismulti-colinearityamongthespilloversvariablesthatmakestheidentificationofseparateeffects Table2
Estimatingintra-industryspillovers.
Variables Model(1) Model(2) Model(3) Model(4)
Productionfrontier
lnL 0.2227***
(0.0033) 0.2256***
(0.0031) 0.2197***
(0.0030) 0.2167***
(0.0031)
lnK 0.1018***(0.0019) 0.1043***(0.0017) 0.1023***(0.0018) 0.1097***(0.0012) lnM 0.6263***(0.0018) 0.6218***(0.0018) 0.6223***(0.0017) 0.6191***(0.0022) lnE 0.1128***(0.0017) 0.1160***(0.0017) 0.1165***(0.0017) 0.1176***(0.0016)
T 0.0007*
(0.0005) 0.0039**
(0.0006) 0.0066***
(0.0028) 0.0012***
(0.0003)
FDI_Sector 0.1224***
(0.0055) 0.2044***
(0.0065) 0.2687***
(0.0096) 0.1577***
(0.0065)
Inefficiencyfunction
FDI_Firm 0.5763***
(0.0264) 0.1550***
(0.0018) 0.1960***
(0.0104) 0.2362***
(0.0092)
FDI_Sector 0.2224***
(0.0896) 0.2000***
(0.0149) 0.1780***
(0.0027) 0.1819***
(0.0034)
FDI_FirmFDI_Sector 0.0330***(0.0028) 0.0460***(0.0036) 0.1035**(0.0184) 0.0673***(0.0086)
YearDummy 0.0002(0.0031) 0.0010(0.0009) 0.0010(0.0019) – IndustryDummy 0.0039*
(0.0008) – – –
FirmDummy – 0.0001**
(0.0000)a
– –
Sigma-squared 0.0416***
(0.0010) 0.0416***
(0.0005) 0.0413***
(0.0003) 0.0418***
(0.0003) Gamma 0.0380***
(0.0038) 0.0224***
(0.0083) 0.0086***
(0.0002) 0.0151***
(0.0020) Log-likelihood 7704.484 7759.086 7618.974 7572.755 NumberofObservations 43,225 43,225 43,225 43,225
Source:Authors’calculations.
Notes:Y=output,L=labour,K=capital,M=material,E=energy,T=timetrend.Standarderrorsareinparentheses.
a
Theestimatedstandarderroris0.000009. * Significantatthe10%level.
** Significantatthe5%level. *** Significantatthe1%level.
Table 3
Estimating inter-industry spillovers.
Variables Full sample (1) Full sample (2) Full sample (3) Domestic sample (4) Domestic sample (5) Domestic sample (6)
Production frontier
lnL 0.2264***
(0.0030) 0.2209***
(0.0030) 0.2197***
(0.0029) 0.2258***
(0.0012) 0.2238***
(0.0033) 0.2256***
(0.0033)
lnK 0.1007***
(0.0018) 0.1023***
(0.0018) 0.1019***
(0.0018) 0.0986***
(0.0018) 0.0999***
(0.0022) 0.0981***
(0.0019)
lnM 0.6255***(0.0018) 0.6271***(0.0018) 0.6268***(0.0017) 0.6225***(0.0014) 0.6236***(0.0020) 0.6229***(0.0017) lnE 0.1117***(0.0017) 0.1144***(0.00170) 0.1159***(0.0016) 0.1217***(0.0014) 0.1226***(0.0018) 0.1227***(0.0018)
T 0.0002**
(0.0000)a
0.0028* (0.0013) 0.0004***
(0.0001) 0.0009**
(0.0006) 0.0021**
(0.0001) 0.0010***
(0.0002)
FDI_Sector 0.0375***
(0.0013) 0.0308***
(0.0038) 0.0217***
(0.0007) 0.0056***
(0.0007) 0.0572***
(0.0035) 0.0323***
0.0064
Inefficiency function
FDI_Firm 0.2945***
(0.0137) 0.3920***
(0.0393) 0.1257***
(0.0130) – – –
FDI_Sector 0.1901***
(0.0061) – – 0.2766***
(0.0275) – –
FDI_Downstream_Sector 0.0216***(0.0021)
0.0715***(0.0043) –
0.0279***(0.0047)
0.0548***(0.0027) – FDI_Upstream_Sector 0.0462***(0.0060)
0.1842***(0.0097)
0.0682***(0.0175) –
0.3067***(0.0214)
Year Dummy 0.0018*
(0.0006) 0.0050*
(0.0017) 0.0017**
(0.0003) 0.0011***
(0.0002) 0.0046**
(0.0005) 0.0002***
(0.0010) Firm Dummy 0.0000b***
(0.0000)c
0.0000d***
(0.0000)e
0.0000f***
(0.0000)g 0.0001*** (0.0000)h 0.0001** (0.0000)i 0.0001*** (0.0000)j*
Sigma-squared 0.0401***
(0.0003) 0.0416***
(0.0003) 0.0405***
(0.0003) 0.0411***
(0.0007) 0.0418***
(0.0001) 0.0405***
(0.0004) Gamma 0.0194***
(0.0013) 0.0417***
(0.0040) 0.0124***
(0.0008) 0.0612***
(0.0111) 0.0709***
(0.0019) 0.0561***
(0.0045) Log-likelihood 7849.487 7668.081 7750.109 8118.497 8001.479 8040.274 Number of Observations 43,225 43,225 43,225 40,042 40,042 40,042
Source: Authors’ calculations.
Notes:Y= output,L= labour,K= capital,M= material,E= energy,T= Time trend. Actual estimates area
0.00004,b 0.000034,c 0.0000017,d 0.000034,e 0.0000019,f 0.000034,g 0.0000014,h 0.0000024,i 0.000012,j
0.0000035. Standard errors are in parentheses. * Significant at the 10% level.
** Significant at the 5% level. *** Significant at the 1% level.
difficult.ThecoefficientoftheFDI_Downstream_Sectorbeingnegativeandstatisticallysignificantatthe1%levelinboth Model1andModel2,indicatesarobustfindingthattheforeignentryinathree-digitindustrydecreasesthetechnical inefficiencyofdomestic suppliers(i.e.positivebackwardspillovers).Similarly, thenegativeandstatisticallysignificant coefficientoftheFDI_Upstream_SectorinbothModel1andModel3indicatesarobustfindingthatthepresenceofforeign firmsinathree-digitindustrydecreasestheinefficiencyofdomesticbuyers(i.e.positiveforwardspillovers).
Toisolatethespillovereffectsononlydomesticfirms,weestimatetheModels1through3forthesub-sampleofonly domesticfirms.TheestimationresultsarepresentedinthefourththroughsixthresultcolumnsinTable3.Theresultsare similartothoseforthefullsampleoffirmsintermsofthesignsandsignificanceofthecoefficients.However,itisnotable thatthecoefficientsforthespilloversvariablesinthedomesticfirmsamplearegenerallyoflargermagnitudethanthe correspondingcoefficientsforthefullsample.ThisprovidesfurtherevidencetosupportthatfromtheresultsinTable2
showingthatspilloversfromforeignfirmsaremorebeneficialforpurelydomesticownedfirmsthanforfirmswithdirect foreigninvestment.
GiventheresultsfromTable3,weconcludethatthespillovereffectsfromFDIdecreasetechnicalinefficiencyofdomestic firms inupstreamand downstream industries.Thesefindings confirmtheargumentin Javorcik(2004) thata foreign presenceinadomesticmarketmaygeneratenotonlyspillovereffectsondomesticfirmsinthesameindustrybutalso providespilloverbenefitstodomesticfirmsintheupstreamanddownstreamindustries.
4.3. Spillovereffectsandtheleveloftechnicalefficiency
Sofar,theanalysispoolstogetherallfirmswithdifferentlevelsofefficiency.Ithasadvantageofshowingtheaverage effectofFDIspilloversonafirm’stechnicalefficiency.However,ithasadisadvantageinthatthespillovereffectsareassumed tobeuniformforallfirms.Thus,theanalysisdoesnotclearlydistinguishwhichfirmsgainthemostspillovereffectfromFDI. Inthissection,theanalysisisextendedtoansweraquestionofwhetherthelevelofefficiencyinfluencestheabilityof firmsinabsorbingspilloverbenefits.Thefirmsaredividedintotwogroups:firmswithahigh-efficiencylevelandthosewith alow-efficiencylevel.Theproceduretogroupthefirmsisbysortingthefirmsfromtheonewiththehighesttechnical efficiencyleveltothefirmwiththelowestefficiencylevel,andthenthesortedfirmsaredividedintotwo.Theupperhalfof thedataiscategorizedasthehigh-efficiencyfirmsandthelowerhalfisthelow-efficiencyfirms.Theestimationresultsfor thesetwogroupsoffirmsarepresentedinTable4.Weestimateresultsforthefullsampleoffirmsaswellasforthe sub-sampleofonlydomesticfirms.
Startingfromthefullsampleestimations,thecoefficientofFDI_Firmisnegativeandstatisticallysignificantbothamong high-efficiencyfirms(column1ofTable4)andamonglow-efficiencyfirms(column2),suggestingthatforeign-ownedfirms have a higher technical efficiencylevel in both groups offirms. The positive and significantcoefficient ofFDI_Sector
demonstratesthatspilloversattheindustriallevelincreasetheinefficiencyofthefirms(i.e.anegativeefficiencyspillover). Incontrast,thelow-efficiencyfirmsexperienceadecreaseintechnicalinefficiencywhenforeignfirmsaremoreimportantin theindustry(i.e.apositiveefficiencyspillover),asindicatedbyanegativeandhighlysignificantcoefficientofFDI_Sector
(column2). Table4
Estimatingintra-industryspilloversinhigh-efficiencyandlow-efficiencyfirms.
Variables Fullsample Domesticsample
High-efficiencyfirms(1) Low-efficiencyfirms(2) High-efficiencyfirms(3) Low-efficiencyfirms(4)
Productionfrontier
lnL 0.2049***(0.0047) 0.2258***(0.0040) 0.2372***(0.0018) 0.2012***(0.0038) lnK 0.1080***(0.0032) 0.0985***(0.0024) 0.1025***(0.0024) 0.0911***(0.0021) lnM 0.6038***
(0.0023) 0.6634***
(0.0027) 0.5883***
(0.0036) 0.6900***
(0.0026)
lnE 0.1316***
(0.0027) 0.0835***
(0.0023) 0.1429***
(0.0013) 0.0791***
(0.0018)
T 0.0021**
(0.0009) 0.0001**
(0.0000)b
0.0022***
(0.0004) 0.0064***
(0.0003)
FDI_Sector 0.0940***
(0.0058) 0.0492**
(0.0141) 0.0849***
(0.0032) 0.0727**
(0.0133)
Inefficiencyfunction
FDI_Firm 0.0617***(0.0088)
0.0096*(0.0063) – – FDI_Sector 0.0742***(0.0062)
0.0556***(0.0035) 0.0657***(0.0038)
0.0660***(0.0115)
YearDummy 0.0020*
(0.0014) 0.0027***
(0.0007) 0.0029***
(0.0004) 0.0015***
(0.0001) FirmDummy 0.0001***
(0.0000)a 0.0001*** (0.0000)c 0.0001*** (0.0000)d 0.0000e** (0.0000)f
Sigma-squared 0.0425***
(0.0004) 0.0382***
(0.0004) 0.0414***
(0.0005) 0.0341***
(0.0006) Gamma 0.0369***
(0.0043) 0.0151***
(0.0023) 0.0540***
(0.0036) 0.0746***
(0.0019) Log-likelihood 3493.823 4697.164 3597.36 5417.533 NumberofObservations 21,612 21,613 20,021 20,021
Source:Authors’calculations.
Notes:Y=output,L=labour,K=capital,M=material,E=energyandT=timetrendActualestimatesare:a
0.0000042,b
0.000037c
0.000005d
0.0000076,e
0.000018,f
0.0000066.Standarderrorsareinparentheses. * Significantatthe10%level.
** Significantatthe5%level. *** Significantatthe1%level.
ThecoefficientsofFDI_Sectorforthesub-sampleofonlydomesticfirms(columns3and4)areofthesamesignand significanceasinthecorrespondingfullsampleestimation,butthemagnitudeofimpactissomewhatlowerinthedomestic firmsub-sample.ThissuggeststhatFDIspillovershavesmallerimpactondomesticfirmsthanonforeignfirmsinindustries withlargetechnologygaps.
TheresultsinTable4demonstratethatfirmswithdifferentefficiencylevelsmayreceivedifferenteffectsofFDIspillovers. High-efficiencyfirmstend toobtainnegativespillover effects,while low-efficiencyfirmsexperience positive spillover effects.Thesefindingsconfirmtheargumentthatthereisadvantagefrombeinglessadvancedintermsofefficiencyinterms ofbenefittingfromspillovers(Glass&Saggi,1998;Wang&Blomstrom,1992)andareconsistentwiththeresultsinGriffith
etal.(2002),CastellaniandZanfei(2003),andPeriandUrban(2006).
5. Conclusion
ThisarticleempiricallyexaminesthespillovereffectsofFDIonfirmtechnicalefficiencyintheIndonesianmanufacturing sectorfortheperiodbetween1988and2000.UsingtheframeworkofBatteseandCoelli’s(1995)stochasticproduction frontier,wefindevidenceofapositivespillovereffectofFDItofirmsinthesameindustry(competitors),firmsinanupstream industry(suppliers),andfirmsinadownstreamindustry(buyers).Thepositivespillovereffectis observedinboththe estimationforthefullsampleoffirmsandtheestimationforthesub-sampleofonlydomesticfirms.Notably,theeffectson domesticfirmsaregenerallymorepowerfulthanonotherforeignfirmsinthesameindustry.
Aninterestingfindingemergeswhenthesamplesaredividedintotwogroupsbasedonthelevelofefficiency.Itisfound thatthelow-efficiencyfirmsreceiveapositivespillovereffectfromFDIacrossfirmsinthesameindustry.Incontrast,the high-efficiencyfirmsobtainanegativespillovereffect.Thesefindingssupporttheargumentoftheadvantageforabsorbing spilloversgoestofirmsthatarelessadvancedintermsofefficiency.
OutcomesfromthisstudyprovidesupportonpoliciesthatencourageFDI.Onthebasisofthesefindings,policymakers shouldcontinueprovidinganFDI-friendlyenvironmentinordertomaximizethespillovergains.Additionalincentivesmay beprovidedforforeignfirmsthatarewillingtotransfertheirknowledgetodomesticfirms,especiallythosedomesticfirms inupstreamanddownstreamindustriesthatdonotdirectlycompetewiththeforeignfirm.Variationsinincentivesmay needtobeconsidered,withmorefocusonFDIinsectorswherepurelydomesticfirmshavealow-efficiencylevelcompared tofirmswithdirectforeigninvestment.
Acknowledgements
Helpfulcommentsfromtwoanonymousreferees,editorProfessorMichaelPlummerandassociateeditorProfessorFrank Hsiao,aregratefullyacknowledged,buttheauthorsareresponsibleforanyremainingerrorsoromissions.
Appendix1. Adjustmentsforconstructingaconsistentpaneldata
Thestepsofadjustmentforconstructingaconsistentpaneldataaredescribedasfollows: Step1:Adjustmentforindustrialcode.
TheBPSreclassifiedtheindustrialcodestwice:in1990andin1998.Thisstudyadjuststheindustrialcodestothe1990code (KKI-1990)inordertoobtainaconsistentindustrialcodefortheobservationyears(1988–2000).Thisadjustmentinvolvestwo phases.First,thedatafrom1988to1989(whichuseKKI-1985)areadjustedtoKKI-1990usingtheestablishmentidentification codeandaspecialmapprovidedbytheBPS.Observationsin1988–1989notobservedin1990–1998areremoved,sincethereisno codefromKKI-1990thatcouldbeassignedtotheseobservations.Thisfirstphaseofadjustmentremoves1346outoftheoriginal 29,340establishments.Second,thedatafrom1998to2000(whichuseKKI-1998)areadjustedtoKKI-1990bythefollowing concordancetableprovidedbytheBPS.Thereareseveralconcordanceissuesthatariseduringthissecondphaseofadjustment, whichincludeunmatchedclassificationsandincompleteentries.Anexampleofanincompleteentryisanobservationrecorded onlywithatwo-,three-,orfour-digitclassificationcode.Fordealingwiththisproblem,onlyobservations withfour-digit classification codes are retained, while those with two- and three-digit classification codes are removed. The retained observationswithfour-digitcodesarethenassignedasfive-digitcodesusingtheestablishmentspecificidentificationcode.By doing so, all establishments in the 1988–2000 panel data have consistent and integrated classification codes. The total establishmentsremovedaftertheseindustrialcodeadjustmentsare3078outof29,340establishments,whichincludethosewith OilandGasclassification(ISIC353and354)asthesesub-sectorsarenotobservedinthe1988and1989surveys.
Step2:Adjustmentforthevariabledefinitions.
Insomeyears,thevariabledefinitionsprovidedbytheBPSarenotconsistent,eventhoughthevariablesarethesame.The authorcomparedthevariabledefinitionsineachyear’ssurveyquestionnaires(whichareprovidedbytheBPStogetherwiththeSI data)andrecalculatedtheinconsistentvariablesforobtainingconsistentdefinitionsthroughouttheselectedperiod.
Step3:Cleaningfornoiseandtypographicalerrors.
Thisstudyappliedseveralstepsfordatacleaninginordertominimizenoisesandtypographicalerrors: Suyantoetal./JournalofAsianEconomics33(2014)16–29
a.Observationswithzerooranegativevalueofoutput,labour,material,orenergyhavebeenremoved.Thisremovesaround 4.5percentofthetotalobservations.
b.Ifafirmreportsamissingvalueforaparticularvariableinagiventimebutreportsvaluesintheyearbeforeandafter,an interpolationiscarriedouttofillthegap.Theinterpolationforthemissingdatawasnotmorethan1percentofthetotal observations.
c.Typographicalerrors(orkey-puncherrors)intherawdataareadjustedforconsistency.Forexample,ifintherawdata, foreignshareinafirmforthewholeoftheselectedperiodwastypedas100percent,exceptforacertainyearbeingtyped as0percent,thenthe0percentshareisadjustedto100percent.
d.ObservationsthatareconsideredasoutliersareremovedfromthedatasetbyfollowingaproceduresuggestedbyTakii
(2005).First,observationsaresortedfromthelowesttothehighestvalueofoutput.Second,1.5percentofthelowest
valuesand1.5percentofthehighestvaluesareremoved.
Step4:Back-castingthemissingvaluesofcapital.
Insomeyears,thevaluesofcapitalaremissingforquitealargenumberofobservations.Tofillthesegaps,thisstudyfollows themethodologyintroducedbyVial(2006).
Step5:Matchingfirmsforabalancedpanel
Abalancedpaneldatasetisconstructedfortheselectedperiodbymatchingfirmsbasedonthespecificidentificationcode (PSID).ThisstudyutilizesSTATA10softwareforthematching.
Step6:ChoosingIndustrieswithForeignFirms
SincethepurposeofthestudyistoestimatetheFDIspillovers,industries(atafive-digitlevel)withoutforeignfirmsare excludedfromthebalancedpanel.
Step7:Allmonetaryvariables(output,capital,material,andenergy)aredeflatedusingpriceindexes.Theoutputandmaterial valuesaredeflatedusingthewholesalepriceindex(forfour-digitISICindustries);themachinerypriceindexisusedfordeflating thevalueofcapital;thenominalvaluesofenergy,whichareasumofelectricityandfuelexpenditures,aredeflatedusingthe electricitypriceindexandthefuelpriceindex.Allpriceindexesareataconstantpriceoftheyear1993.
Byfollowingthestepsofadjustment,thefinalbalancepaneldataconsistsof3318establishmentswith43,225observations.
Appendix2. Definitionsofvariables
Symbol Category Unit Definitions
Productionfrontier
Y Output Millionof1993rupiah Grossoutput,whichisdeflatedusingawholesalepriceindexof four-digitISICindustriesataconstantpriceof1993
L Labour Numberofworkers Total number ofemployees directlyand indirectlyengaged in production,whichcoversallworkers,includingtechnical, admin-istration,marketing,storage,andclericalstaffs,whoworkfull-time orpart-time,andalsofamilymembers.
K Capital Millionof1993rupiah Replacement value of fixed assets, which is deflated using a wholesalepriceindexformachineryoffour-digitISICindustriesata constantpriceof1993.
M Material Millionof1993rupiah Totalvalueofmaterialusedinproduction,whichcoverrawand intermediatematerials,bothdomesticallyproducedandimported deflatedusingawholesalepriceindexoffour-digitISICindustries ataconstantpriceof1993.
E Energy Millionof1993rupiah Totalvalueofelectricityandfuelusedby afirm.Thevalueof electricityiscalculatedfromtheelectricityprovidedbythestate energy company (PerusahaanListrik Negara orPLN)and those provided by private power firms, andit is deflated usingthe wholesaleelectricityindexataconstantpriceof1993.Thevalueof fuelsarecalculatedfromninetypesoffuels,namelypremium, solar,kerosene,coal,cokes,gas,firewood,lubricant,andotherfuels, anditisdeflatedusingtheOECDpriceoffuelspublishedbyDXfor Windowsatthe1993constantprice.
T Timetrend Takeavalueofonefor1988,valueoftwofor1989,andsoon.
FDI_Sector FDIVariable Ratio Theshareofforeignfirms’outputovertotaloutputsinafive-digit industry,orcanbeexpressedasinEq.(5).Thisvariablemeasures theintra-industry(orhorizontal)spillovers.
Inefficiencyfunction
FDI_Firm FDIvariable Binary(oneorzero) TheFDIatthefirmlevel,whichtakesavalueofoneifafirmhasa positiveforeignownershipandtakeavalueofzeroifotherwise.
FDI_Sector FDIvariable Ratio Theshareofforeignfirms’outputovertotaloutputsinafive-digit industry,orcanbeexpressedasinEq.(5).Thisvariablemeasures theintra-industry(orhorizontal)spillovers.
FDI_Downstream_Sector FDIvariable Ratio Spilloversfromforeignfirmsinindustriesk(k6¼j)thatarebeing suppliedbydomesticfirmsinindustriesjisdefinedasinEq.(6).
Appendix1(Continued)
Symbol Category Unit Definitions
FDI_Upstream_Sector FDIvariable Ratio Spilloversfromforeignfirmsinindustriesm(m6¼n)thatselltheir outputstodomesticfirmsinindustriesnisdefinedasinEq.(6).
Year Dummyvariable Ayeardummy,whichtakesavalueofoneforallobservationsfor theyearinquestion,andavalueofzeroforotheryears.
Industry Dummyvariable Anindustrydummy,whichhasavalueofoneforallobservations fortheindustryinquestionandavalueofzeroforotherindustries.
Firm Dummyvariable Afirmdummy,whichhasavalueofoneforallobservationsforthe firminquestionandavalueofzeroforeveryother.
References
Aigner,D.J.,Lovell,C.A.K.,&Schmidt,P.(1977).Formulationandestimationofstochasticfrontierproductionfunctionmodels.JournalofEconometrics,6(1), 21–37.
Aitken,B.J.,&Harrison,A.E.(1999).DoDomesticFirmsBenefitfromDirectForeignInvestment?EvidencefromVenezuela.TheAmericanEconomicReview,89(3), 605–618.
Baltagi,B.D.(2011).Econometrics(5thedition).Heidelberg:Springer.
Banker,R.D.,Charnes,A.,&Cooper,W.W.(1984).Somemodelsforestimatingtechnicalandscaleinefficiencyindataenvelopmentanalysis.ManagementScience, 30(9),1078–1092.
Battese,G.,&Coelli,T.J.(1988).Predictionoffirm-leveltechnicalefficiencieswithageneralizedfrontierproductionfunctionandpaneldata.Journalof Econometrics,38(3),387–399.
Battese,G.E.,&Coelli,T.J.(1993).AStochasticFrontierProductionFunctionIncorporatingaModelforTechnicalInefficiencyEffects.WorkingPaperin EconometricsandAppliedStatistics,DepartmentofEconomicsUniversityofNewEngland.
Battese,G.E.,&Coelli,T.J.(1995).Amodelfortechnicalinefficiencyeffectsinastochasticfrontierproductionfunctionforpaneldata.EmpiricalEconomics,20(2), 325–332.
Bauer,P.W.(1990).Recentdevelopmentsintheeconometricestimationoffrontiers.JournalofEconometrics,46(1–2),39–56.
Bjurek,H.L.,Hjarmarsson,L.,&Forsund,F.R.(1990).Deterministicparametricandnonparametricestimationinserviceproduction.JournalofEconometrics,46(1– 2),213–227.
Blalock,G.,&Gertler,P.J.(2008).Welfaregainfromforeigndirectinvestmentthroughtechnologytransfertolocalsuppliers.JournalofInternationalEconomics, 74(2),402–421.
Blomstrom,M.,&Kokko,A.(1998).Multinationalcorporationandspillovers.JournalofEconomicSurveys,12(2),247–277.
Bravo-Ureta,B.E.,&Pinheiro,A.E.(1993).Efficiencyanalysisofdevelopingcountryagriculture:Areviewofthefrontierfunctionliterature.Agriculturaland ResourceEconomicsReview,22(1),88–101.
Castellani,D.,&Zanfei,A.(2003).Technologygaps,absorptivecapacityandtheimpactofinwardinvestmentsonproductivityofEuropeanfirms.Economicsof InnovationandNewTechnology,12(6),555–576.
Caves,R.E.(1971).Internationalcorporations:Theindustrialeconomicsofforeigninvestment.Economica,38(149),1–27.
Caves,R.E.(1974).Multinationalfirms,competitionandproductivityinhostcountrymarkets.Economica,41(162),176–193.
CentralBankofIndonesia(2011).EconomicandfinancialdataforIndonesia.
Chakraborty,C.,&Nunnenkamp,P.(2008).Economicreforms,FDI,andeconomicgrowthinIndia:Asectorlevelanalysis.WorldDevelopment,36(7),1192–1212.
Charnes,A.,Cooper,W.W.,&Rhodes,E.(1978).Measuringtheefficiencyofdecisionmakingunits.EuropeanJournalofOperationalResearch,2(6),429–444.
Coelli,T.J.(1995).Recentdevelopmentsinfrontiermodellingandefficiencymeasurement.AustralianJournalofAgriculturalEconomics,39(3),219–245.
Coelli,T.J.(1996).Aguidetofrontierversion4.1.acomputerprogramforstochasticfrontierproductionandcostfunctionestimation.CEPAWorkingPaperNo.07/ 96UniversityofNewEngland.
Coelli,T.J.,Rao,D.S.P.,O‘Donnell,C.J.,&Battese,G.E.(2005).Anintroductiontoefficiencyandproductivityanalysis(2nded.).NewYork:Springer.
Dimelis,S.,&Lauri,H.(2002).Foreigndirectinvestmentandefficiencybenefits:Aconditionalquartileanalysis.OxfordEconomicPapers,54(3),449–469.
Djankov,S.,&Hoekman,B.(2000).ForeigninvestmentandproductivitygrowthinCzechenterprises.WorldBankEconomicReview,14(1),49–64.
Dunning,J.(1988).Multinationaltechnologyandcompetitiveness.London:Allen&Unwin.
Findlay,R.(1978).Relativebackwardness,directforeigninvestment,andthetransferoftechnology:Asimpledynamicmodel.QuarterlyJournalofEconomics, 92(1),1–16.
Forsund,F.R.C.A.K.,Lovell,P.,&Schmidt(1980).Asurveyoffrontierproductionfunctionsandoftheirrelationshiptoefficiencymeasurement.Journalof Econometrics,13(1),5–25.
Ghali,S.,&Rezgui,S.(2008).FDIcontributiontotechnicalefficiencyintheTunisianmanufacturingsector.ERFWorkingPaperSeriesNo.421. Glass,A.,&Saggi,K.(1998).Internationaltechnologytransferandthetechnologygap.JournalofDevelopmentEconomics,55(2),369–398.
Gorg,H.,&Greenaway,D.(2004).Muchadoaboutnothing?Dodomesticfirmsreallybenefitfromforeigndirectinvestment?.TheWorldBankResearchObserver, 19(2),171–197.
Gorg,H.,&Strobl,E.(2005).Spilloversfromforeignfirmsthroughworkermobility:Anempiricalinvestigation.ScandinavianJournalofEconomics,107(4),693– 739.
Greene,W.H.(1993).InH.O.Fried,C.A.K.Lovell,&S.S.Schmidt(Eds.),Theeconometricapproachtoefficiencyanalysis.Themeasurementofproductiveefficiency: Techniquesandapplications.NewYork:OxfordUniversityPress.
Griffith,R.,Redding,S.,&Simpson,H.(2002).ProductivityConvergenceandForeignOwnershipattheEstablishmentLevel.InstituteFiscalStudiesWorkingPaper 22,London.
Haddad,M.,&Harrison,A.E.(1993).Aretherepositivespilloversfromforeigndirectinvestment?EvidencefrompaneldataforMorocco.JournalofDevelopment Economics,42(1),51–74.
Hu,A.G.Z.,&Jefferson,G.H.(2002).FDIimpactandspillover:Evidencefromchina’selectronicandtextileindustries.TheWorldEconomy,25(8),1063–1076.
Hymer,S.H.(1960).(PhDdissertation).InTheinternationaloperationsofnationalfirms:Astudyofdirectforeigninvestment(p.1976).MIT,MA:MITPress.
Javorcik,B.S.(2004).Doesforeigndirectinvestmentincreasetheproductivityofdomesticfirms?Insearchofspilloversthroughbackwardlinkages.American EconomicReview,94(3),605–627.
Kugler,M.(2006).Spilloversfromforeigndirectinvestment:Withinorbetweenindustries?JournalofDevelopmentEconomics,80(2),444–477.
Kumbhakar,S.C.,Ghosh,S.,&McGuckin,J.T.(1991).AgeneralizedproductionfrontierapproachforestimatingdeterminantsofinefficiencyinUSdairyfarms. JournalofBusinessandEconomicStatistics,9(3),279–286.
Liang,F.H.(2007).Doesforeigndirectinvestmentimprovetheproductivitiesofdomesticfirms?Technologyspilloverswithinandbetweenindustries.Haas BerkeleyWorkingPaper.http://www.faculty.haas.berkeley.edu/fenliang/research/spillover/FDIspillover.pdf[accessed20.07.07].
Lipsey,R.E.,&Sjoholm,F.(2005).InT.H.Moran,E.Graham,&M.Blomstrom(Eds.),TheimpactofinwardFDIonHostcountries:Whysuchdifferentanswers?does foreigndirectinvestmentpromotedevelopment?(pp.23–43).Washington,DC:InstituteforInternationalEconomicsandCenterforGlobalDevelopment.
Lovell,C.A.K.(1993).InH.O.Fried,C.A.K.Lovell,&S.S.Schmidt(Eds.),Productionfrontiersandproductiveefficiency.Themeasurementofproductiveefficiency: Techniquesandapplications.NewYork:OxfordUniversityPress.
Suyantoetal./JournalofAsianEconomics33(2014)16–29
Meeusen,W.,&vandenBroeck,J.(1977).Efficiencyestimationfromcobb–douglasproductionfunctionwithcomposederror.InternationalEconomicReview, 18(2),435–444.
Negara,S.D.,&Firdausy,C.M.(2011).InC.Sussangkarn,Y.C.Park,&S.J.Kang(Eds.),Thedevelopmentofforeigndirectinvestmentanditsimpactonfirms’ productivity,employmentandexportsinIndonesia.ForeigndirectinvestmentsinAsia.London,UK:Routledge.
Olesen,O.B.,Peterson,N.C.,&Lovell,C.A.K.(1996).Editors’introduction.JournalofProductivityAnalysis,7(2/3),87–98.
Peri,G.,&Urban,D.(2006).Catchinguptoforeigntechnology?Evidenceonthe‘Veblen-Gerschenkron’effectofforeigninvestments.RegionalScienceandUrban Economics,36(1),72–98.
Schiff,M.,&Wang,Y.(2008).North–SouthandSouth–Southtrade-relatedtechnologydiffusion:howimportantaretheyinimprovingTFPgrowth?Journalof DevelopmentStudies,44(1),49–59.
Schmidt,P.(1985).Productionfrontierfunctions.EconometricReviews,4(2),289–328.
Smeets,R.A.(2008).CollectingthepiecesoftheFDIknowledgespilloverspuzzle.TheWorldBankResearchObserver,23(2),107–138.
Suyanto,Salim,R.,&Bloch,H.(2009).Doesforeigndirectinvestmentleadtoproductivityspillovers?FirmlevelevidencefromIndonesia.WorldDevelopment, 37(12),1861–1877.
Suyanto,Bloch,H.,&Salim,R.(2012).FDIspilloversandproductivitygrowthinIndonesiangarmentandelectronicsmanufacturing.JournalofDevelopmentStudies (inpress).
Takii,S.(2005).ProductivityspilloversandcharacteristicsofforeignmultinationalplantsinIndonesianmanufacturing1990–1995.JournalofDevelopment Economics,76(2),521–542.
Takii,P.(2011).DoFDIspilloversvaryamonghomeeconomies?EvidencefromIndonesianmanufacturing.JournalofAsianEconomics,22(2),152–163.
Temenggung,D.(2007)Productivityspilloversfromforeigndirectinvestment:Indonesianmanufacturingindustry’sexperience1975–2000,mimeograph, AustralianNationalUniversity,Canberra,Australia.
Vial,V.(2006).NewestimatesoftotalfactorproductivitygrowthinIndonesianmanufacturing.BulletinofIndonesianEconomicStudies,42(3),357–369.
Wang,J.W.,&Blomstrom,M.(1992).Foreigninvestmentandtechnologytransfer:Asimplemodel.EuropeanEconomicReview,36(1),137–155.
Wang,H.J.,&Schmidt,P.(2002).One-stepandtwo-stepestimationoftheeffectsofexogenousvariablesontechnicalefficiencylevel.JournalofProductivity Analysis,18(2),129–144.