JOURNAL OF
e
sian
Econon1ics
Full Length Articles
Arup Mrtra. Chandan Sharma, Mane-Ange Veganzones-Varoudakis,
Trade liberalization. technology transfer. and hrms productive
performance. The case of lndran manufacturing
Suyanto. Ruhul Salim. Harry Bloch, Which
ヲセイュウ@benefrt from
forergn direct Investment?
eューセイゥ」。ャ@evidence from Indonesian
manufacturing
16Kazunobu Hayakawa Kenmei Tsubota. Locatron chorce in
low-income countnes Evidence from Japanese rnvestments
in East Asia
30
Rashid Ameer, Frnancial constraints and corporate investment rn
Asian countries
44
Scimago Journal & Country Rank
Home
Journal Rankings
Country Rankings
Viz Tools
Help
About Us
Journal of Asian Economics
Country
Netherlands
35
H Index
Subject Area and
Category
Economics, Econometrics and Finance
Economics and Econometrics
Finance
Publisher
Elsevier BV
Publication type
Journals
ISSN
10490078
Coverage
1990-ongoing
Scope
The Journal of Asian Economics provides a forum for publication of increasingly growing
research in Asian economic studies and a unique forum for continental Asian economic
studies with focus on (i) special studies in adaptive innovation paradigms in Asian economic
regimes, (ii) studies relative to unique dimensions of Asian economic development paradigm,
as they are investigated by researchers, (iii) comparative studies of development paradigms in
other developing continents, Latin America and Africa, (iv) the emerging new pattern of
comparative advantages between Asian countries and the United States and North America.
(
source
)
Enter Journal Title, ISSN or Publisher Name
Quartiles
The set of journals have been ranked according to their SJR and divided into four equal groups, four quartiles. Q1 (green)
comprises the quarter of the journals with the highest values, Q2 (yellow) the second highest values, Q3 (orange) the third
highest values and Q4 (red) the lowest values.
Category
Year
Quartile
Economics and Econometrics
1997
Q3
Economics and Econometrics
1998
Q3
Economics and Econometrics
1999
Q4
Economics and Econometrics
2000
Q3
SJR
The SJR is a size-independent prestige indicator that
ranks journals by their 'average prestige per article'. It is
based on the idea that 'all citations are not created
equal'. SJR is a measure of scienti c in uence of
journals that accounts for both the number of citations
received by a journal and the importance or prestige of
Citations per document
This indicator counts the number of citations received
by documents from a journal and divides them by the
total number of documents published in that journal.
The chart shows the evolution of the average number of
times documents published in a journal in the past two,
three and four years have been cited in the current year.
1997 1999 2001 2003 2005 2007 2009 2011 2013 2015
Economics and Econometrics
the journals where such citations come from It
measures the scienti c in uence of the average article
in a journal, it expresses how central to the global
The two years line is equivalent to journal impact factor
™
(Thomson Reuters) metric.
Cites per document
Year
Value
Cites / Doc. (4 years)
1999
0.126
Cites / Doc. (4 years)
2000
0.250
Cites / Doc. (4 years)
2001
0.179
Cites / Doc. (4 years)
2002
0.327
Cites / Doc. (4 years)
2003
0.713
Cites / Doc. (4 years)
2004
0.718
Cites / Doc. (4 years)
2005
0.593
Cites / Doc. (4 years)
2006
0.754
Cites / Doc. (4 years)
2007
0.677
Cites / Doc. (4 years)
2008
0.758
Total Cites
Self-Cites
Evolution of the total number of citations and journal's
self-citations received by a journal's published
documents during the three previous years.
Journal Self-citation is de ned as the number of citation
from a journal citing article to articles published by the
same journal.
Cites
Year
Value
Self Cites
1999
2
External Cites per Doc
Cites per Doc
Evolution of the number of total citation per document
and external citation per document (i.e. journal
self-citations removed) received by a journal's published
documents during the three previous years. External
citations are calculated by subtracting the number of
self-citations from the total number of citations
received by the journal’s documents.
Cites
Year
Value
% International Collaboration
International Collaboration accounts for the articles that
have been produced by researchers from several
countries. The chart shows the ratio of a journal's
documents signed by researchers from more than one
country; that is including more than one country
address.
Year
International Collaboration
1999
13.79
Citable documents
Non-citable documents
Not every article in a journal is considered primary
research and therefore "citable", this chart shows the
ratio of a journal's articles including substantial
research (research articles, conference papers and
reviews) in three year windows vs. those documents
other than research articles, reviews and conference
papers.
Documents
Year
Value
Cited documents
Uncited documents
Ratio of a journal's items, grouped in three years
windows, that have been cited at least once vs. those
not cited during the following year.
Documents
Year
Value
Uncited documents
1999
83
Uncited documents
2000
70
Uncited documents
2001
64
Uncited documents
2002
54
←
Show this widget in
your own website
Just copy the code below
and paste within your html
code:
<a href="http://www.scimagojr.com/journalsearch.php?q=22736&tip=sid&exact=no" title="SCImago Journal & Country Rank"><img border="0" src="http://www.scimagojr.com/journal_img.php?id=22736" alt="SCImago Journal & Country Rank" /></a>
0.75 0.3 0.6 0.9 1.2 1.5 1.8
1999 2002 2005 2008 2011 2014
0 200 400
1999 2002 2005 2008 2011 2014
0 0.7 1.4 2.1
1999 2002 2005 2008 2011 2014
0 25 50
1999 2002 2005 2008 2011 2014
0 100 200
1999 2002 2005 2008 2011 2014
Developed by:
Powered by:
Follow us on
Editorial Board
Editor-in-Chief:
Michael G. Plummer
The Johns Hopkins University, School of Advanced International Studies, Bologna Center aウウッ」ゥセエ・@ Ed.itors:
R. Click. The Elliott School of lntemational Affairs, The George Washington University, Washington. USA M. Dt.ogey, Institute of Management, Trumpington. Cambridge. UK
K . Hamada, Department of Economics, Yale University. New Haven. USA F. Hsiao, Department of Economics, University of Colorado. Colorado, USA S.L. Husted, Economics Department, University of Pittsburgh. Pittsburgh, USA J . Riedel. School of Advanced International Studies Johns Hopkins University. Maryland, USA
S. Abe, Kyoto, Japan L.A. Winters, Brighton. UK
R. Baht. Atlanta. GA, USA J .R. Behrman, Philadelphia, PA. USA S. Bhuyan, New Brunswick . NJ, USA G.M. Bodnar. Washington DC, USA G. Capannelli, Manila. Philippines
C.C.·Y. Chu, Taipei. Taiwan W. Dobson, Toronto, ONT, Canada
D. Ely. San Diego, CA. USA D.J. Green. Manila. Philippines A.E. Harrison, Berkeley. CA. USA
H. H1ll, Canberra. Australia
G.C. Chow , Pr1nceton, NJ. USA J.M. Dowling. SMU. Singapore A. Heston, Philadelphia. PA. USA
G.H . Jefferson. Waltham . USA S.M. Khan, Bloomsburg. PA, USA
C.H. Lee. Honolulu. HI. USA
Executiw Editors:
M.M. Hutchison, Santa Cruz. CA. USA K. Kalirajan, Tokyo. Japan J.M. Kang. DeKalb, IL, USA
B.K. Kapur, Singapore M. Kishi, Tokyo, Japan A. Kose. Washington, D.C. USA R.F. Kosobud, Chicago, IL, USA S.Y. Kwack, Washington. DC, USA
S. La Croix, Hawaii, USA E. Leamer Los Angeles. CA. USA
K. Lee, Seoul, KQ(ea J. Menon, Manila. Philippines
M. Merva, Rome, Italy
Senior Editors:
J .M. Letiche, Berkeley, CA. USA K. Marwah , Ottawa, ONT, Canada
A. Nasution, Jakarta. 1ndone51a T. Ozawa. Fort Collins. CO. USA G. Papanek,Lexington. MA. USA H.T. Patrick, New York, NY, USA
Book Review Editors:
S . Bhuyan, Rutgers University M. Merva. John Cabot University
Founding Editor:
m Ndオ ョセ@
Rutgers University. New Brunswick. NJ , USA
Articles in Journal of Asian Economics abstracted in Asian Pacific Economic Literature.
C .-G . Moon, Seoul, KQ(ea E. Ogawa. Tokyo, Japan P. Petri, Waltham, MA, USA S. Pitayanon, Bangkok, Thailand M .G. Quibria, Newton, MA, USA
R. Ram, Normal, IL, USA E. Ramstetter, Kitakyushu, Japan S.E. Reynolds. Salt Lake City, UT, USA
S .C. Sharma, Carbondale, IL, USA C. Tuan, Shatin, NT, Hong Kong
J.P. Vere, HUHK, Hong Kong G. Wignaraja, Manila. Philippines
J.P. Winder, New York, USA
D.H. Perkins, Cambridge, MA. USA
Y. Sazanami , Tokyo. Japan A.M. Stem, Ann Arbor. MI. USA J .T.H. Tsao, Potomac, MD, USA
Also covered in the abstract and citation database Scopus®. Full text available on ScienceDirect®.
For a full and complete Guide for Authors, please go to: http://www.elsevier.com/locate/asieco
Journal
of Asian
Economics
Vol. 33
Aims and Scope:
The
journal of
Asian
Economics
provides a forum for publication of increasingly growing research in Asian economic studies
and a unique forum for continental Asian economic studies with focus on (i) special studies in adaptive innovation paradigms in Asian
economic regimes,
(ii)studies relative to unique dimensions of Asian economic development paradigm. as they are investigated by
researchers,
(iii)comparative studies of development paradigms in other developing continents. Latin America and Africa. (iv) the emerging
new pattern of comparative advantages between Asian countries and the United States and North America, and (v) the emerging economic
dimensions following the onecurrency based European Economic Community and the new economic reforms in the Soviet Union and in
Eastern European Countries.
Publication Information:
journal of
Asian
Economics
(ISSN 1049-0078). For
2014. Volumes
30C- 35Cis scheduled for publication.
Subscription prices are available upon request from the Publisher or from the Elsevier Customer Service Department nearest you or from
this journal's website (http:/fwww.elsevier.com/locatefasieco). Further information is available on this journal and other Elsevier products
through Elsevier's website (http:/fwww.elsevier.com). Subscriptions are accepted on a prepaid basis only and are entered on a calendar
year basis. Issues are sent by standard mail (surface within Eu rope, air delivery outside Europe). Priority rates are available upon request.
Oaims for missing issues should be made within six months of the date of dispatch.
Advertising
information: If you are interested in advertising or other commercial opportunities please e-mail Commercialsales@elsevier.com
and your inquiry will be passed to the correct person who will respond to you within 48 hours.
Author inquiries
For inquiries relating to the submission of articles (including electronic submission) please visit this journal's homepage at http://www.
elsevier.com/locate/asieco. For detailed instructions on the preparation of electronic artwork. please visit http:/fwww.elsevier.com/
artworkinstructions. Contact details for questions arising after acceptance of an article, especially those relating to proofs, will be
provided by the publisher. You can track accepted articles at http://www.elsevier.com/trackarticle. You can also check our Author FAQs at
http:lfwww.elsevier.com/authorFAQ and/or contact Customer Support via http://support.elsevier.com.
Orders,
claims, and journal inquiries: please contact the Elsevier Customer Service Department nearest you:
St. Louis: Elsevier Customer Service Department, 3251 Riverport Lane, Maryland Heights, MO 63043. USA; phone: (877) 8397126(toll
free within the USA
I; (
+ 1 )(314) 44788781 outside the USA); fax: ( + 1 )(314) 4478077; e-mail: journaiCustomerService-usa@elsevier.com
Oxford:
Elsevier Customer Service Department, The Boulevard, Langford Lane, Kidlington. Oxford OX5 1GB. UK; phone: (+44) (1865)
843434; fax: ( +44) (1865) 843970; e-mail: journalsCustomerServiceEMEA@elsevier.com
Tokyo: Elsevier Customer Service Department. 4F Higash i-Azabu, 1-Chome Bldg, 1-9-15 Higashi-Azabu. Minato-ku. Tokyo 1 06-0044,japan;
phone: (+81) (3) 5561 5037; fax : (+81 } (3) 5561 5047; e-mail: journalsCustomerServicejapan@elsevier.com
Singapore: Elsevier Customer Service Department, 3 Killiney Road. #08-01 Wins land House I. Singapore 239519; phone: (+65) 63490222;
fax: ( +65) 6733151
O;e-mail: joumalsCustomerServiceAPAC@elsevier.com
Funding
bodyagreements and poUdes
Elsevier has established agreements and developed policies to allow authors whose art.icles appear in journals published by Elsevier, to comply with
potential manuscript archiving requirements as specified as conditions of their grant awards. To learn more about existing agreements and policies
please visit http:lfwww.elsevier.com/fundingbodies
IUustration services
Elsevier's WebShop (http:flwebshop.elsevier.com/illustrationservices) offers lllusrration Services to authors preparing to submit a manuscript
but concerned about the quality of the images accompanying their article. Elsevier's expert illustrators can produce scientific. technical and
medical-style images. as well as a full range of charts. tables and graphs.lmage 'polishing' is also available, where our illustrators take your image(s)
and improve them to a professional standard. Please visit the website
tofind out more.
Language (Usage and Editing services)
Please write your text in good English (American or British usage is accepted, but not a mixture of these). Authors who feel their
English language manuscript may require editing to eliminate possible grammatical or spelling errors and to conform to correct
scientific English may wish to use the English Language Editing service available from Elsevier's WebShop http://webshop.elsevier.com/
languageediting/ or visit our customer support site http:/lsupport.elsevier.com for more information.
The American Committee on Asian Economic Studies (ACAES)
An Inter-university (Nonprofit) Program Founded in 1982
Executive Board: Life Members
Romeo M . Bautista, International Food Policy Research Institute; gイセッイケ@ C. Chow, Princeton University; M. Dutta, Rutgers University; H. Peter Gray, Rensselaer Polytechntc Institute at Troy, NY; Ricnard Hooley, University of Pittsburgh; F. Tomasson Januzi, University of Texas at Austin ; Gary H. Jefferson, Brandeis Umversity; Lawrence A. Klein, University of fYennsylvania; Richard F. Kosobud, University of Illinois at Chicago; Lawrence B. Krause, University of California at San Diego; Lawrence J . Lau, Stanford
University; Chung H. Lee, University of Hawaii at Manoa; Woo セ@ Lee, Bloomsburg University of Pennsytvania; John M. Letiche, University of California at Berkeley; Edward J. Lincoln, The Brookmgs Institution; Kanta Marwah, Csrleton University; James I. Nakarmura, Columbia University; Walter C. Neale, University of Tennessee; Gustav F. Papanek, Boston University; Hugh T. Patrick, Columbia University; Dwight H. Per1<ins, Harvard University; James Riedel, Johns Hopkins University; George Rosen, University of 1//inois at Chicago; Vernon W. Ruttan, University of Minnesota; Kazuo Sato, Rutgers University; Ryuzo Sato, New York University: T.N. Srinivasan, Yale University; Joseph J . Stem, Harvard University; Paul P. Streeten, Boston University; Vincent Su, The Ctty University of New York; Anthony M . t。セN@ Vanderbilt University; James T.H. Tsao, U.S. International Trade Commission; Yien-1 Tu, University of Arkansas at Fayetteville; Calla Wiemer. University of Hawaii at Manoa; Jang H. Yoo, Korea Institute for International Economtc Policy.
M. DUlTA, PRESIDENT AND CHIEF EXECUTIVE OFFICER, 1982-2002
Executive Board: Term Members (Term Ends Dec. 3, 2012)
Edna E. Ehrtich, Erlich International Consulting, New Yor1<, edna_ehrlich88@netzero.net; David Jay Green, Asian Development Bank, Manila, dgreen@adb.org; Frank Hsaio, University of Colorado at Boulder, hsiao@spot.colorado.edu; Steven L. Husted, University of Pittsburgh, husted1+@pltt.edu; Saleem Khan, Bloomsburg University, skhan@planetx.bloomu.edu; sオセ@ Y. Kwack, Howard University, skwack@howard. edu; Hiro l・・LセN@ Nagoya University, Nagoya, Japan, hlee@rieb.kobe-u.ac.jp; Gene Gruver, University of Pittsburgh. gruver+@pitt.edu; Balwant >:)ingh, Bucknell University, singh@bucknell.edu; Sumner LaCroix, Un/verstty of Hawaii, lacroix@hawaii.edu; Keun Lee, Seoul National University, klee1012@plaza .snu.ac.kr; Eric Ramstetter, International Centre for the Study of East Asian Development, ramst@lcsead .or.jp.
Board of Trustees: (2001-2012)
Jere Behrman, University of Pennsylvania, jbehrman@ssc.upenn.edu Members: Richard Kosobud, kosobud@uic.edu
Calla Weimer, cjweimer@hotmail .com
Richard Hooley, President and Chief Executive Officer, University of Pittsburgh, rhooley@pitt.edu
Jere Berrman, Vice President, ... James Riedel, Johns Hopkins University, jriedel@mail.jhuwash.jhu.edu
Executive Officers: (2007-2012):
Director: Michael G. Plummer,
The
Johns Hopkins University, SAIS-Bologna mplummer@jhubc.it; Vice-Director: Chung Lee, lchung@hawaii.edu; Assoc. Directors: Frank Hsiao, University of Colorado, frank.hsiao@colorado.edu; Richard Hooley, University of Pittsburgh , rhooley@pitt.edu; Steven L. Husted, University of Pittsburgh , husted1+@pitt.edu;Gary
H. Jefferson, Brandeis University jefferson@binah.cc.brandeis.edu; Treasurer: Stephen Husted, University of Pittsburgh, husted1+@pltt.eduNomination and Election Committee (2001- 2012)
James Tsao (Chair), George Washington University, tsao@erols.com; John Letiche, University of Cslifomia (Ber1<efey), jletiche@econ. ber1<eley.edu;
Banker.
C>
2014 Elsevier Inc.
This journal and the individual contributions contained in it are protected under copyright, and the following terms and conditions
apply to thei r use in addition
tothe terms of any Creative Commons or other user license that has been applied by the publisher to an
individual article:
Photocopying
Single photocopies of si ngle articles may be made for personal use
asallowed by national copyright laws. Permission is not required
for photocopying of articles published under the CC BY license nor for photocopying for non-commercial purposes in accordance with
any other user license applied by the publisher. Permission of the publisher and payment of a fee is required for all other photocopying,
including multiple or systematic copying. copying for advertising or promotional purposes. resale. and all forms of document delivery.
Special rates are ava ilable for educational institutions that wish to make photocopies for non-profit educational classroom use.
DerlvatJft Works
Users may reproduce tables of contents or prepare lists of articles including abstracts for internal circulation within their institutions or
companies. Other than for articles published under the CC BY license, permission of the publisher is required for resale or distribution
outside the subscribing institution or compa ny.
For any subscribed articles or articles published under a CC BY -NC-ND license, permission of the publisher is req uired for all other
derivative works, including com pilations and translations.
Storage or Usage
Except as outlined above or as set out in the relevant user license. no part of th is publication may
bereproduced. stored in a retrieval
system or transmitted in any form or by any means. electronic. mechanical. photocopying. recording or otherwise. without prior written
permission of the publisher.
Permissions
For information on how to seek permission visit www.elsevier.comfpermissions or call: ( +44) 1865 843830 (UK)
I (
+ 1) 215 239 3804
(USA).
Author rights
Author{s) may have additional rights in their articles as set out in their agreement with the publisher (more information at http:f/www.
elsevier.com/authorsrights).
Notke
No responsibility is assumed by the Publisher for any injury and/or damage to persons or property as
a
matter of products liability, negligence
or otherwise. or from any use or operation of any methods, products, instructions or ideas contained in the material herein. Because of rapid
advances in the medical sciences, in particular, independent verification of diagnoses and drug dosages should
bemade.
Which
firms
benefit
from
foreign
direct
investment?
Empirical
evidence
from
Indonesian
manufacturing
Suyanto
a,
Ruhul
Salim
b,*
,
Harry
Bloch
ba
FacultyofEconomics,UniversityofSurabaya,EastJava,Indonesia
b
CurtinBusinessSchool,CurtinUniversity,Perth,WA6845,Australia
1. Introduction
Thespillovereffectsofforeigndirectinvestment(FDI)havebeenamajorconcernforresearchersandpolicymakers
duringthelasttwodecades.AnumberofstudieshaveexaminedthespillovereffectsofFDIondomesticfirmproductivity
(Chakraborty&Nunnenkamp,2008;Haddad&Harrison,1993;Hu&Jefferson,2002;Javorcik,2004;Liang,2007;Negara& Firdausy,2011;Takii,2005,2011). Thesestudiesprovidesomeusefulinsightsregarding theevidenceof thespillover
benefitsand offersomerecommendationstomaximizethebenefits.However, mostexistingstudiesexcludetechnical
efficiencyandfocusmainlyontechnology,ignoringthattheFDIpresenceinhostcountriesistheimpetusforefficiency
improvementthroughcompetitionanddemonstrationeffects(Wang&Blomstrom,1992).AstudyofFDIspillovereffectson
firm-leveltechnicalefficiencyisimportanttoprovideevidenceastowhetherthelargeamountofFDIinflowsgenerate
positiveexternalitiestodomesticfirmsthroughefficiencyimprovement,thusindicatingwhetherthespilloverhypothesisis
justifiedinthecontextoftechnicalefficiency.SuchastudycanexploretowhatextentFDIcaninduceefficiencyspillovers,
andwhichfirmtypesreallybenefitfromthespillovers.
JournalofAsianEconomics33(2014)16–29
ARTICLE INFO
Articlehistory:
Received22November2012 Receivedinrevisedform8May2014 Accepted11May2014
Availableonline19May2014
JELclassification:
D24 D29 F23
Keywords:
Foreigndirectinvestment Spillovereffects Technicalefficiency Stochasticproductionfrontier Indonesia
ABSTRACT
Despitegrowingconcernregardingtheproductivitybenefitsofforeigndirectinvestment (FDI),veryfewstudieshavebeenconductedontheimpactofFDIonfirm-leveltechnical efficiency.Thisstudyhelpsfillthisgapbyempiricallyexaminingthespillovereffectsof FDIonthetechnicalefficiencyofIndonesianmanufacturingfirms.Apaneldatastochastic productionfrontier(SPF)methodisappliedto3318firmssurveyedovertheperiod1988– 2000. The results reveal evidence of positive FDI spillovers on technical efficiency. Interestingdifferencesemergehoweverwhenthesamplesaredividedintotwoefficiency levels.High-efficiencydomesticfirmsreceivenegativespillovers,ingeneral,while low-efficiencyfirmsgainpositivespillovers.Thesefindingsjustifythehypothesisofefficiency gaps,thatthelargeristheefficiencygapbetweendomesticandforeignfirmstheeasierthe formerextractsspilloverbenefitsfromthelatter.
ß2014ElsevierInc.Allrightsreserved.
*Correspondingauthorat:SchoolofEconomics&Finance,CurtinBusinessSchool,CurtinUniversity,WA6845,Australia.Tel.:+61892664577; fax:+6192663026.
E-mailaddress:Ruhul.Salim@cbs.curtin.edu.au(R.Salim).
ContentslistsavailableatScienceDirect
Journal
of
Asian
Economics
http://dx.doi.org/10.1016/j.asieco.2014.05.003
Amongthedevelopingeconomies,IndonesiaisparticularlysuccessfulinattractingFDI.NetFDIinflowstoIndonesiahave
risenmorethan30timessince1986,reachingarecordlevelofUS$8.3billionin2008(theCentralBankofIndonesia,2011).
However,thereisadearthofresearchonefficiencyspilloversinIndonesia.Mostempiricalstudiesexaminespillovereffects
undera frameworkofthelong-runequilibriumproductionfunction,whichassumesthatfirmsareproducingata full
efficiencylevel.Underthisframework,theFDIspilloversontechnicalefficiencyarenotcaptured.
Twopreviousstudiesbytheauthorsfocusontechnicalefficiencyusingastochasticproductionfrontierframeworkfor
individual Indonesian manufacturing industries. Suyanto, Salim, and Bloch (2009) examine the pharmaceutical and
chemicalindustries,whileSuyantoetal.(2012)examinetheelectronicandgarmentindustries.However, thereareno
studiesprovidingcomprehensiveresultsforthewholeIndonesianmanufacturingsectorusingastochasticframework.
AstudybyTemenggung(2007)examinesthewholeIndonesianmanufacturingsector.Ourcurrentresearchdiffersfrom
Temenggunginthreeimportantpoints.Firstly,Temenggungappliestheordinaryleastsquared(OLS)regressionmethodfor
paneldata,whichdoesn’tdistinguishbetweenfixedeffects(FE)andrandomeffects(FE).Secondly,theclassicalproduction
function,employedinTemenggung(2007),assumesthatallfirmsarefullyefficient,sothatthespillovereffectsofFDIreflect
technological progress. In contrast, the current paper employs the stochastic production frontier, which relaxes the
assumptionoffullefficiencyoffirms,sothatbothtechnologicalprogressandefficiencyimprovementareexamined.Thirdly,
wecalculatethescoresoftechnicalefficiencyofeachfirmandestimatesspillovereffectsseparatelyforhigh-efficiencyand
low-efficiencyfirms,providingausefulinsightintothedifferencesintheabilityofhigh-efficiencyandlow-efficiencyfirms
inabsorbingspillovereffectsfromFDI.
Thisstudycontributestotheexistingliteratureinseveralways.Firstly,itexaminesthespilloverhypothesisbyfocusing
ontechnicalefficiency,animportantaspectthatisoftenneglectedinthepreviousstudies.Theadoptionofastochastic
productionfrontierallowstheauthorstoinvestigatetheeffectsofFDIspilloversonfirm-leveltechnicalefficiency.Secondly,
thisstudycoversalongseriesofsurveyedfirms,whichincludesalsotheperiodoftheAsiancrisisonwards.Thirdly,this
study evaluates horizontal, backward, and forward spillovers of FDI. Most importantly, by examining the whole
manufacturing sector,it is possibletoidentifycharacteristics ofindustries that affect thesizeof thetechnology and
efficiencyspilloverstodomesticfirmsfromFDI.Inparticular,wefindevidencethatthesizeofthetechnologygapbetween
foreignanddomesticfirmsiscritical,withlargerefficiencygapsassociatedwithgreaterefficiencyspilloversfromFDI.
Weproceedbyreviewingtheconceptofspillovereffectsinthenextsection.Wethendiscussmethodologyanddata.
EmpiricalresultsarepresentedinSection4andtheconclusionsaregiveninthefinalsection.
2. FDI,spillovereffects,andtechnicalefficiency:theoreticalconceptandempiricalevidence
2.1. FDIandspillovereffects
Foreigndirectinvestmentisbelievedtoprovidehostcountrieswithdirectandindirectbenefits.Thedirectbenefitstake
theformsofnewinvestmentsthatboostnationalincome,increasetaxrevenues,andprovidenewemployment;whereasthe
indirectbenefitsareintheformsofexternalitiesthataregeneratedthroughnon-marketmechanismstorecipienteconomies
anddomesticfirmswithintheeconomies(Hymer,1960).TheseindirectbenefitsarecommonlyknownasFDIspillovers.
TheliteratureidentifiesatleastthreetypesofFDIspillovers.Theseareproductivityspillovers,market-accessspillovers,
and pecuniaryspillovers.Productivityspilloversaredefinedastheexternalities fromFDI thatleadtoincreasesinthe
productivityofdomesticfirms(Aitken&Harrison,1999).Market-accessspilloversexistwhenthepresenceofFDIgenerates
anopportunityfordomesticfirmstoaccessinternationalmarkets(Blomstrom&Kokko,1998).Pecuniaryspillovershappen
iftheexistenceofFDIaffectstheprofitfunctionsofdomesticfirmsthroughareductionincostsoranincreaseinrevenues
(Gorg&Strobl,2005).
OfthethreetypesofFDIspillovers,productivityspillovershavebeenaparticularconcernamongpolicymakersand
researchersinthelasttwodecades.VariousincentiveshavebeenprovidedbypolicymakerstoattractFDIandsubstantial
effortshavebeendevotedbyresearcherstoevaluatetheproductivityadvantage.However,theempiricalevidenceismixed
atbest.Somestudiesfindevidenceofpositiveproductivityspillovers(Caves,1974;Javorcik,2004;Kugler,2006;Schiff&
Wang,2008;Temenggung,2007),butothersdiscovernonexistentorevennegativespillovers(Aitken&Harrison,1999; Blalock&Gertler,2008;Djankov&Hoekman,2000).Thus,therelationshipbetweenFDIspilloversandfirmproductivity
remainsacontroversialissue.
2.2. Spillovereffectsandfirm-specificcharacteristics
Some researchersarguethat themixedevidenceintuitively impliesthat thespillover effects arenotan automatic
consequenceoftheforeignpresenceinaneconomy,rathertheydependsignificantlyonthecharacteristicsoffirmsinthe
industries(Gorg&Greenaway,2004;Lipsey&Sjoholm,2005;Smeets,2008).Oneimportantcharacteristicoffirmsisthe
technologygapbetweenforeignanddomesticfirms.InastudyonUKmanufacturingfirms,Griffith,Redding,andSimpson
(2002)findthatthewiderthetechnologygapthelargertheFDIspillovereffectsthatareobtainedbydomesticfirms.This
findingindicatesabenefitofbeinglessadvancedintermsoftechnology,whichsupportsthetheoreticalargumentinFindlay
(1978).AsimilarresultisdiscoveredalsobyCastellaniandZanfei(2003)forFranceandSpain,andbyPeriandUrban(2006)
forItalyandGermany.
Althoughthereisanadvantageinbeinglessadvanced,thetechnologygapshouldnotbetoowide(Wang&Blomstrom,
1992).Aminimumleveloftechnologyisrequiredfordomesticfirmstoabsorbthenewtechnologyfromforeignfirms.When
thegapistoowide,thelimitedkindabsorptivecapacityofdomesticfirmsmaynotpermitassimilationthenewtechnology
(Glass&Saggi,1998).
2.3. TechnicalefficiencygainsfromFDIspillovers
EarlierstudiesonFDIproductivityspilloversfocusontechnologyadvantages(Gorg&Greenaway,2004).Theknowledge
from foreignfirms is regarded synonymously withtechnological knowledge, as this is consistent with the useof a
conventionalproductionfunction.Managerialandorganizationalknowledgethatmayleadtoefficiencyspilloversarenot
portrayedsincefirmsareassumedtobeproducingatthelong-runequilibriumwithafullefficiencycapacity.Thus,the
productivityspilloversintheseearlystudiesareidenticallymeasuredastechnologyspillovers.
Morerecentstudiesfocusonbothefficiencyandtechnologyadvantages.Inthesestudies,knowledgeisdefinedbroadlyas
product,process,managerial,andorganizationalknowledge.Hence,productivityspilloversleadtobothtechnologyand
efficiencyadvantages.Unfortunately,studiesthatinvestigateefficiencyadvantagesarenotplentiful.InastudyonGreek
manufacturingfirms,DimelisandLauri(2002)examinetheeffectofforeignequitysharesonefficiencyandfindapositive
relationshipbetweenthesetwovariables.Also,GhaliandRezgui(2008)analyzetheTunisianmanufacturingsectorandfind
thathigherforeignshareincreasefirmefficiency.Addressingthesameissuebutemployingadifferentestimationmethod,
ourstudyinvestigatestheefficiencyspilloversinIndonesianmanufacturingfirms.WeextendthestudiesbyDimelisand
Lauri(2002)andGhaliandRezgui(2008)byfocusingonverticalspilloversaswellashorizontalspillovers.
3. Methodology,dataset,andvariables
3.1. Methodology
There are twocommonly used methods in measuringefficienciesand productivityat thefirm level, namelydata
envelopment analysis(DEA) and stochastic frontieranalysis (SFA).1 Eachof thetwo methods hasits advantages and
disadvantages,asexplainedbelow.Thechoicebetweenthesemethodsthusdependsontheobjectiveoftheresearch,the
typeoffirmsinthechosenindustry,andthenatureofthedata(Coelli,Rao,O‘Donnell,&Battese,2005;Olesen,Peterson,&
Lovell,1996).
DEAisalinearprogrammingmethodthatobservesproductionpossibilitiesusingthetechniqueofenvelopmentand
measuresefficiencyasthedistancetothefrontier(Banker,Charnes,&Cooper,1984;Charnes,Cooper,&Rhodes,1978).This
methodhastheprimaryadvantageofbeingofanon-parametricnatureandhastheabilitytohandlemultipleoutputsand
multipleinputs.2However,ithasthedisadvantageofproducingbiasedestimatesinthepresenceofmeasurementerrorand
otherstatisticalnoise,asthismethoddoesnotseparatethestochasticrandomnoisefromtheinefficiencyeffects(Schmidt,
1985).Hence,theestimationresultsunderthismethodtendtobeverysensitivetosmallchangesinthedata.
Alternatively,thestochasticfrontiermethodisaregression-basedmethodthatassumestwoseparateunobservederror
terms,onerepresentsefficiencyandtheotherrepresentsstatisticalnoise(Aigner,Lovell,&Schmidt,1977;Meeusen&van
denBroeck,1977).Ithasachiefadvantageintheabilitytomeasureefficiencyinthepresenceofstatisticalnoise.However,
thismethodisparametricandrequiresaspecificfunctionalformanddistributionalassumptionsfortheerrorterms(Coelli
etal.,2005).
InthisstudythestochasticfrontiermethodisappliedtoanalyzethespillovereffectsfromFDI.Theone-stagestochastic
productionfrontier(SPF)isusedtoestimateaproductionfrontierandatechnicalinefficiencyfunctionsimultaneously.As
pointed out by Kumbhakar,Ghosh, and McGuckin(1991) and Wangand Schmidt (2002),the one-stage approach is
preferable than thetwo-stage approach,as thelatter exhibitsat least twolimitations in estimation that can leadto
potentiallyseverebias.Thefirstlimitationisthattechnicalefficiencymightbecorrelatedwiththeproductioninputs,which
maycauseinconsistentestimatesoftheproductionfrontier.ThesecondlimitationistheOLSmethodinthesecondstageis
inappropriatesincetechnicalefficiencydistributionisassumedtobeone-sided.Consideringtheadvantages,thecurrent
studyadoptstheone-stageapproach,followingBatteseandCoelli(1995).
TheBattese–Coelliproductionfrontiercanbeexpressedasfollows:
yit¼ fðxit;t;
b
Þexpðv
ituitÞ (1)andtheinefficiencyfunctionmaybewrittenas:
uit¼zitdþwit (2)
1
ComprehensivereviewsofthetwomethodsareprovidedbyForsundetal.(1980),Bauer(1990),Bjureketal.(1990),Bravo-UretaandPinheiro(1993),
Greene(1993),Lovell(1993),andCoelli(1995).
2 Thenon-parametricnatureofDEAallowsformeasuringefficiencywithoutimposingaspecificfunctionalformandadistributionalassumptionondata.
Suyantoetal./JournalofAsianEconomics33(2014)16–29
whereyitdenotestheproductionoftheithfirm(i=1,2,...,N)inthetthtimeperiod(t=1,2,...,T),xitdenotesa(1k)vector
ofexplanatoryvariables,
b
representsthe(k1)vectorofparameterstobeestimated,expdenotesexponential,v
itisthetimespecificandstochasticerror,withiidN(0,
s
2v),anduitrepresentstechnicalinefficiency,whichisassumedasafunctionofa
(1j)vectorofobservablenon-stochastic explanatoryvariables,zit,anda(j1)vectorofunknownparameterstobe
estimated,
d
,andwitisanunobservablerandomvariable.TheparametersofEqs.(1)and(2)areestimatedusingthemaximumlikelihoodestimator(MLE)byfollowingthethree
stepsasexplainedinCoelli(1996).Withsimultaneousequationestimation,theMLEestimatesareunbiasedandefficient.
ThevarianceparametersoftheBattese-Coelli’smodelaredefinedas
s
2sBB
s
2v+s
2
uand
g
BBs
2u/s
2s.3g
isanimportantparametertodecidewhetherthereistechnicalinefficiencyornotinthemodel.Iftheestimatedvalueofg
isnotstatisticallysignificant,thereisnotechnicalinefficiencyandtheresultsobtainedfromestimatingEq.(1)byordinaryleastsquares(OLS)wouldbeefficient.Incontrast,iftheestimatedvalueof
g
isstatisticallysignificant,thenthereistechnicalinefficiencyandEqs.(1)and(2)shouldbeestimatedsimultaneously.
ThetechnicalefficiencyoftheithfirmcalculatedfromtheEqs.(1)and(2)istheratioofobservedoutputofthefirmtoits
potentialmaximumoutput,whichcanbewrittenas:
TEit¼
yit
yP
it
¼expðuitÞ (3)
FollowingBatteseandCoelli(1988),thebestestimatoroftheexp(uit)isitsconditionalexpectation,E[exp(uit)],so
technicalefficiencycanbewrittenas:
TEit¼E½expðuitÞ (4)
Ifitisassumedthattheproductionfrontiertakestheformofalog-linearproductionfunctionandtherearefourinput
variables(labour,capital,material,andenergy)intheproductionprocess,theempiricalmodelcanbeexpressedinnatural
logarithmsofvariablesas:
lnYit¼
b
oþb1
lnLitþb2
lnKitþb3
lnMitþb4
lnEitþþb5
Tþb6
lnFDlSectorþv
ituit (5)whereYisoutput,Lislabour,Kiscapital,Mismaterial,Eisenergy,Tisatime-trendvariablethatincreasesbyoneforeach
year,FDI_SectorisameasureofFDIhorizontalspilloversasexplainedinthenextsectionandtheothervariablesareas
previouslydefined.
TheinefficiencyeffectasafunctionofasetofFDIvariables,ayeardummy,anindustrydummy,andafirmdummycanbe
writtenas:
uit¼
d0
þd1
FDIFirmitþd2
FDISectorjtþd3
FDIFirmitFDISectorjtþd4
Yearþd5
Industryþd6
Firmþwit (6)whereFDI_Firmisadummyvariableforforeigndirectinvestmentthattakesavalueofzeroifafirmhasnoforeignownership
shareandtakesavalueofoneifaforeignfirmhasapositiveshare,FDI_Sectorisasdefinedabove,Yearisayeardummy
variable,IndustryisanindustrydummyandFirmisafirmdummy.TheinteractiontermofFDI_FirmFDI_Sectorisincluded
intheinefficiencyequationtoestimatewhetherforeignanddomesticfirmsbenefitequallyfromthepresenceofanew
foreignfirm.Apositive(negative)coefficientontheinteractiontermindicatesless(more)efficiencygainforforeignfirms
thanfordomesticfirms.
Eq.(6)isusedtoestimatetheintra-industryspillovers,whichcapturetheeffectsofforeignpresenceonthetechnical
efficiencyoffirmsinthesameindustry.Theinter-industryspilloversarecommonlyestimatedbyreplacingthe
horizontal-spillovervariable(FDI_Sector)withvertical-spillovervariables.Theinefficiencyfunctionfortheinter-industryspilloverscan
beexpressedas:
uit¼
d0
þd1
FDIFirmitþd2
FDIDownstreamSectorjtþd3
FDIFirmitFDIDownstreamSectorjtþd4
Yearþd5
Industryþ
d6
Firmþwit (7)or
uit¼
d0
þd1
FDIFirmitþd2
FDIUpstreamSectorjtþd3
FDIFirmitFDIUpstreamSectorjtþd4
Yearþd5
Industryþ
d6
Firmþwit (8)whereFDI_Downstream_Sector isaproxyfor spillovereffectsfromforeignfirmstoforeignand domesticsuppliersand
FDI_Upstream_Sectorisaproxyforspillovereffectsfromforeignfirmstoforeignanddomesticbuyers.
3
Thecompletederivationthelog-likelihoodfunctionoftheBattese-CoellimodelanditsrelatedvarianceparametersarediscussedinBatteseandCoelli (1993).
3.2. Dataanddatasetconstruction
Theprimarydataforourstudyaretheannualsurveysofmediumand largemanufacturingestablishments(Survey
TahunanStatistikIndustriorSI)conductedbytheIndonesianCentralBoardofStatistics(BadanPusatStatistikorBPS).These
annualsurveyscoverawiderangeofinformationfromeachsurveyedestablishment.Thebasicinformationincludesyearof
starting production, industrial classification, location, and the specific identification code. There is also information
regardingownership,whichincludesforeignanddomesticownership,andinformationrelatedtoproduction,suchasgross
output, number of workers in production and non-production, value of fixed capital, material usage, and energy
consumption.
Theannualsurveyshavebeenconductedsince1975andthemostrecentavailabledatarelatestotheyear2007.However,
thisstudyusesthedatafrom1988to2000.Theyear1988ischosenasastartingyearsinceitisthefirstyearthatthe
replacementvalueoffixedassets,whichisusedasameasureforcapital,isavailable.Theyear2000isselectedasthelastyear
becausetheBPSchangedthespecificidentificationcodein2001tothenewidentificationcode(KIPN)withoutprovidinga
concordancetabletotheprevioususedidentificationcode(PSID).Effortstomatchtheobservationsintheyears2001–2005
totheyears1988–2000usingoutputvaluesandlabourdonotyieldconsistentresults.Therefore,thelongestpossibleperiod
forthisstudyis1988–2000.
Inconstructingaconsistentdataset,severaladjustmentsareconducted.Theseincludeadjustmentforindustrialcode,
adjustmentforvariabledefinitions,cleaningfornoiseandtypologicalerrors,backcastingmissingvaluesofcapital,matching
firmsforabalancedpanel,andchoosingindustrieswithforeignfirms.Thebalancedpaneldataarepreferableinthisstudy
duetotwoadvantages:(1)itenablestracingthetechnicalefficiencyscoresofeachobservedfirmduringtheperiodofstudy;
(2)itremovestheinfluenceofafirmthatappearsonlyinoneortwoyears,whiletheperiodofestimationisfor13years.The
detailsofadjustmentsarepresentedinAppendix1.Aftertheadjustments,thefinalbalancedpanelofdataconsistsof3318
establishmentswith43,225observations.
Toshowtheinfluenceoftheconstructionofthebalancedpaneldataset,thedescriptivestatisticsoftherelatedvariables
arecalculatedforthebalancedpaneldataandfortheoriginaldatabeforetheadjustmentprocess.Theoriginaldataconsistof
establishmentsthatdonotreportcompleteinformationon output,labour,capital,material,orenergy.Thereforethese
establishmentsarenotincludedinthecalculationofthedescriptivestatisticsfororiginaldata.FollowingTakii(2005),(1)0.5
percentobservationswiththelowestvaluesofoutputand1.5percentobservationswiththehighestvaluesofoutputare
removed.Afterthesedeletions,thedescriptivestatisticsfortheoriginaltotaldata,aspresentedinTable1,consistsof24,188
establishmentsforanunbalancedpanelof238,628observations.
Table1showsthattheminimumvaluesofvariableslnY,lnL,lnK,lnM,lnEfortheoriginaldataarelowerifcomparedtothe
minimumvaluesofthosevariablesfromthebalancedpanel.Thismakessenseasthebalancedpaneldataremovessome
observations duringthe adjustment process. The maximum values of those variables are higher in theoriginal data
comparedtothoseinbalancedpaneldata.Themeanvaluesofthesefivevariablesarehigherinthebalancedpaneldata
comparedtothoseinoriginaldata,whilethestandarddeviationsofthesefivevariablesarelowerinbalancedpanelwhen
comparedtothoseinoriginaldata.
ForFDI_Firm,theminimumvalueiszeroandthemaximumvalueisonebothfororiginaldataandthebalancedpanel
data,becausethisvariableisadummyvariable.Further,theminimumvalueandthemaximumvalueofvariablesFDI_Sector,
Table1
Descriptivestatisticsfortheoriginaldataandthebalancedpaneldata.
Originaldataa
Balancedpaneldata
Min Max Mean SD Min Max Mean SD
ProductionFrontier
lnY 6.461 20.980 12.514 2.256 6.591 20.761 13.964 2.006
lnL 2.398 10.649 4.079 1.327 2.639 10.292 4.702 1.088
lnK 4.105 23.398 12.308 2.268 4.220 23.106 13.152 2.245
lnM 3.871 20.033 11.765 2.418 4.239 19.454 12.164 2.221
lnE 1.791 16.583 9.377 2.221 1.882 15.836 9.587 2.077
FDI_Sector 0 1.492 0.208 0.218 0 1.492 0.234 0.209
InefficiencyFunction
FDI_Firm 0 1 0.064 0.273 0 1 0.072 0.258
FDI_Sector 0 1.492 0.208 0.218 0 1.492 0.234 0.209
FDI_Downstream_Sector 0.002 5.443 0.176 0.212 0.002 5.443 0.176 0.204
FDI_Upstream_Sector 0 0.921 0.160 0.181 0 0.921 0.160 0.174
NumberofEstablishments 24,188 24,188 24,188 24,188 3318 3318 3318 3318 NumberofObservation 231,064 231,064 231,064 231,064 43,225 43,225 43,225 43,225
Source:Authors’calculationsfromtheannualsurveysoftheIndonesianCentralBoardofStatistics(BadanPusatStatistikorBPS).
Y=output,L=labour,K=capital,M=materialandE=energy.
aTheoriginaldatainthistableexclude:(1)theestablishmentsthatdonotreportinformationonoutput,labour,capital,material,orenergy;(2)1.5
percentobservationswiththelowestvaluesofoutputand1.5percentobservationsthehighestvaluesofoutput.
Suyantoetal./JournalofAsianEconomics33(2014)16–29
FDI_Backward,andFDI_Forwardarethesamefororiginaldataandforthebalancedpanel,asthecalculationofthese
inter-industryvariablesisbasedonallfirmsintheoriginaldataasinBlalockandGertler(2008).Themeanvaluesofthesethree
spillovervariablesarehigherinthebalancedpanelcomparedtothoseintheoriginaldata,whereasthestandarddeviations
arelowerinbalancedpanel.FromthedescriptivestatisticsinTable1,theauthorsconcludethatthereisnosubstantialbiasin
theadjustmentprocesssincethereisnosubstantialdifferenceinthemaximumvalue,minimumvalue,meanvalue,and
standarddeviation.
3.3. Measurementofvariables
Therearetwosetsofvariablesincludedinthisstudy:productionvariablesandinefficiencyvariables.Theproduction
variables consistofoutput,labour,capital,material,energy,time trendandFDI_Sector,whiletheinefficiencyvariables
includeFDIvariables(FDI_Firm,FDI_Sector,FDI_Upstream_Sector,andFDI_Downstream_Sector),ayeardummy,anindustry
dummy,andafirmdummy.TheprecisedefinitionofeachvariableisgiveninAppendix2.
Inthisstudy,grossoutputisusedasthemeasureforoutput(y).Itreferstothetotalvalueofoutputproducedbyafirm.
Thenumberofemployeesdirectlyandindirectlyengagedinproductionisusedforthemeasureoflabour(L).Asameasureof
capital(K),thisstudyusesthereplacementvalueofcapital,whilematerial(M)ismeasuredusingthetotalvalueofrawand
intermediatematerialsandenergy(E)ismeasuredasthesumofelectricityandfuelexpenses.
FDI_Firmismeasuredbyadummyofforeigndirectinvestment,whichtakesavalueofoneifafirmhasapositiveforeign
ownershipandtakesavalueofzeroifotherwise.AsameasurefortheFDIhorizontalspillovers,thisstudyusestheshareof
foreignfirmoutputtothetotaloutputatthefive-digitISICsectorallevel,whichisexpressedasinAitkenandHarrison
(1999):
FDISectorjt¼
P
i8i2jFDIFirmityit P
i8i2jyit
(9)
Eq.(9)capturestheeffectofFDIatthesectorallevelonproductivityatthefirmlevel.Itshowsthespillovereffectsof
foreignpresenceondomesticfirmsinthesamefive-digitISICindustry.
TwoalternativemeasuresofFDIspilloversinthisstudyaremeasuresofinter-industryspillovers.Thepresenceofforeign
firmsin certainfive-digit ISICindustriesmay createproductivityexternalities forfirmsin upstreamanddownstream
industries.Thisstudymeasurestheinter-industryspilloversbyusingvariablesthatreflecttheextentofbackwardand
forward linkages between industries. Following Javorcik(2004), themeasure for FDI spillovers fromforeign firmsin
industriesk(k6¼j)thatarebeingsuppliedbydomesticfirmsinindustriesjis:
FDIDownstreamSectorjt¼
X
kifk6¼j
ajk
FDISectorkt (10)where
a
jkistheproportionofsectorj’soutputsuppliedtosectork,whichistakenfromtheinput–output(IO)matrixoffour-digitindustries.4Similarly,themeasureforFDIspilloversfromforeignfirmsinindustriesmwhoseproductsarebought
bydomesticfirmsinindustriesnis:
FDIUpstreamSectormt¼
X
nifn6¼m
g
mnFDISectornt (11)where
g
mnistheproportionofinputspurchasedbyindustrynfromindustrymintotalinputsourcedbyindustryn,whichistakenfromtheinput–output(IO)matrixoffour-digitindustries.
Atime-trendvariableisincorporatedintheproductionfunctiontomeasuretechnicalchange.Thetime-trendvariable
takesavalueofonefortheyear1988,avalueoftwofortheyear1989,andsoon.Anindustrydummycaptureseffectsspecific
toaparticularindustryand hasa valueofoneforanindustry foranobservationofthatindustryand avalueofzero
otherwise.Asimilarprocedureisalsoappliedtothefirmdummyandyeardummyvariables.
4. Empiricalresults
Weestimatea stochasticfrontierestimationandfirsttestforconstantreturnstoscaletocheckwhethertheCobb–
Douglasproductionfrontierisbestsuitedtothedata.FollowingtheprocedureofjointrestrictiontestinBaltagi(2011,p.80),
thetestofconstantreturnstoscaleisconductedunderthenullhypothesisthatthesumoftheestimatedparameters(
b
i)in4Duringtheselectedperiodinthisstudy,therearefouravailableIOmatrixes,whichwerepublishedin1990,1993,1995,and2000.Thisstudyusesthese
fourinput-outputmatrixesforcalculatingthebackwardcoefficientajk.Thefollowingistheprocedureforobtainingvaluesofajk.Valuesofajkbeforeand
including1990aretakenfromthe1990IOmatrix.Valuesofajkfor1991and1992arelinearlyinterpolatedfromthe1990and1993IOmatrixes.Valuesof
ajkfor1993aretakenfromthe1993IOmatrix.Valuesofajkfor1994arecalculatedfromthelinearinterpolationofthe1993and1995IOmatrixes.Valuesof
ajkfor1995aretakenfromthe1995IOmatrix.Valuesofajkfrom1996to1999arelinearlyinterpolatedfromthe1995andthe2000IOmatrixes.Finally,
valuesofajkfor2000aretakenfromthe2000IOmatrix.
productionfrontierinEq.(5)isequaltoone.Theregressionsumofsquaresforunrestrictedmodel(RSSU)is39,631.63,
whereastheregressionsumofsquaredforrestrictedmodel(RSSR)is25,549.50.TheF-statisticsis392.52,suggestingthatthe
nullhypothesisisrejected.ThisresultconfirmsthattheCobb–Douglasproductionfrontierisnotthebestsuitedmodelfor
thestochasticfrontierestimation.Rather,asthesumofthecoefficients oftheinputvariablesis greaterthanone,the
unrestrictedmodelwithvariablereturnstoscaleisappropriateandisusedbelow
4.1. Intra-industryspillovers
Webeginwithestimationofintra-industryspillovers.UsingEqs.(5)and(6),theproductionfrontierandtheinefficiency
functionare estimatedsimultaneouslyfor observing theeffects offoreign investmenton theproduction frontierand
technicalefficiencyoffirms.Fortheinefficiencyfunction,thetechnicalefficiencyvariable(uit)isspecifiedasafunctionofa
foreignsharedummy(FDI_Firm),theshareofforeignfirms’outputsovertotaloutputsinthefour-digitindustry(FDI_Sector),
andaninteractingtermbetweenFDI_FirmandFDI_Sector.Whenforeigninvestmentincreasesthefirm’stechnicalefficiency,
thecoefficientofFDI_Firmisnegative.5Whentechnologyspillsoverfromfirmswithforeigndirectinvestmenttopurely
domesticfirmsinthesameindustry,thecoefficientofFDI_Sectorisnegative.Asfortheinteractionterm,thesignofthe
coefficientshowswhetherornotforeigndirectinvestmentaffectsthefirm’sabilitytobenefitfromspilloversoriginating
fromotherforeign-ownedfirmsinthesameindustry.
Weestimatefouralternativemodelsinordertotesttherobustnessoftheestimatedparameters.Inthefirstmodel,ayear
dummyandanindustrydummyareincludedintheinefficiencyequation.Theestimatedparametersarepresentedinthe
Model(1)columnofTable2.Theresultsfromtheproductionfrontiershowthatthefourinputvariablescontributepositively
andsignificantlytooutput,suggestingapositiveelasticityofeachinputonoutput.Thereisalsoapositiveandstatistically
significantcoefficientof thetime-trendvariableindicating that technicalchangecontributespositivelytooutput.The
positiveandstatisticallysignificantcoefficientofFDI_Sectorsuggestshorizontalspilloversfromintra-industryforeigndirect
investmentincreasetheproductionfrontierforallfirms.
Fromtheestimatesoftheinefficiencyfunction,whichisthemainfocusofthisstudy,thecoefficientofFDI_Firmis
negativeandhighlysignificant,indicatingthatforeigndirectinvestmentdecreasesthefirm’stechnicalinefficiency.This
suggeststhatfirmswithforeignownershipare,onaverage,moreefficientthanpurelydomesticfirms.Thisfindingconfirms
theargumentinCaves(1971)andDunning(1988)thatforeignfirmsaremorelikelytooperateontheproductionfrontier.
Furthermore,thenegativeand statisticallysignificantestimateofFDI_Sectorsuggeststhat knowledgespillsoverfrom
foreign-ownedfirmsincreasesthetechnicalefficiencyofallfirmsintheindustry.Thisresultisinlinewiththeargumentin
WangandBlomstrom(1992)andfindingsinGhaliandRezgui(2008).ThisresultisalsoconsistentwithfindingsinTakii (2005),Temenggung(2007)andBlalockandGertler(2008),whichusedifferentmethodsofanalysis.
Thepositivesignificantestimateofinteractingtermmeansthat,althoughtheforeign-ownedfirmsalsobenefitfromthe
presenceofotherforeigninvestmentintheindustry,thebenefitissmallerthanfordomesticfirms.Giventhattheestimated
coefficientofFDI_FirmandtheestimatedcoefficientofFDI_Sectorarenegativeandstatisticallysignificant,thepositive
coefficient of the interaction term means that uit/FDI_Firm=0.5763+0.0330FDI_Sector and that uit/FDI_Sector=
0.2224+0.0330FDI_Firm.AsbothFDI_FirmandFDI_Sectorareeachalwayslessthanorequaltoonebyconstruction,
theneteffectof FDI_Sectoris negativefor allforeignfirmsaswellasdomestic firms.However,themagnitudeofthe
improvementinefficiencyfromhavingforeignfirmsintheindustryisalwaysgreaterfordomesticfirmsthanforforeign
firms.
Inaddition,weconductjointsignificancetest(F-test)onthemagnitudeofspilloversforforeignestablishmentsinorder
tochecksignificanceofthedirecteffectandtheinteractingeffectofspilloversonforeignfirms.6Thevalueof
F-statisticis
calculatedfromthelog-likelihoodvalueoftheunrestrictedmodelandtheloglikelihoodvalueoftherestrictedmodel(when
boththecoefficientofFDI_SectorandthecoefficientofinteractingvariableFDI_FirmFDI_Sectorequaltozero).Thevalueof
loglikelihoodfortheunrestrictedmodelis7704.48,whereasthevalueofloglikelihoodfortherestrictedmodelis7643.00,
Sothat,theF-statisticis13.22,whichsuggeststhattheunrestrictedmodel(byincludingvariablesFDI_Sectorandinteracting
variableFDI_FirmFDI_Sector)isthecorrectmodelandthetwovariablesarejointlysignificantaffectingspilloverson
foreignestablishmentsat1%level.
Theestimatedcoefficientofyeardummyisnotstatisticallysignificant,suggestingthatonaveragethereisnosignificant
differenceintechnicalinefficiencyscoresoffirmsacrossthesampleyears.Thestatisticallysignificantestimatedcoefficient
ofindustrydummysuggeststhatthereisasignificantdifferenceininefficiencyscoresacrossfive-digitindustries.
Thehighlysignificantestimateofgammaimplicatesthatestimationofstochasticfrontiershouldincludeaninefficiency
effect. This finding provides the justification for the simultaneous estimation of stochastic production frontier and
inefficiencyequation.Inotherwords,themodelisappropriatelyrepresentingtheobservedfirms.
Inthesecondmodel,industrydummiesarereplacedbyfirmdummies,inordertocontrolforfirmheterogeneityacross
thesample.TheresultsaregivenintheModel(2)columnofTable2.Thesignandsignificanceofestimatesaresimilarto
5
Thedependentvariablefortheinefficiencyfunctionistechnicalinefficiency.ThenegativecoefficientofFDI_Firmindicatesthatforeigninvestment decreasesinefficiency,whichimpliesanincreaseinthefirm’sefficiency.
6 Wearegratefultooneofthereviewersforsuggestingthispoint.
Suyantoetal./JournalofAsianEconomics33(2014)16–29
thoseinthefirstmodel.Thenotabledifferenceisonlyinthemagnitudeoftheestimates.FocusingontheFDIvariables,the
magnitudesofcoefficientsaresmallerinthissecondmodelcompared tothose inthefirstmodel. Inotherwords,the
inclusionoffirmdummyandtheexclusionofindustrydummyinthesecondestimation(Model2)resultsinasmallereffect
ofFDIspilloversontechnicalinefficiency.Thisisnotsurprising.Firm-specificeffectsarelargelycapturedbythefirmdummy,
whichremovesapotentialsourceofbiasintheestimatesofothercoefficients.Notably,theresultsregardingthedirectionof
spillovereffectsarethesameasinthefirstmodel,asthecoefficientofFDI_Sectorisnegativeandstatisticallysignificantin
bothmodels.
Forthethirdmodel,onlyatimedummyisincludedasacontrollingvariableintheestimation.Theresultingestimates,
whicharepresentedintheModel(3)column,areverycomparablewiththeresultsinModel(1)andModel(2).Similar
findingsarealsoobservedinModel(4),whenthetimedummy,industrydummyandfirmdummyandareallexcludedfrom
estimation.TheresultsfromthesefourmodelsconfirmtherobustnessoftheestimatesofthepositivespilloversfromFDIon
thetechnicalefficiencyofdomesticfirms.
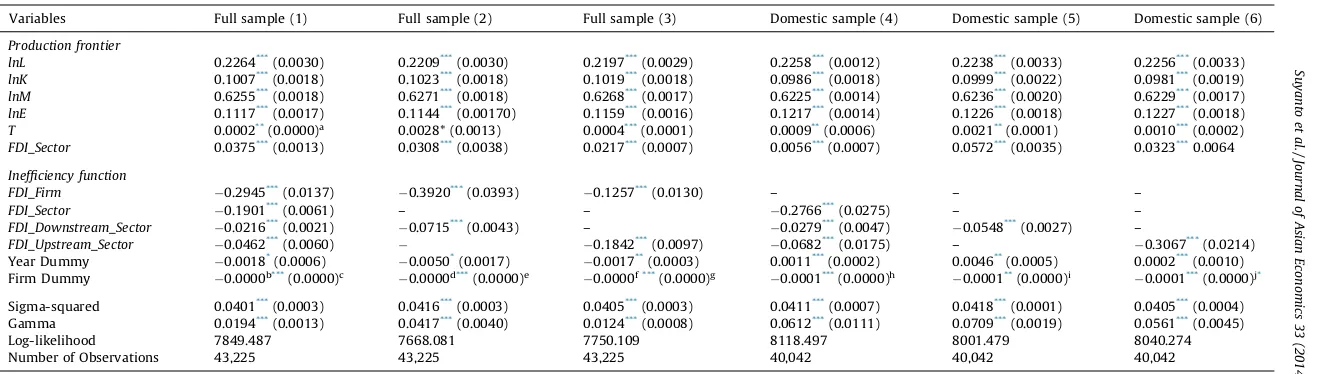
4.2. Inter-industryspillovers
Besidestheeffectsondomesticfirmsinthesameindustry,FDIcanalsogeneratespilloversondomesticfirmsinother
industries.Weestimatesixmodelsoftheinter-industryspillovers,andtheresultsofeachmodelarepresentedinTable3.
Thefirstthreemodelsareestimatedonthefullsampleandthelastthreemodelsareestimatedonthesub-sampleofonly
domesticfirms.Inthethreefull-samplemodels,thefirstmodelistocapturethesimultaneouseffectofthethreespillover
variablesontechnicalinefficiency.ThesecondandthethirdmodelfocusontheindividualeffectofeachoftheverticalFDI
spillovers(i.e.thedownstreamspilloverandtheupstreamspillover).Thesamestructureisalsoappliedtothesub-sampleof
onlydomesticfirms,withModel4capturesthesimultaneouseffectofthethreespillovervariables,Model5capturesthe
downstreameffectonly,andmodel6capturesonlytheupstreameffect.
In thefirstmodel (thefirst resultscolumnof Table3), thethree proxiesofspillover variables areincludedin the
estimations.Theresultsshowthatthehorizontalspillovervariable(FDI_Sector)hasanegativeandstatisticallysignificant
coefficient,suggestingthatanincreaseintheshareofforeignfirmoutputdecreasestechnicalinefficiencyacrossfirmsinthe
industry.Similarly,thespilloversfromFDIindownstreamindustriesalsodecreaseinefficiencyofsuppliers,asdemonstrated
bythenegativeandhighlysignificantcoefficientofthebackwardspillovervariable(FDI_Downstream_Sector).Inaddition,
the coefficientof the forwardspillover variable (FDI_Upstream_Sector) is negativeand highly significant,indicating a
negativerelationshipbetweenFDIinsupplierindustriesandtheindustry’sowntechnicalinefficiency.Althoughweemploy
adifferentmethodologyanduseadifferentdataset,thefindingsaresimilartothoseinLiang(2007).
Inthesecondandthethirdmodels(thesecondandthethirdcolumnsofTable3),theimpactsofbackwardspillover
variableandtheforwardspillovervariableareestimatedseparately.Ineachmodel,themagnitudeofthecoefficientofthe
includedspilloversvariableislargerthaninModel1,butneitherthesignnorthestatisticalsignificanceofthecoefficient
changes.Clearly,thereismulti-colinearityamongthespilloversvariablesthatmakestheidentificationofseparateeffects
Table2
Estimatingintra-industryspillovers.
Variables Model(1) Model(2) Model(3) Model(4)
Productionfrontier
lnL 0.2227***
(0.0033) 0.2256***
(0.0031) 0.2197***
(0.0030) 0.2167***
(0.0031)
lnK 0.1018***(0.0019) 0.1043***(0.0017) 0.1023***(0.0018) 0.1097***(0.0012)
lnM 0.6263***(0.0018) 0.6218***(0.0018) 0.6223***(0.0017) 0.6191***(0.0022)
lnE 0.1128***(0.0017) 0.1160***(0.0017) 0.1165***(0.0017) 0.1176***(0.0016)
T 0.0007*
(0.0005) 0.0039**
(0.0006) 0.0066***
(0.0028) 0.0012***
(0.0003)
FDI_Sector 0.1224***
(0.0055) 0.2044***
(0.0065) 0.2687***
(0.0096) 0.1577***
(0.0065)
Inefficiencyfunction
FDI_Firm 0.5763***
(0.0264) 0.1550***
(0.0018) 0.1960***
(0.0104) 0.2362***
(0.0092)
FDI_Sector 0.2224***
(0.0896) 0.2000***
(0.0149) 0.1780***
(0.0027) 0.1819***
(0.0034)
FDI_FirmFDI_Sector 0.0330***(0.0028) 0.0460***(0.0036) 0.1035**(0.0184) 0.0673***(0.0086)
YearDummy 0.0002(0.0031) 0.0010(0.0009) 0.0010(0.0019) – IndustryDummy 0.0039*
(0.0008) – – –
FirmDummy – 0.0001**
(0.0000)a
– –
Sigma-squared 0.0416***
(0.0010) 0.0416***
(0.0005) 0.0413***
(0.0003) 0.0418***
(0.0003) Gamma 0.0380***
(0.0038) 0.0224***
(0.0083) 0.0086***
(0.0002) 0.0151***
(0.0020) Log-likelihood 7704.484 7759.086 7618.974 7572.755 NumberofObservations 43,225 43,225 43,225 43,225
Source:Authors’calculations.
Notes:Y=output,L=labour,K=capital,M=material,E=energy,T=timetrend.Standarderrorsareinparentheses.
a
Theestimatedstandarderroris0.000009. * Significantatthe10%level.
** Significantatthe5%level. *** Significantatthe1%level.
Table 3
Estimating inter-industry spillovers.
Variables Full sample (1) Full sample (2) Full sample (3) Domestic sample (4) Domestic sample (5) Domestic sample (6)
Production frontier
lnL 0.2264***
(0.0030) 0.2209***
(0.0030) 0.2197***
(0.0029) 0.2258***
(0.0012) 0.2238***
(0.0033) 0.2256***
(0.0033)
lnK 0.1007***
(0.0018) 0.1023***
(0.0018) 0.1019***
(0.0018) 0.0986***
(0.0018) 0.0999***
(0.0022) 0.0981***
(0.0019)
lnM 0.6255***(0.0018) 0.6271***(0.0018) 0.6268***(0.0017) 0.6225***(0.0014) 0.6236***(0.0020) 0.6229***(0.0017)
lnE 0.1117***(0.0017) 0.1144***(0.00170) 0.1159***(0.0016) 0.1217***(0.0014) 0.1226***(0.0018) 0.1227***(0.0018)
T 0.0002**
(0.0000)a
0.0028* (0.0013) 0.0004***
(0.0001) 0.0009**
(0.0006) 0.0021**
(0.0001) 0.0010***
(0.0002)
FDI_Sector 0.0375***
(0.0013) 0.0308***
(0.0038) 0.0217***
(0.0007) 0.0056***
(0.0007) 0.0572***
(0.0035) 0.0323***
0.0064
Inefficiency function
FDI_Firm 0.2945***
(0.0137) 0.3920***
(0.0393) 0.1257***
(0.0130) – – –
FDI_Sector 0.1901***
(0.0061) – – 0.2766***
(0.0275) – –
FDI_Downstream_Sector 0.0216***(0.0021)
0.0715***(0.0043) –
0.0279***(0.0047)
0.0548***(0.0027) –
FDI_Upstream_Sector 0.0462***(0.0060)
0.1842***(0.0097)
0.0682***(0.0175) –
0.3067***(0.0214)
Year Dummy 0.0018*
(0.0006) 0.0050*
(0.0017) 0.0017**
(0.0003) 0.0011***
(0.0002) 0.0046**
(0.0005) 0.0002***
(0.0010) Firm Dummy 0.0000b***
(0.0000)c
0.0000d***
(0.0000)e
0.0000f***
(0.0000)g 0.0001*** (0.0000)h 0.0001** (0.0000)i 0.0001***
(0.0000)j*
Sigma-squared 0.0401***
(0.0003) 0.0416***
(0.0003) 0.0405***
(0.0003) 0.0411***
(0.0007) 0.0418***
(0.0001) 0.0405***
(0.0004) Gamma 0.0194***
(0.0013) 0.0417***
(0.0040) 0.0124***
(0.0008) 0.0612***
(0.0111) 0.0709***
(0.0019) 0.0561***
(0.0045) Log-likelihood 7849.487 7668.081 7750.109 8118.497 8001.479 8040.274 Number of Observations 43,225 43,225 43,225 40,042 40,042 40,042
Source: Authors’ calculations.
Notes:Y= output,L= labour,K= capital,M= material,E= energy,T= Time trend. Actual estimates area
0.00004,b 0.000034,c 0.0000017,d 0.000034,e 0.0000019,f 0.000034,g 0.0000014,h 0.0000024,i 0.000012,j
0.0000035. Standard errors are in parentheses. * Significant at the 10% level.
** Significant at the 5% level. *** Significant at the 1% level.
difficult.ThecoefficientoftheFDI_Downstream_Sectorbeingnegativeandstatisticallysignificantatthe1%levelinboth
Model1andModel2,indicatesarobustfindingthattheforeignentryinathree-digitindustrydecreasesthetechnical
inefficiencyofdomestic suppliers(i.e.positivebackwardspillovers).Similarly, thenegativeandstatisticallysignificant
coefficientoftheFDI_Upstream_SectorinbothModel1andModel3indicatesarobustfindingthatthepresenceofforeign
firmsinathree-digitindustrydecreasestheinefficiencyofdomesticbuyers(i.e.positiveforwardspillovers).
Toisolatethespillovereffectsononlydomesticfirms,weestimatetheModels1through3forthesub-sampleofonly
domesticfirms.TheestimationresultsarepresentedinthefourththroughsixthresultcolumnsinTable3.Theresultsare
similartothoseforthefullsampleoffirmsintermsofthesignsandsignificanceofthecoefficients.However,itisnotable
thatthecoefficientsforthespilloversvariablesinthedomesticfirmsamplearegenerallyoflargermagnitudethanthe
correspondingcoefficientsforthefullsample.ThisprovidesfurtherevidencetosupportthatfromtheresultsinTable2
showingthatspilloversfromforeignfirmsaremorebeneficialforpurelydomesticownedfirmsthanforfirmswithdirect
foreigninvestment.
GiventheresultsfromTable3,weconcludethatthespillovereffectsfromFDIdecreasetechnicalinefficiencyofdomestic
firms inupstreamand downstream industries.Thesefindings confirmtheargumentin Javorcik(2004) thata foreign
presenceinadomesticmarketmaygeneratenotonlyspillovereffectsondomesticfirmsinthesameindustrybutalso
providespilloverbenefitstodomesticfirmsintheupstreamanddownstreamindustries.
4.3. Spillovereffectsandtheleveloftechnicalefficiency
Sofar,theanalysispoolstogetherallfirmswithdifferentlevelsofefficiency.Ithasadvantageofshowingtheaverage
effectofFDIspilloversonafirm’stechnicalefficiency.However,ithasadisadvantageinthatthespillovereffectsareassumed
tobeuniformforallfirms.Thus,theanalysisdoesnotclearlydistinguishwhichfirmsgainthemostspillovereffectfromFDI.
Inthissection,theanalysisisextendedtoansweraquestionofwhetherthelevelofefficiencyinfluencestheabilityof
firmsinabsorbingspilloverbenefits.Thefirmsaredividedintotwogroups:firmswithahigh-efficiencylevelandthosewith
alow-efficiencylevel.Theproceduretogroupthefirmsisbysortingthefirmsfromtheonewiththehighesttechnical
efficiencyleveltothefirmwiththelowestefficiencylevel,andthenthesortedfirmsaredividedintotwo.Theupperhalfof
thedataiscategorizedasthehigh-efficiencyfirmsandthelowerhalfisthelow-efficiencyfirms.Theestimationresultsfor
thesetwogroupsoffirmsarepresentedinTable4.Weestimateresultsforthefullsampleoffirmsaswellasforthe
sub-sampleofonlydomesticfirms.
Startingfromthefullsampleestimations,thecoefficientofFDI_Firmisnegativeandstatisticallysignificantbothamong
high-efficiencyfirms(column1ofTable4)andamonglow-efficiencyfirms(column2),suggestingthatforeign-ownedfirms
have a higher technical efficiencylevel in both groups offirms. The positive and significantcoefficient ofFDI_Sector
demonstratesthatspilloversattheindustriallevelincreasetheinefficiencyofthefirms(i.e.anegativeefficiencyspillover).
Incontrast,thelow-efficiencyfirmsexperienceadecreaseintechnicalinefficiencywhenforeignfirmsaremoreimportantin
theindustry(i.e.apositiveefficiencyspillover),asindicatedbyanegativeandhighlysignificantcoefficientofFDI_Sector
(column2).
Table4
Estimatingintra-industryspilloversinhigh-efficiencyandlow-efficiencyfirms.
Variables Fullsample Domesticsample
High-efficiencyfirms(1) Low-efficiencyfirms(2) High-efficiencyfirms(3) Low-efficiencyfirms(4)
Productionfrontier
lnL 0.2049***(0.0047) 0.2258***(0.0040) 0.2372***(0.0018) 0.2012***(0.0038)
lnK 0.1080***(0.0032) 0.0985***(0.0024) 0.1025***(0.0024) 0.0911***(0.0021)
lnM 0.6038***
(0.0023) 0.6634***
(0.0027) 0.5883***
(0.0036) 0.6900***
(0.0026)
lnE 0.1316***
(0.0027) 0.0835***
(0.0023) 0.1429***
(0.0013) 0.0791***
(0.0018)
T 0.0021**
(0.0009) 0.0001**
(0.0000)b
0.0022***
(0.0004) 0.0064***
(0.0003)
FDI_Sector 0.0940***
(0.0058) 0.0492**
(0.0141) 0.0849***
(0.0032) 0.0727**
(0.0133)
Inefficiencyfunction
FDI_Firm 0.0617***(0.0088)
0.0096*(0.0063) – –
FDI_Sector 0.0742***(0.0062)
0.0556***(0.0035) 0.0657***(0.0038)
0.0660***(0.0115)
YearDummy 0.0020*
(0.0014) 0.0027***
(0.0007) 0.0029***
(0.0004) 0.0015***
(0.0001) FirmDummy 0.0001***
(0.0000)a
0.0001***
(0.0000)c
0.0001***
(0.0000)d
0.0000e**
(0.0000)f
Sigma-squared 0.0425***
(0.0004) 0.0382***
(0.0004) 0.0414***
(0.0005) 0.0341***
(0.0006) Gamma 0.0369***
(0.0043) 0.0151***
(0.0023) 0.0540***
(0.0036) 0.0746***
(0.0019) Log-likelihood 3493.823 4697.164 3597.36 5417.533 NumberofObservations 21,612 21,613 20,021 20,021
Source:Authors’calculations.
Notes:Y=output,L=labour,K=capital,M=material,E=energyandT=timetrendActualestimatesare:a
0.0000042,b
0.000037c
0.000005d
0.0000076,e
0.000018,f
0.0000066.Standarderrorsareinparentheses. * Significantatthe10%level.
** Significantatthe5%level. *** Significantatthe1%level.
ThecoefficientsofFDI_Sectorforthesub-sampleofonlydomesticfirms(columns3and4)areofthesamesignand
significanceasinthecorrespondingfullsampleestimation,butthemagnitudeofimpactissomewhatlowerinthedomestic
firmsub-sample.ThissuggeststhatFDIspillovershavesmallerimpactondomesticfirmsthanonforeignfirmsinindustries
withlargetechnologygaps.
TheresultsinTable4demonstratethatfirmswithdifferentefficiencylevelsmayreceivedifferenteffectsofFDIspillovers.
High-efficiencyfirmstend toobtainnegativespillover effects,while low-efficiencyfirmsexperience positive spillover
effects.Thesefindingsconfirmtheargumentthatthereisadvantagefrombeinglessadvancedintermsofefficiencyinterms
ofbenefittingfromspillovers(Glass&Saggi,1998;Wang&Blomstrom,1992)andareconsistentwiththeresultsinGriffith
etal.(2002),CastellaniandZanfei(2003),andPeriandUrban(2006).
5. Conclusion
ThisarticleempiricallyexaminesthespillovereffectsofFDIonfirmtechnicalefficiencyintheIndonesianmanufacturing
sectorfortheperiodbetween1988and2000.UsingtheframeworkofBatteseandCoelli’s(1995)stochasticproduction
frontier,wefindevidenceofapositivespillovereffectofFDItofirmsinthesameindustry(competitors),firmsinanupstream
industry(suppliers),andfirmsinadownstreamindustry(buyers).Thepositivespillovereffectis observedinboththe
estimationforthefullsampleoffirmsandtheestimationforthesub-sampleofonlydomesticfirms.Notably,theeffectson
domesticfirmsaregenerallymorepowerfulthan