IDX : TLKM NYSE : TLK
Govt. of Indonesia : 52.6%
Public : 47.4%
Excl. Treasury stock : 2,624,142,800 shares.
Investor Relations
PT Telekomunikasi Indonesia Tbk Graha Merah Putih, 5th Floor Jl. Gatot Subroto Kav. 52, Jakarta 12710 Phone : 62 21 5215109 Fax : 62 21 5220500 Email : [email protected] Website : www.telkom.co.id
DISCLAIMER
This document contains financial conditions and result of operation, and may also contain certain projections, plans, strategies, and objectives of the Company, which would be treated as forward looking statements within the meaning of applicable law. Forward looking statements, by their nature, involve risk and uncertainty that could cause actual results and development to differ materially from those expressed or implied in these statements. Telkom Indonesia does not guarantee that any action, which may have been taken in reliance on this document, will bring specific results as expected.
Highlight
nConsolidated revenue grew by 8.1% YoY to Rp89.7 trillion with celullar subsidiary recorded a 10.4% Year on Year (YoY) revenue growth to Rp66.3 trillion.
nData, Internet & IT Services (include SMS) grew by 15.7% as broadband users that consist of fixed broadband, Flash and Blackberry, grew by 45.3% YoY.
nIn December 2014, Telkomsel launched 4G LTE as the first operator to commercially market 4G LTE services in Indonesia.
Financial Highlights
Operating Profit 29,377 27,846 5.5
EBITDA 45,844 41,776 9.7
Mobile Broadband/Flash 31,216 17,271 80.7
BlackBerry 5,835 7,556 (22.8)
2
PT TELEKOMUNIKASI INDONESIA, Tbk.
THE FULL YEAR 2014 RESULTS (AUDITED)
The following analysis and discussion are based on our Indonesian GAAP financial statements for the full year ended December 31, 2013 and 2014. The reports have been submitted to Indonesia Financial
Cellular Voice 34,290 32,138 6.7
Fixed Line Voice 8,881 9,701 (8.5)
Data, Internet & IT Service (incl. SMS) 37,712 32,603 15.7
Interconnection 4,708 4,843 (2.8)
Network 1,280 1,253 2.2
Other Telco Services 2,825 2,429 16.3
Total 89,696 82,967 8.1
Telkom posted total revenue for FY14 of Rp89.7 trillion, an increase of 8.1% YoY. Data, Internet & IT Services recorded the highest growth; with the details as follows:
n Cellular voice revenues increased by 6.7% YoY mainly driven by higher tariffs as a results of relatively
stable competition and favorable pricing strategy. The revenues were also attributable to higher customer base which grew by 6.9%.
n Fixed line voice revenues which consist of Fixed Wireline and Fixed Wireless Voice revenues,
decreased by 8.5% YoY.
o Fixed wireline revenue declined by 4.8% for YoY attributable to diminution of local usage.
o Fixed wireless revenue significantly declined by 42.1% YoY as the impact of fixed wireless
retrenchment plan.
n Data, Internet & IT Services revenues increased by 15.7% YoY mainly contributed by mobile data
business in line with fast growing smartphone (3G capable device) adoption coupled with attractive data plan which resulted in high growth in data usage.
n Interconnection revenues slightly decreased by 2.8% YoY mainly attributable to the declining in voice
and SMS traffic from other local operators in our cellular business.
n Network revenues increased by 2.2% YoY mainly due to higher revenue from our satellite business.
n Other telecommunication services revenues increased by 16.3% YoY mainly due to the increased
3
Expenses
Key Indicators (Rp. Bn)
YoY
FY14 FY13 Growth (%)
Operation, Maintenance & Telecommunication Services 22,288 19,332 15.3
Personnel 9,616 9,733 (1.2)
Interconnection 4,893 4,927 (0.7)
Marketing 3,092 3,044 1.6
General & Administrative 3,963 4,155 (4.6)
Depreciation & Amortization 17,131 15,780 8.6
(Gain)/Loss on Forex – net & Others – net (664) (1,850) 64.1
Total 60,319 55,121 9.4
Total expenses increased by 9.4% YoY with the following details:
n Operation & Maintenance (“O&M”) expenses increased by 15.3% YoY in line with our continuous
network development to strengthen our mobile business performance.
n Personnel expenses decreased by 1.2% YoY mainly attributable to the reduced pension allowance in
accordance with actuarial calculation.
n Interconnection expenses slightlydecreased by 0.7% YoY due to lower outgoing call traffic from fixed
line.
n Marketing expenses only increased by 1.6% YoY as we have strong brand that enable us to spend
marketing expense efficiently.
n General & Administrative expenses decreased by 4.6% YoY due to decrease in provision for doubtful
account.
n Depreciation & Amortization expenses grew by 8.6% YoY in line with our continued network
development.
EBITDA, EBITDA Margin, and Net Income
In 2014, our EBITDA increased by 9.7% YoY to Rp45.8 trillion. EBITDA margin remained superior at 51.1% or increased by 0.7ppt.
Our Net Income grew by 3.0% YoY to Rp14.6 trillion with healthy Net Income margin of 16.3%.
4
Non-controlling Interests 18,318 16,882 8.5
Equity attributable to owners of the company 67,807 60,542 12.0
n An increase in assets by 10.1% YoY was mainly due to the increase in fixed assets, in line with our accelerated network development.
n An increase in liabilities by 8.4% YoY was attributable to higher bank loan facilities.
n An increase in non-controlling interest of 8.5% YoY was due to the increase in our subsidiaries’ net
income.
n An increase in equity of 12.0% YoY was a result of the increase in retained earnings.
Cash Flows
Key Indicators (Rp. Bn)
YoY
FY14 FY13 Growth (%)
Cash Flow provided by Operating Activities 37,736 36,574 3.2
Cash Flow from (used in) received from Investing Activities (24,748) (22,702) 9.0
Cash Flow from (used in) Financing Activities (10,083) (13,327) (24.3)
Net Increase in Cash & Cash Equivalent 2,905 545 433.0
Effect of Foreign Rate Changes 71 1,039 (93.2)
Cash & Cash Equivalents at Beginning of Periods 14,696 13,118 12.0
Cash & Cash Equivalents at End of Periods 17,672 14,696 20.3
n Net cash provided by operating activities increased by 3.2% YoY as a result of increased cash receipt from customers.
n Net cash used in investing activities increased by 9.0% YoY to support our network development.
n Net cash used in financing activities decreased by 24.3% YoY due to lower repayment of bank loan.
5
Our debts consisted of Short and Long-Term Bank Loans, Two-Step Loans (“TSL”), and Bonds and Notes
totaling to Rp18.7 Trillion as of December 2014, where 81.7% of which was in the Rupiah currency, 14%
Net Income Margin 16.3 17.1
Current Ratio 106.2 116.3
Total Liabilities to Equity 80.8 83.5
Return on Assets 10.4 11.1 business (Mobile Broadband and Digital Services) and supported by healthy growth in legacy business. Total revenues, EBITDA and Net Income grew by 10.4%, 10.0% and 11.9% Year on Year (YoY) respectively led to triple double digit growth for 3 consecutive years, driven by strong growth in digital business (33.9% YoY) with mobile broadband grew by 34.2% YoY and digital services grew by 31.5% YoY. As a result, digital business contribution to total revenue significantly increased to 23.6% from 19.4% last year. On the other hand, Telkomsel continued to protect its legacy businesses growth by 6.6% YoY, with voice grew by 7.8% YoY and SMS grew by 3.5% YoY, as a result of advantageous pricing strategy as well as benign competition environment. Despite high SIM card penetration, Telkomsel still recorded growth in subscriber base of 6.9% to 140.6 million, thanks to effective sales and marketing programs. As a result, EBITDA and Net Income margins were sustained at healthy level of 56.2% and 29.3%, respectively.
6
traffic jumped 142.9% to 234,862 TB mainly fueled by high growth in 3G capable device that reached 40.4 million (70.8% YoY) and data user that recorded at 67.9 million (12.1% YoY). By the end of 2014, BTS on-air totaled to 85,420 units (22.3% YoY), 45% of which were 3G BTS, revealing our network superiority. We also always adopt the latest technology to maintain our leadership in the industry. We are the first operator in Indonesia that commercially launched 4G LTE in December 2014.
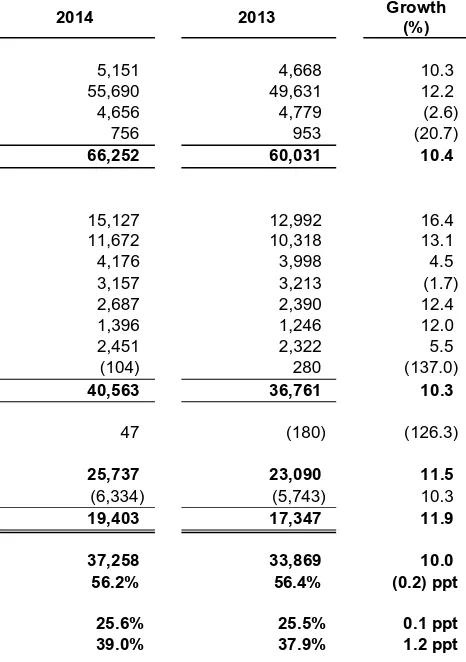
Income Statement
Statement of Income (Rp. Bn) YoY FY14 FY13 Growth %
Revenues 66,252 60,031 10.4
Expenses (incl. Depreciation) 40,563 36,761 10.3
EBITDA 37,258 33,869 10.0
EBITDA Margin (%) 56.2% 56.4% (0.2)ppt
Net Income 19,403 17,347 11.9
Net Income Margin (%) 29.3% 28.9% 0.4ppt
Telkomsel recorded operating revenues of Rp66,252 billion in FY14, an increase of 10.4% YoY.
n Prepaid revenue increased by 12.2% YoY to Rp55,690 billion, fueled by increased prices both for voice
and SMS as a result of favorable pricing strategy coupled with high increase in data usage which resulted in strong growth in data revenue. Revenue from prepaid customers accounted for 84.1% of Telkomsel’s total revenue.
n Postpaid revenue increased by 10.3% YoY to Rp5,151 billion mainly driven by the increase in the
postpaid customer base which grew by 14.5% to 2.9 million subscribers. Revenue from postpaid customers contributed 7.8% of the total revenue.
n Interconnection and international roaming revenues were recorded at Rp4,656 billion (-2.6% YoY)
mainly due to declining SMS traffic from other local operators as an impact of substitute services from instant messaging applications.
In FY14, total expenses including depreciation and amortization increased by by 10.3% YoY to Rp40,563 billion, relatively in line with revenue growth of 10.4%, indicating Telkomsel operational efficiency.
n Operation & maintenance expenses increased by 16.4% YoY to Rp15,127 billion in line with the
Company’s accelerated network deployment to maintain network quality, resulted in higher transmission
and network space rental costs.
n Cost of Services slightly increased by 4.5% YoY to Rp4,176 billion, in line with higher revenue resulted
in increased BHP fee as well as higher usage of modern channel in recharging activities.
n Interconnection charges decreased slightly by 1.7% YoY to Rp3,157 billion, mainly attributable to
declining SMS traffic to other local operators due to the popularity of substitute product instant messaging applications.
n Personnel expenses increased by 12.4% YoY to Rp2,687 billion, in line with the increase in the number
7
n Marketing expenses increased by 5.5% YoY to Rp2,451 billion. Marketing expense grew lower than
revenue growth as we have strong brand products that allow us to spend marketing expense efficiently. The manageable marketing expense was also due to relatively stable competition.
n General & administration expenses increased by 12.0% YoY to Rp1,396 billion mainly driven by higher
building space rental expenses in line with area empowerment and additional Customer Touch Point office.
n Depreciation and amortization expenses increased by 13.1% YoY to Rp11,672 billion, in line with the
Company’s aggressive network deployment and also due to reclassification in tower leases recognition
from operating to financial lease.
n Other expenses declined by 137.1% to Rp104 billion, mainly due to reduced forex losses as a result of relatively stable IDR against USD currency during 2014 compared to 2013. In 2014 and 2013, IDR depreciations against USD were 2% and 26% respectively.
EBITDA increased 10.0% to Rp37,258 billion, while Net Income grew 11.9% to Rp19,403 billion. EBITDA and Net Income margins remained superior at 56% and 29%, respectively.
Financial Position
Statements of Financial Position (Rp Bn) FY14 FY13 Growth %
Current Assets 19,300 16,603 16.2
Non-Current Assets 58,887 56,733 3.8
Total Assets 78,187 73,336 6.6
Current Liabilities 18,106 16,405 10.4
Non-Current Liabilities 8,469 9,109 (7.0)
Equity 51,612 47,821 7.9
Total Liabilities & Stockholders Equity 78,187 73,336 6.6
Total Assets increased by 6.6% Year To Date (YTD) to Rp78,187 billion. Total liabilities increased by 4.2% to Rp26,575 billion and total equity increased by 7.9% to Rp51,612 billion.
n Current assets increased by 16.2% to Rp19,300 billion, mainly due to significant increase in cash and cash equivalent, which grew 77.3% to Rp9,851 billion as a result of strong cash inflow from operational.
n Fixed assets increased by 3.5% to Rp55,021 billion, in line with the additional network equipment deployed during the year.
n Current liabilities increased by 10.4% to Rp18,106 billion mainly due to the increase in short-term loan of Rp1,244 billion.
n Non-current liabilities decreased by 7.0% to Rp8,469 billion, mainly due to lower outstanding medium and long-term loans.
8
Cash Flow
Net cash generated from operations in FY-14 slightly increased to Rp30,863 billion (4.3% YoY). Cash flow used in investment activities was Rp11,052 billion, decreased by 23.5% YoY as compared to Rp14,445 billion last year. Net cash used in financing activities fell by 73.8% YoY to Rp497 billion due to lower outstanding loan in 2014.
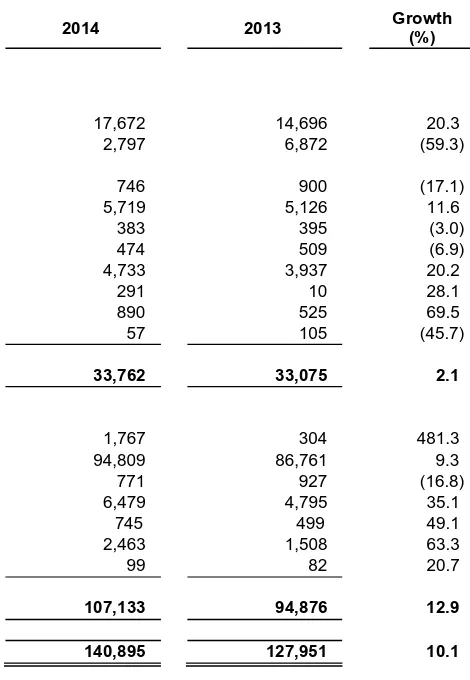
CONSOLIDATED STATEMENT OF CASH FLOWS FOR TWELVE MONTHS ENDED DECEMBER 31, 2014 AND 2013
(In Billions of Rupiah)
FY14 FY13 Growth (%)
Cash Flow from Operating Activities 30,863 29,602 4.3
Cash Flow for Investing Activities (11,052) (14,445) (23.5)
Cash Flow for Financing Activities (497) (1,899) (73.8)
Dividend (15,066) (12,890) 16.9
Net Increase in Cash & Cash Equivalents 4,248 368 1053.8
Effect of Foreign Exchange Rate Changes 48 400 (87.9)
Cash and Cash Equivalents at Beginning of Years 5,555 4,787 16.0
Cash and Cash Equivalents at End of Years 9,851 5,555 77.3
Debt Profile
At the end of December 2014, Telkomsel’s total outstanding loans amounted to Rp2,305 billion, of which
around Rp1,925 billion was short-term loans and current portion of medium-term & long-term loans, and the remaining Rp379 billion was long-term loans. Around 74.7% of the total loans were in the form of foreign currency to cover our capex requirement, amounting to US$138.4 million. At end of 2014, Telkomsel Debt to Equity Ratio (DER) was relatively low at 4.4%.
Telkomsel has to maintain several financial covenants related to its loans/debts. As of 31 December 2014 the covenants were as follows:
Covenants t/b maintained Required Actual
Bank Loans EBITDA to Debt Service ≥ 1.25 13.41
Debt to Tangible Net Worth ≤ 2.00 0.05
RESULTS BY SERVICE
Cellular Services
At the end of December 2014, Telkomsel served 140.6 million subscribers, an increase of 6.9% YoY, with 67.9 million data enabled users, or around 48.3% of total subscribers. As many as 40.4 million used 3G capable device, representing around 28.8% of total subscribers, and grew sharply by 70.8% YoY.
9
Our revenue from SMS grew moderately by 3.5% YoY to Rp13,061 billion. SMS traffic however decreased by 1.2% YoY to 256.4 billion units as an impact of the popularity of instant messaging applications.
The revenue growth in voice and SMS was driven by higher tariffs, as a result of micro-cluster based pricing strategy which allowed us to set prices differently in different micro zones based on various factors including local demand characteristic.
Digital Business segment which includes mobile broadband and digital services revealed strong performance with 33.9% YoY growth to Rp15,614 billion. Revenue from mobile broadband grew by 34.2% YoY to Rp 14,086 billion, while digital services revenue also grew strongly by 31.5% YoY to Rp1,528 billion. The strong growth in digital business was fueled by fast growing 3G capable device adoption which increased by 70.8% YoY to 40.4 million users. Total data traffic sharply increased to 234,862 TB in data payload, or grew by 142.9% YoY. We have 31.2 million Flash users, grew by 80.7% YoY; and 5.8 million Telkomsel’s BlackBerry customers, decreased by 22.8% YoY. The total number of data users, including of
pay-as-you-use, reached 67.9 million or around 48.3% of total subscribers, grew by 12.1% YoY.
Blended ARPU slightly increased to Rp39K from Rp37K last year, or grew by 2.8% YoY. The higher ARPU was partly supported by high growth in data traffic as a result of fast growing 3G capable device which fueled data service revenue. The higher ARPU was also due to combination of advanced pricing strategy through micro-cluster based pricing and sharpened focus on area empowerment and market segmentation.
The following table presents a comparison of our cellular business performance:
Key Indicators Unit YoY
FY14 FY13 Growth (%)
CUSTOMER BASE
Total Customer
Postpaid (kartuHALO) Subs (000) 2,851 2,489 14.5
Prepaid (simPATI + Kartu As) Subs (000) 137,734 129,023 6.8
Total Subs (000) 140,586 131,513 6.9
Net Add
Postpaid (kartuHALO) Subs (000) 362 341 6.3
Prepaid (simPATI + Kartu As) Subs (000) 8,711 6,026 44.6
Total Subs (000) 9,073 6,366 42.5
TRAFFIC
MoU (Total) Bn Minutes 196.5 191.4 2.7
MoU (Chargable) Bn Minutes 161.4 140.3 15.0
SMS (Total) Bn Units 256.4 259.6 (1.2)
SMS (Chargable) Bn Units 132.8 146.3 (9.2)
ARPU
Postpaid (kartuHALO) Rp.'000/month 172 184 (6.8)
Prepaid (simPATI + Kartu As) Rp.'000/month 36 35 3.4
Blended Rp.'000/month 39 37 2.8
NETWORK DATA
BTS Unit 85,420 69,864 22.3
DATA/BROADBAND
Data Enable Users Subs (000) 67,860 60,531 12.1
3G Capable Device Unit (000) 40,420 23,662 70.8
Data Payload TB 234,862 96,683 142.9
EMPLOYEE DATA
Total employees Person 4,880 4,711 3.6
10
Fixed Line Services
n Fixed Broadband
Our fixed broadband users grew by 12.8% YoY to 3.4 million with revenue increased by 7.8% YoY to Rp4,918 billion. We no longer used Speedy brand, and we introduced IndiHome as our new fixed broadband product. IndiHome is a triple-play bundling package consists of telephony, internet and IP TV.
n Fixed Wireline
There are 9.7 million subscribers, a 3.7% increase from last year, with revenue of Rp10,112 billion as compared to Rp10,641 billion last year.
n Fixed Wireless
Consist of 4.4 million subscribers recorded at the end of FY14, decreased by 34.9% YoY with revenue of Rp966 billion. The decline of subscribers was mainly due to management decision to discontinue
n Digital Services - Telkomsel launched M2M (Machine-to-Machine) integrated services, which
provides end-to-end solutions with a flexible control system for solution providers as well as corporate customers. With Telkomsel M2M solutions, it is possible for customers to capitalize on the system by deploying the cloud-based Internet of Things (IoT), purpose-built to enable companies of all sizes to easily launch, manage and monetize their IoT/M2M businesses. Telkomsel set up the M2M Control Center which will offer customers the real time feasibility, mobile service management, support diagnostics, billing and automation necessary to deliver a wide range of innovative value-added services.
n Youth and community - To provide another contact center with better service quality for LOOP
customers (LOOPers), LOOP Station in Jakarta was launched as the second LOOP Station. It still comes with “Youth and Digital” concept and fun, colorful, dynamic and attractive design with lot of
facilities. LOOP station is not only a contact center but also a place that LOOPers can express their hobby and try variety of updated Telkomsel digital services.
n 3G-device adoption - To accelerate smartphone device penetration, Telkomsel Android United
11
ADDITIONAL INFORMATION
Capital Expenditure
For the full year of 2014, Telkom spent Rp24.6 trillion in Capital Expenditure (Capex), of which Rp14.5 trillion was for Telkomsel and the remaining Rp10.1 trillion was for Telkom and other subsidiaries. Telkom’s
Capex was mainly utilized for deploying access and backbone infrastructure to support the broadband services, Telkomsel's Capex was mainly utilized for radio access network, while other subsidiaries’ Capex
was utilized among others for tower and infrastructure development.
Recent Development
n Telkomsel 4th generation Long Term Evolution (4G LTE) - We successfully launched 4th generation
Long Term Evolution (4G LTE) on 8 December 2014, after a series of successful trial from 2010 to 2013 during the APEC Summit in Bali, to become the first operator in Indonesia which commercially market this new technology. Director of Wholesale & International Service, Dian Rachmawan as Director of Consumer Service, Herdy Rosadi Harman as Director of Human Capital Management, and Abdus Somad Arief as Director of Network IT & Solution.
n Flexi Retrenchment –Regarding withFlexi service closure, until December 31, 2014, around 550,000
subscribers were already migrated to Telkomsel under prepaid scheme of Kartu As Flexi.
Awards & Recognition
During 4Q14, we have been awarded by several institutions for our achievements, among others:
n In the event Indonesia Customer Satisfaction Award 2014, Telkom was awarded The Best Brand
Award for the category of The Best Brand Speedy for the 4th times. This award was held by SWA
Magazine and Frontier Consulting Group.
n In the event Asia Pacific Telecom Summit 2014 in Singapore, Telkom and Telstra were awarded the IDC Telecom Service Provider Innovation (TSPI) Award 2014 for Innovative Partnership thru Joint Venture category.
n In the event World Communication Awards (WCA) 2014 in London - United Kingdom, one of Telkom’s program called Indonesia Digital Entrepreneur (“IndiPreneur”) was awarded as The Best
Small Business Service.
12
n Telkom was awarded The Best Sustainable Report 2013 for Infrastructure category in the event Sustainable Report Award that were held by National Center for Sustainability Reporting.
n Marketeers Award 2014 for Telkomsel Flash as Indonesia Most Favorite Netizen Brand 2014 and Telkomsel as Indonesia Most Favorite Youth Brand 2014 from Marketeers Magazine and MarkPlus Insight Research Firm.
n Indonesia Golden Ring Award 2014 for Telkomsel as Operator of the Year & Best Broadband
Service Provider, and Best Operator Product for SimPATI from Forum Wartawan Telekomunikasi Indonesia (Telcomedia Journalist).
n Indonesian Customer Satisfaction Award (ICSA) 2014 for kartuHalo, and The Best in Achieving
Total Customer Satisfaction for simPATI from Frontier Consulting Group and SWA Magazine.
n Indonesia Most Experiential Brand Activation 2014 for Telkomsel with Bintang Asik program as Best
of the Best Contest/Competition Activation from Mix-Marcomm Magazine.
n Indonesia CSR Award 2014 for Telkomsel Mengajar Untuk Indonesia (TMUI) and Integrated Digital
13
Table 1
PERUSAHAAN PERSEROAN (PERSERO)
PT TELEKOMUNIKASI INDONESIA Tbk AND ITS SUBSIDIARIES CONSOLIDATED STATEMENTS OF FINANCIAL POSITION
AS OF DECEMBER 31, 2014
(Figures in tables are presented in billions of Rupiah, unless otherwise stated)
14
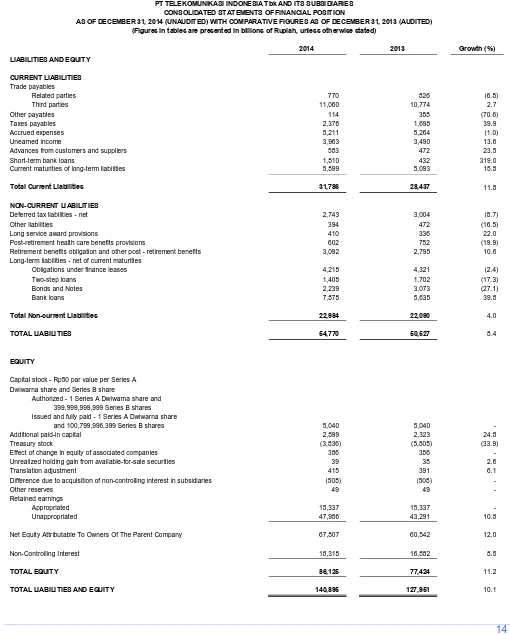
Table 1 (Continued)
PERUSAHAAN PERSEROAN (PERSERO)
PT TELEKOMUNIKASI INDONESIA Tbk AND ITS SUBSIDIARIES CONSOLIDATED STATEMENTS OF FINANCIAL POSITION
AS OF DECEMBER 31, 2014 (UNAUDITED) WITH COMPARATIVE FIGURES AS OF DECEMBER 31, 2013 (AUDITED) (Figures in tables are presented in billions of Rupiah, unless otherwise stated)
Total Current Liabilities 31,786 28,437 11.8
Difference due to acquisition of non-controlling interest in subsidiaries (508) (508) -
15
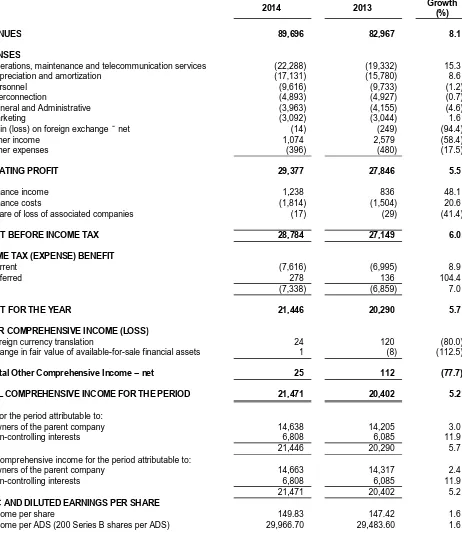
Table 2
PERUSAHAAN PERSEROAN (PERSERO)
PT TELEKOMUNIKASI INDONESIA Tbk AND ITS SUBSIDIARIES CONSOLIDATED STATEMENTS OF COMPREHENSIVE INCOME
FOR THE YEAR ENDED DECEMBER 31, 2014 (UNAUDITED) WITH COMPARATIVE FIGURES FOR 2013 (UNAUDITED) (Figures in tables are presented in billions of Rupiah, unless otherwise stated)
16
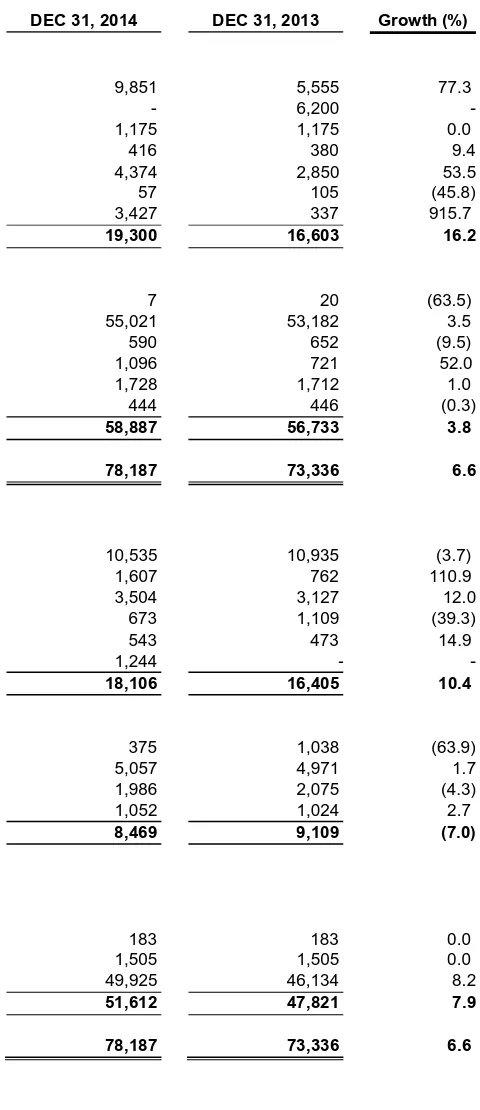
Table 3
PT TELEKOMUNIKASI SELULAR (TELKOMSEL) STATEMENT OF FINANCIAL POSITION
AS OF DECEMBER 31, 2014 (AUDITED) WITH COMPARATIVE FIGURES AS OF DECEMBER 31, 2013 (AUDITED) (figures are presented in billions of Rupiah)
Total Current Assets 19,300 16,603 16.2
NON-CURRENT ASSETS
Total Non-Current Assets 58,887 56,733 3.8
Total Current Liabilities 18,106 16,405 10.4
NON-CURRENT LIABILITIES
Medium-term & long-term loans - net of current maturities 375 1,038 (63.9)
Obligations under finance lease - net of current maturities 5,057 4,971 1.7
Deferred tax liabilities 1,986 2,075 (4.3)
Others 1,052 1,024 2.7
Total Non-current Liabilities 8,469 9,109 (7.0)
EQUITY
17
Table 4
PT TELEKOMUNIKASI SELULAR (TELKOMSEL) STATEMENT OF COMPREHENSIVE INCOME
TWELVE MONTHS ENDED DEC 31, 2014 AND 2013 (AUDITED) (figures in tables are presented in billions of Rupiah, otherwise stated)