N I N E M O N T H S O F 2 0 1 6 R E S U L T S ( U N A U D I T E D )
TICKERS:
IDX : TLKM NYSE : TLK
SHAREHOLDER COMPOSITION:
Government of Indonesia : 52.1% Public : 47.9% Jl. Gatot Subroto Kav. 52, Jakarta 12710 Phone : 62 21 5215109
Fax : 62 21 5220500 Email : [email protected] Website : www.telkom.co.id
DISCLAIMER
This document contains financial conditions and result of operation, and may also contain certain projections, plans, strategies, and objectives of the Company, which would be treated as forward looking statements within the meaning of applicable law. Forward looking statements, by their nature, involve risk and uncertainty that could cause actual results and development to differ materially from those expressed or implied in these statements. Telkom Indonesia does not guarantee that any action, which may have been taken in reliance on this document, will bring specific results as expected.
Highlights
Telkomsel installed 20,808 new BTSs during 9M16 of which around 90% were
3G/4G BTS in line with its focus on digital business.
Financial Highlights
Market Capitalization (Oct 25, 2016):
Rp423.4 Tn (USD32.6 Bn)
Average Daily Trading Volume 2016:
92.7 Mn Shares (IDX) & 217,441 DR (NYSE)
Average Daily Trading Value 2016:
Rp347.5 Bn (IDX) & USD 12.3 Mn (NYSE)
Telkomsel Flash 50,477 37,922 33.1
2
NINE MONTHS OF 2016 (UNAUDITED)
PT TELKOM INDONESIA (PERSERO) Tbk
NINE MONTHS OF 2016 (UNAUDITED)
The following analysis and discussion is based on our Indonesian GAAP financial statements for the nine months ended September 30, 2015 and 2016. The reports have been submitted to Indonesia Financial
Cellular Voice and SMS 40,365 38,606 4.6 Data, Internet & IT Service 32,526 23,701 37.2
Fixed Line Voice 5,708 5,916 (3.5)
Interconnection 3,038 3,393 (10.5)
Network and Other Telco Services 4,551 4,143 9.8
Total 86,188 75,759 13.8
Telkom recorded total revenue of Rp86.2 trillion in 9M16, an increase of 13.8% YoY with Data, Internet & IT Services as the growth driver with the details are as follows:
Cellular Voice and SMS revenues increased by 4.6% YoY as we successfully managed the pressure from over-the-top (OTT) services by innovative product, such as voice and combo packages, as well as cluster-based pricing strategy.
Data, Internet & IT Services revenues grew by 37.2% YoY mainly attributable to strong mobile data business as data payload increased by 84.7% and IndiHome broadband services.
Fixed Line Voice revenues, decreased by 3.5% YoY mainly due to the decline in its traffic.
Interconnection revenues declined by 10.5% YoY in line with lower incoming voice and SMS services due to the widespread use of OTT messaging services.
Network and Other Telecommunication Services revenues grew by 9.8% YoY mainly due to
Operation, Maintenance & Telecommunication Services 23,621 21,419 10.3
Personnel 10,054 9,207 9.2
Interconnection 2,014 2,700 (25.4)
Marketing 2,616 2,170 20.6
General & Administrative 3,505 3,273 7.1 Depreciation & Amortization 13,357 13,504 (1.1) (Gain)/Loss on Forex – net & Others – net 750 (506) 248.2
3
NINE MONTHS OF 2016 (UNAUDITED)
Total Expenses increased by 8.0% YoY, lower than revenue growth, and the Operating Expenses rose by 7.8% YoY with the details are as follows:
Operation & Maintenance (“O&M”) expenses went up by 10.3% YoY in line with our continuous
infrastructure development including IT, in an effort to grow digital business both in cellular and fixed-line services.
Personnel expenses increased by 9.2% YoY partly due to early retirement program (ERP) of Rp562 billion.
Interconnection expenses declined 25.4% YoY mainly attributable to lower outgoing SMS traffic due to popularity of instant-messaging applications.
Marketing expenses increased by 20.6% YoY primarily due to active promotion of 4G LTE and aggressive marketing and sales activities in mobile business on the occasion of festive Ramadhan.
General & Administrative expenses increased by 7.1% YoY in line with increasing business volume.
Depreciation & Amortization expenses decreased slightly by 1.1% YoY as last year there was significant amount of fixed wireless assets depreciation.
(Gain)/Loss on Forex–net & Others–net increased by 248.2% YoY. We experienced losses on foreign exchange of Rp216 billion due to currency fluctuation. Other expenses were mainly penalty for early Flexi tower termination and tax charges.
EBITDA, EBITDA Margin, and Net Income
In 9M16, EBITDA strongly grew by 20.0% YoY to Rp44.4 trillion with EBITDA margin improved to 51.5% from 48.8% last year. While our Net Income increased by 27.6% YoY to Rp14.7 trillion with healthy Net Income margin of 17.1%, improved from 15.2% in 9M15.
Financial Position
Key Indicators (Rp.Bn)
YTD
9M16 FY15 Growth (%)
Assets 177,462 166,173 6.8
Liabilities 75,111 72,745 3.3
Non-controlling Interests 18,732 18,292 2.4 Equity attributable to owners of the company 83,619 75,136 11.3
Total assets as of September 2016 reached Rp177.5 trillion, increased 6.8% YTD as compared to
December 2015 mainly due to increase in fixed assets and account receivables.
Total liabilities at end of September 2016 increased 3.3% to Rp75.1 trillion mainly attributed to higher
accrued expenses.
Non-controlling interest increased by 2.4% YTD due to increase in our subsidiaries’ performance.
Our equity increased by 11.3% due to higher retained earnings as a result of strong performance during
4
NINE MONTHS OF 2016 (UNAUDITED)
Cash Flows
Key Indicators (Rp. Bn) YoY
9M16 9M15 Growth (%)
Cash Flow from Operating Activities 39,029 31,310 24.7 Cash Flow used in Investing Activities (22,690) (19,218) 18.1 Cash Flow used in Financing Activities (15,312) (4,527) 238.2 Net (Decrease)/Increase in Cash & Cash Equivalents 1,027 7,565 (86.4) Effect of Exchange Rate Changes on Cash & Cash Equivalents (292) 1,027 (128.4) Cash & Cash Equivalents at Beginning of Year 28,117 17,672 59.1 Cash & Cash Equivalents at End of Period 28,852 26,264 9.9
Net cash provided by operating activities increased by 24.7% YoY as a result of strong cash inflow from
operations.
Net cash used in investing activities increased by 18.1% YoY in line with acquisition of fixed assets in
an effort to grow our digital business in cellular and fixed services.
Net cash used in financing activities increased by 238.2% YoY as we raised significantly higher amount
of loan last year.
Debts
Currencies (Rp.Bn)
YTD Portion (%)
9M16 FY15 Growth (%) 9M16 FY15
IDR/Rupiah 26,344 26,476 (0.5) 93.0 88.2 USD/US Dollar 1,142 2,764 (58.7) 4.0 9.2 JPY/Japanese Yen 843 792 6.4 3.0 2.6
Total 28,329 30,032 (5.7) 100.0 100.0
At the end of September 2016, total debts amounting to Rp28.3trillion, decreased by 5.7% compared to end of 2015. Around 93% of our debt is in Rupiah currency, 4% is in US Dollar currency and the balance is
in Japanese Yen, consisting of short and long-term Bank Loans, Bonds and Two-Step Loans (“TSL”). Our
5
NINE MONTHS OF 2016 (UNAUDITED)
Financial Ratios
Ratios (%)
YoY
9M16 9M15 Growth (ppt)
EBIT Margin 35.1 31.7 3.4
EBITDA Margin 51.5 48.8 2.7
Net Income Margin 17.1 15.2 1.9
Current Ratio 128.4 135.3 (6.9)
Total Liabilities to Equity 89.8 96.8 (7.0) Return on Assets 11.1 9.3 1.8
Return on Equity 23.5 20.5 3.0
Return on Invested Capital 17.5 14.6 2.9
Gearing
Key Indicators
YTD
9M16 FY15 Growth (ppt)
Net Debt to Equity (%) (0.6) 2.5 (3.1)
Debt to Equity (%) 33.9 40.0 (6.1)
Debt to EBITDA (%) 47.9 58.4 (10.5)
Debt Service Ratio (Times) 8.6 8.2 0.4
Capital Expenditure
For the nine months of 2016, Telkom Group spent Rp19.9 trillion in Capital Expenditure (Capex). Telkom’s
Capex was mainly utilized to develop access and backbone infrastructure to support fixed as well as mobile broadband businesses, while Telkomsel's Capex was mainly utilized for radio access network (BTS)
development. Some portion of capex was also utilized for other subsidiaries’ projects among others are
submarine cable systems (SEA - ME - WE5 and SEA-US), tower, data center, and property.
Telkomsel Financial Result
Telkomsel continued to maintain its strong performance for the Nine Months of 2016 and again delivered another triple double-digit growth in Revenues, EBITDA and Net Income, which grew by 14.4%, 18.9% and 27.3% YoY respectively. Revenues grew to Rp63,649 billion with Digital Business continued to be the growth engine and posted 40.8% YoY growth, driven by Data which increased by 40.8% YoY and Digital Services which increased by 40.4% YoY. Digital Business accounted for 34.8% of total revenues, increased significantly from 28.3% a year ago. We were able to sustain our Legacy business despite Over The Top (OTT) cannibalization in SMS, which grew by 4.0% YoY (Voice +9.8% and SMS -1.5% YoY) due to successful execution of cluster-based pricing, market segmentation and superior network. EBITDA and Net Income margins were higher by 2.2ppt and 3.3ppt to 58.3% and 33.0%, respectively.
6
NINE MONTHS OF 2016 (UNAUDITED)
network supply, we deployed 20,808 new BTS during nine months of 2016 of which 90.2% were 3G/4G BTS in line with our focus on Digital Business. Our data traffic increased by 84.7% to 631,269 TB mainly fueled by high growth in 3G/4G capable device that reached 76.4 million (+37.3% YoY), or 46.7% of our customer base. In terms of infrastructure, by end of September 2016 our BTS on-air totaled 124,097 units (+23.6% YoY), 59.4% of which were 3G/4G BTS.
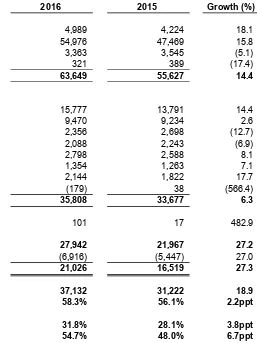
Statements of Profit and Loss
Financial Performance (Rp. Bn)
YoY QoQ
9M16 9M15 Growth (%) 3Q16 2Q16 Growth (%)
Revenues 63,649 55,627 14.4 22,544 20,910 7.8 Legacy 41,478 39,880 4.0 14,605 13,548 7.8 Digital Business 22,172 15,747 40.8 7,939 7,361 7.8 Expenses incl. Depreciation & others 35,808 33,677 6.3 12,404 11,729 5.8 EBITDA 37,132 31,222 18.9 13,292 12,167 9.2 EBITDA Margin (%) 58.3 56.1 2.2ppt 59.0 58.2 0.8ppt Net Income 21,026 16,519 27.3 7,614 6,873 10.8 Net Income Margin (%) 33.0 29.7 3.3ppt 33.8 32.9 0.9ppt Proportion of Digital Business (%) 34.8 28.3 6.5ppt 35.2 35.2 0.0ppt
Telkomsel recorded operating revenues of Rp63,649 billion for 9M16, an increase of 14.4% YoY.
Prepaid revenue increased by 15.8% YoY to Rp54,976 billion, mainly driven by ARPU growth supported
by the growth in data and legacy voice as well as growth in prepaid subscriber base which grew by 9.9% YoY to 159.7 million subscribers. Revenue from prepaid customers accounted for 86.4% of Telkomsel’s total revenue.
Postpaid revenue increased by 18.1% YoY to Rp4,989 billion mainly driven by the increase in the
postpaid customer base which grew by 24.8% YoY to 4.0 million subscribers. Revenue from postpaid customers contributed 7.8% to total revenue.
Interconnection and International Roaming revenues decreased by 5.1% YoY to Rp3,363 billion, which
was expected due to the decline in SMS traffic from other local operators as we started to see cannibalization from OTT services.
In 9M16, total expenses including depreciation and amortization increased by 6.3% YoY to Rp35,808 billion, lower than revenue growth of 14.4%, indicating Telkomsel operational efficiency.
Operation & Maintenance expenses increased by 14.4% YoY to Rp15,777 billion in line with the
Company’s accelerated network deployment to maintain network quality, resulted in higher transmission
and network space rental costs.
Cost of Services decreased by 12.7% YoY to Rp2,356 billion with cost savings mainly from BlackBerry
access fee.
Interconnection & International Roaming charges decreased by 6.9% YoY to Rp2,088 billion, mainly
7
NINE MONTHS OF 2016 (UNAUDITED)
settlement.
Personnel expenses increased by 8.1% YoY to Rp2,798 billion, in line with increase in the number of
employees and increase in salaries and benefits. There was also ERP of Rp156 billion in 3Q16.
Marketing expenses increased by 17.7% YoY to Rp2,144 billion primarily due to promotion of our 4G
LTE program across the country and other aggressive marketing and sales activities in line with the company’s strategy to support festive Ramadhan and Lebaran season.
General & Administration expenses increased by 7.1% YoY to Rp1,354 billion mainly attributable to
higher training and development program as well as professional fees.
Depreciation and Amortization expenses increased by 2.6 % YoY to Rp9,470 billion.
EBITDA and Net Income posted double digit growth with an increase of 18.9% YoY to Rp37,132 billion and 27.3% YoY to Rp21,026 billion, respectively, while EBITDA and Net Income margins were higher at 58% and 33%, respectively.
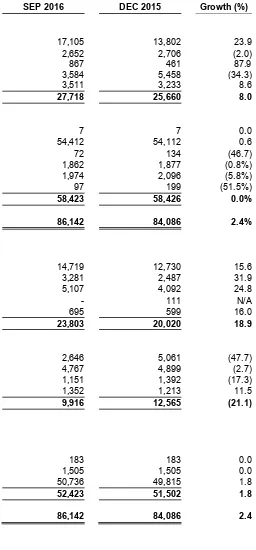
Statements of Financial Position
Statements of Financial Position (Rp Bn) Sep-16 Dec-15 Growth (%)
Current Assets 27,718 25,660 8.0
Non-Current Assets 58,423 58,426 0.0
Total Assets 86,142 84,086 2.4
Current Liabilities 23,803 20,020 18.9
Non-Current Liabilities 9,916 12,565 (21.1)
Equity 52,423 51,502 1.8
Total Liabilities & Stockholders’ Equity 86,142 84,086 2.4
As of 30 September 2016, Total Assets increased 2.4% to Rp86,142 billion, total liabilities increased 3.5% to Rp33,719 billion and total equity increased 1.8% to Rp52,423 billion.
Current Assets increased 8.0% to Rp27,718 billion, mainly due to increase in cash and cash
equivalents.
Non-current Assets remain relatively stable at Rp58,423 billion.
Current Liabilities increased 18.9% to Rp23,803 billion mainly due to the increase in accrued liabilities
and unearned revenue.
Non-current Liabilities decreased 21.1% to Rp9,916 billion, mainly due to lower outstanding
medium-term loans
Total Equity increased by 1.8% to Rp52,423 billion due to additional retained earnings as a result of the
higher net income in this period.
Cash Flow
8
NINE MONTHS OF 2016 (UNAUDITED)
Statements of Cash Flows
For Nine Months Ended September 30, 2016 and 2015
Statements of Cash Flows (Rp Bn) 9M16 9M15 Growth (%)
Cash Flow from Operating Activities 35,215 28,548 23.4 Cash Flow for Investing Activities (9,604) (9,643) (0.4) Cash Flow from (for) Financing Activities (2,908) 2,572 (213.0) Dividend Payment (19,401) (16,852) 15.1 Net Increase in Cash & Cash Equivalents 3,303 4,625 (28.6) Cash and Cash Equivalents at Beginning of Years 13,802 9,851 40.1 Cash and Cash Equivalents at End of Years 17,105 14,477 18.2
Debt Profile
As of 30 September 2016, Telkomsel’s total outstanding loans amounted to Rp2,650 billion which will
mature in 2018. Around 24.5% (USD50.0 million) of the total loans were denominated in US Dollar mostly to cover our capex payment requirement. As of 30 September 2016, Telkomsel Debt to Equity Ratio (DER) was 15.5%.
Telkomsel has to maintain several financial covenants related to its loans/debts. As of 30 September 2016 the covenants were as follows:
Covenants to be Maintained Required Actual
EBITDA to Debt Service ≥1.25 12.27
Debt to Tangible Net Worth ≤2.00 0.05
RESULTS BY SERVICE
Celullar Services
As of 30 September 2016, Telkomsel served 163.7 million subscribers nationwide, an increase of 10.2% YoY. Out of the total base, 46.7% or 76.4 million were using 3G/4G capable device which has been growing strongly by 37.3% YoY.
Voice and SMS
We were able to sustain healthy revenue growth from voice, which increased by 9.8% YoY to Rp29,306 billion. The healthy growth in voice revenue mainly attributable to higher voice traffic (MoU) which increased by 9.0% YoY to 176.3 billion minutes. The higher traffic is mainly due to improvement in network quality, high proportion of base still using 2G handset devices, aggressive promotion to migrate from Pay As You Use (PAYU) to voice packages as well as growth in our customer base.
9
NINE MONTHS OF 2016 (UNAUDITED)
Digital Business
Digital business remained our engine of growth with our focus continue to be in leading network supply in 3G and 4G infrastructure. This segment recorded strong performance with 40.8% YoY growth to Rp22,172 billion and increased its contribution to total revenue substantially to 34.8% from 28.3% last year.
Revenue from Data grew by 40.8% YoY to Rp20,075 billion, driven by healthy growth in 3G/4G capable device adoption (+37.3% YoY to 76.4 million users), successful migration of PAYU to Flash packages, as well as continued strong growth in data payload, which increased by 84.7% YoY to 631,269 TB. As of 30 September 2016, 11.9 million of our customers that have LTE devices have swapped to USIM to utilize 4G services.
Digital Services also grew strongly by 40.4% YoY to Rp2,096 billion. Key products and services within this segment included Digital Lifestyle (music, games, video contents, etc.), Digital Advertising, Digital Payment (mobile banking, T-Cash, T-Wallet) and M2M Business (T-Drive, T-Bike etc).
Our focus on Digital Business was reflected from our network deployment. We continued to accelerate our network development with aggressive 3G/4G BTS deployment to support Digital Business as data traffic jumped 84.7% YoY. During 9M16, Telkomsel built 20,808 new BTS, an increase of 39.1% YoY. Our 4G LTE deployment is on-demand basis, take into account 4G handset penetration and level of demand in Broadband cities. We have deployed 5,015 4G BTS to date. The network roll out brought total BTS on air to 124,097 units at end of September 2016, or increased by 23.6% YoY, of which 73,666 units were 3G/4G BTS (+41.0% YoY).
10
NINE MONTHS OF 2016 (UNAUDITED)
The following table presents a comparison of our cellular business performance:
Key Indicators Unit flagship product. As of September 2016, total IndiHome subscribers reached 1.524 million.
To improve IndiHome ARPU level, starting 3Q16 Telkom deliberately selects higher quality customers to retain and grow. After performing a comprehensive review, we discouraged less productive customers by reducing or stopping promotional prices for some, and promotional contents for others, so we expect to have more profitable and loyal customers. After certain periods of time, those low quality customers will no longer be included into IndiHome customer database. Coupled with subscribers' churn, it resulted in limited customers growth for IndiHome in the third quarter. ARPU for 3Q16 was Rp313 thousand.
Enterprise and Wholesale Services
Telkom also delivers fixed line services to enterprise and wholesale business segments. Enterprise division provides access and connectivity as well as managed solution for 1,339 corporate customers, 190,850 SME customers and 636 government institutions. In terms of enterprise broadband service, our internal research estimated that Telkom has around 64% of traffic market share in the enterprise market with 2,349Gbps total bandwidth in service, part of which is in the form of integrated IT solution.
11
NINE MONTHS OF 2016 (UNAUDITED)
Telkom has the widest network coverage supported by almost 84,000 km fiber-based backbone as of September 2016.
Data Center
We have more than 75,000 sqm facility space of data center. Currently, we are in the process of finalizing the Jurong data center of 20,000 sqm that will commence operation in November 2016.
Smart Government Initiative
Telkom Group supports smart government initiative especially local government: cities and counties, in the efforts to modernize the city management by implementation of IT-based public services system. Telkom provides broadband infrastructure and cloud-based solution to help government improve their services to public. Telkom has already implemented smart city system in 211 cities including Surabaya, Bandung and Bogor.
Backbone Networks
Nationwide backbone network has always been our group’s competitive advantage. We continuously
expand our terrestrial and submarine backbone to support both our mobile and fixed business branch. During 9M16 we deployed 1,985 km fiber-based backbone to make total length of Telkom backbone reach 83,878 km by September 2016.
To support international connectivity, currently we are developing two major submarine cable systems
namely SEA-ME-WE-5 (South East Asia – Middle East – Western Europe 5) and SEA-US (South East
Asia–United States) in consortium with international telco operators.
The SEA-ME-WE-5 cable system is developed by a consortium of 22 operators and spans 17,800 km from Marseille, France to Dumai, Indonesia, with expected completion of Q4 2016. While the SEA-US cable system is developed by a consortium of 7 operators, stretches 14,400 km long connecting North Sulawesi in Indonesia to California, USA across the Pacific Ocean, and is scheduled for operation around Q3 of 2017. As of September 2016 SEA-ME-WE-5 progress was around 94% and SEA-US was 66%.
To connect SEA-ME-WE-5 and SEA-US, we are in the progress of deploying IGG (Indonesia Global Gateway) to connect with our domestic network. The completion of SEA-ME-WE-5, SEA-US, and IGG will make an unparalleled network infrastructure.
Through those and some other projects we hope to expand 48,800 km more backbone cable system during 2016-2018. This expansion will significantly increase our network capacity and quality and help enhance our presence among international operators.
Satellites
We are in the preparation of launching Telkom-3S and Telkom-4 satellites. Telkom-3S Satellite is assigned to replace Telkom-2 Satellite. We expect Telkom-3S to be launched in quarter-1 2017. It will carry in total 42 active transponders, consist of 24 Standard C-band transponders, 8 Extended C-band transponders and 10 Ku-band transponders. As of September 2016 the progress of this project was around 80%.
12
NINE MONTHS OF 2016 (UNAUDITED)
Recent Development
Change in Board of Directors –As of September 9, 2016, Telkom’s Director of Enterprise & Business Service, Mr. Muhammad Awaluddin, was appointed as President Director of PT Angkasa Pura II (Persero). In accordance, Telkom has assigned Mr. Honesti Basyir as the Acting Director of Enterprise & Business Service in addition to his current position as Director of Wholesale & International Service.
Application Service License for Telin Myanmar - Telin Myanmar, established in August 2013 as one of our international footprints, has been awarded Application Service license from Myanmar telecommunication authority. With this license it can deliver internet service, provide private line voice and/or data services as well as value added services. Previously, Telin Myanmar has also won the IP
transit service license in 2013 and currently serves Myanmar’s state owned enterprise MPT, which
operates the country's postal and telecommunication system.
blanja.com synergy with State-owned Enterprises - Blanja.com, Telkom's e-commerce platform developed in partnership with eBay, has embraced around 4,000 small and medium enterprises (SME).
These SMEs are part of fellow State Owned Enterprises’ CSR partners with more than 2,600 product
variety to choose from. In addition to digital trading platform, blanja.com also provided these SMEs with
continuous twinning efforts to increase their product’s quality and digital literacy. Blanja.com also
provides space for SOEs to sell their products online. As of August 2016, blanja.com reached more than 7,300 sellers participating in its web site.
Product and Marketing Activities
Fixed Line & Enterprise
Hybrid Box (IPTV & OTT) is a set top box that delivers interactive TV program, video streaming of favourite movies and other value added Over The Top (OTT) services. Using hybrid box, customers will be able to browse and stream video such as Youtube on TV including to watch OTT content from partners such as CATCHPLAY, VIU and iflix.
Interactive TV channel enrichment. New TV channels are added to the interactive TV services of IndiHome, such as Galaxy, Dreamworks, RED, Pelangi, Galaxy, Zee Hiburan, Baby First, Hi Indo, Prambors and many others. New interactive TV minipacks are also available. These channels enrich the content options for customers, following previous favourite channels, e.g. BeIN Sports that present Premier League big matches special for IndiHome customer.
Movin’ is a triple play on the move is an Android-based Mobile Apps designed specifically for
IndiHome customers, where they can enjoy TV shows, calls and internet access both inside and outside the home using smartphone but the will be counted into home phone usage. Using Movin', customers can watch their favorite shows and movies directly, surf the vast network connection and can receive home phone anytime and anywhere through smartphone.
13
NINE MONTHS OF 2016 (UNAUDITED)
New Zapa Application is a mobile-based customer relationship management services designed for SMEs in Indonesia to facilitate SMEs in finding Telkom’s product information, billing information, order
process tracking, or nearest SME partners through the “Near Me” feature.
Mobile
simPATI GIGAMAX was launched in July 2016 as simPATI Entertainment Package with higher internet
quota and entertainment service consisting of regular quota, 4G quota and content quota (HOOQ & VIU video streaming access for 30 days) priced starting from Rp49,000 (2.1 GB) to Rp299,000 (50 GB). The package also comes with bonus on voice & SMS (on-network) for 7 days worth at price of the package.
“Tukar Kartu 4G” program was introduced to facilitate customer in getting 4G upgrade card through
online delivery mechanism with 10 GB bonus quota. The bonus quota is valid for prepaid customer with 4G SIM Card and 4G handset connected to Telkomsel 4G network for 30 days. Customers can also have 4G upgrade at various points of migration such as Grapari, My Grapari, Samsung Experience Stores, Telkomsel Distribution Center and selected device outlets.
Telkomsel – OPPO Collaboration Program was launched to encourage mass adoption of 4G smartphone device and 4G network utilization with 4G data user, consisting of OPPO F1s smartphone device bundled with TAU (Telkomsel Android United) 4G data package of 14 GB (2 GB for all network & 12 GB for 4G network only) priced at Rp3,799,000. Customers can get the package at various Telkomsel’s channels such as Grapari, OPPO stores and online channel.
ADDITIONAL INFORMATION
Awards & Recognition
During 3Q16, we have been awarded by several institutions for our achievements, among others:
Vision Awards Annual Report Competition 2016 for Telkom as First Place in Regional Top 80 Rank in
Asia-Pacific, Sixth Place in Worldwide Top 100 Rank, and Platinum Award for Technology-IT Services
Industry from League of American Communications Professionals (LACP).
Indonesia's Top 100 Most Valuable Brands 2016 Award for Telkom as the first place from Brand
Finance in cooperation with SWA Magazine.
Forbes Global 2000 Awards for Telkom from Forbes Magazine.
Alpha Southeast Asia Award for Telkom as Most Organized Investor Relations, Most Consistent
Dividend Policy, Best Annual Report in Indonesia, and Strongest Adherence to Corporate Governance from Alpha Southeast Asia.
AON Best Employer 2016 for Telkom as BestEmployer dan Best of The Best Employers from AON.
Indonesian Human Capital Study (IHCS) Awards 2016 for Telkom as Best Employee Net Promoter
Score, Best Career Management Initiatives, Best Talent Management Initiative, Best Employee Self Service Initiatives, Best of CEO Commitment of Human Capital Development, and Best of All Human Capital Criteria (Best of the Best) from IHCS.
Indonesia Best Brand Award 2016 for IndiHome as The Best Brand from SWA, Metro TV, and MARS
14
NINE MONTHS OF 2016 (UNAUDITED)
Indonesia Best CFO 2016 for CFO Telkomsel as The 3rd Winner of Indonesia Best Chief Financial
Officer 2016 from SWA Magazine.
7th Asia Best Employer Brand Awards 2016 for Telkomsel as Asia’s Best Employer Brand from
Employer Branding Institute.
World Branding Awards 2016 for Telkomsel as Best Corporate Brand in Telecommunications-Mobile
Category from World Branding Forum.
Indonesia Best Brand Award 2016 for simPATI with Best Brand Platinum in GSM SIM Card Category
from SWA Magazine & Mars Research Specialist.
Indonesia’s Best Corporate Social Initiatives (IBCSI) 2016 for NextDev program (Corporate Social
15
NINE MONTHS OF 2016 (UNAUDITED)
Table 1
PERUSAHAAN PERSEROAN (PERSERO)
PT. TELEKOMUNIKASI INDONESIA Tbk AND ITS SUBSIDIARIES CONSOLIDATED STATEMENT OF FINANCIAL POSITION As of September 30, 2016 (unaudited) and December 31, 2015 (audited) (Figures in tables are expressed in billions of Rupiah, unless otherwise stated)
2016 2015 Growth (%)
ASSETS
CURRENT ASSETS
Cash and cash equivalents 28,852 28,117 2.6
Other current financial assets 3,429 2,818 21.7
Trade receivables and others receivables 10,790 7,872 37.1
Inventories – net of provision for obsolescence 867 528 64.2
Advances and prepaid expenses 5,099 5,839 (12.7)
Claim for tax refund 89 66 34.8
Prepaid taxes 3,181 2,672 19.0
Assets held for sale 64 - 100.0
Total Current Assets 52,371 47,912 9.3
NON-CURRENT ASSETS
Long-term investments 1,866 1,807 3.3
Property and equipment – net of accumulated depreciation 109,985 103,700 6.1
Prepaid pension benefit cost 807 1,331 (39.4)
Advances and other non-current assets 8,279 7,153 15.7
Claims for tax refund – net of current portion 934 1,013 (7.8)
Intangible assets – net of accumulated amortization 2,990 3,056 (2.2)
Deferred tax assets – net 230 201 14.4
Total Non-current Assets 125,091 118,261 5.8
TOTAL ASSETS 177,462 166,173 6.8
LIABILITIES AND EQUITY CURRENT LIABILITIES
Trade and other payables 14,894 14,284 4.3
Taxes payable 3,928 3,273 20.0
Accrued expenses 10,765 8,247 30.5
Unearned income 5,736 4,360 31.6
Advances from customers and suppliers 523 805 (35.0)
Short-term bank loans and current maturities of long-term liabilities 4,946 4,444 11.3
Total Current Liabilities 40,792 35,413 15.2
NON-CURRENT LIABILITIES
Deferred tax liabilities – net 1,510 2,110 (28.4)
Other liabilities 316 382 (17.3)
Long service award provisions 477 501 (4.8)
Pension benefits and other post-employment benefits 4,319 4,171 3.5
Long-term borrowings 27,697 30,168 (8.2)
Total Non-current Liabilities 34,319 37,332 (8.1)
TOTAL LIABILITIES 75,111 72,745 3.3
EQUITY
Capital stock 5,040 5,040 -
Additional paid-in capital 4,931 2,935 68.0
Treasury stock (2,541) (3,804) (33.2)
Other equity 296 508 (41.7)
TOTAL EQUITY 102,351 93,428 9.6
16
NINE MONTHS OF 2016 (UNAUDITED)
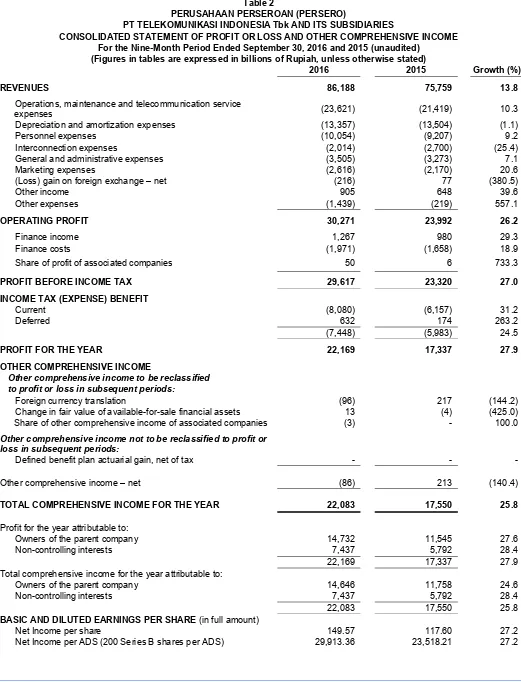
Table 2
PERUSAHAAN PERSEROAN (PERSERO)
PT TELEKOMUNIKASI INDONESIA Tbk AND ITS SUBSIDIARIES
CONSOLIDATED STATEMENT OF PROFIT OR LOSS AND OTHER COMPREHENSIVE INCOME For the Nine-Month Period Ended September 30, 2016 and 2015 (unaudited)
(Figures in tables are expressed in billions of Rupiah, unless otherwise stated)
2016 2015 Growth (%)
REVENUES 86,188 75,759 13.8
Operations, maintenance and telecommunication service
expenses (23,621) (21,419) 10.3
OPERATING PROFIT 30,271 23,992 26.2
Finance income 1,267 980 29.3
Finance costs (1,971) (1,658) 18.9 Share of profit of associated companies 50 6 733.3
PROFIT BEFORE INCOME TAX 29,617 23,320 27.0
Other comprehensive income to be reclassified to profit or loss in subsequent periods:
Foreign currency translation (96) 217 (144.2) Change in fair value of available-for-sale financial assets 13 (4) (425.0) Share of other comprehensive income of associated companies (3) - 100.0
Other comprehensive income not to be reclassified to profit or loss in subsequent periods:
Defined benefit plan actuarial gain, net of tax - - -
Other comprehensive income – net (86) 213 (140.4)
TOTAL COMPREHENSIVE INCOME FOR THE YEAR 22,083 17,550 25.8
Profit for the year attributable to:
Owners of the parent company 14,732 11,545 27.6 Non-controlling interests 7,437 5,792 28.4 22,169 17,337 27.9 Total comprehensive income for the year attributable to:
Owners of the parent company 14,646 11,758 24.6 Non-controlling interests 7,437 5,792 28.4 22,083 17,550 25.8
BASIC AND DILUTED EARNINGS PER SHARE (in full amount)
17
NINE MONTHS OF 2016 (UNAUDITED)
Table 3
PT TELEKOMUNIKASI SELULAR (TELKOMSEL) STATEMENTS OF FINANCIAL POSITION
AS OF SEPTEMBER 30, 2016 (UNAUDITED) WITH COMPARATIVE FIGURES AS OF DECEMBER 31, 2015 (AUDITED)
(figures are presented in billions of Rupiah)
Total Current Assets 27,718 25,660 8.0
NON-CURRENT ASSETS
Total Non-current Assets 58,423 58,426 0.0%
Total Current Liabilities 23,803 20,020 18.9
NON-CURRENT LIABILITIES
Medium-term & long-term loans - net of current maturities 2,646 5,061 (47.7) Obligations under finance lease - net of current maturities 4,767 4,899 (2.7) Deferred tax liabilities 1,151 1,392 (17.3)
Others 1,352 1,213 11.5
Total Non-current Liabilities 9,916 12,565 (21.1)
EQUITY
18
NINE MONTHS OF 2016 (UNAUDITED)
Table 4
PT TELEKOMUNIKASI SELULAR (TELKOMSEL) STATEMENTS OF PROFIT AND LOSS
FOR NINE MONTHS ENDED SEPTEMBER 30, 2016 AND 2015 (UNAUDITED)
(figures in tables are presented in billions of Rupiah)
2016 2015 Growth (%)
REVENUES
Postpaid 4,989 4,224 18.1
Prepaid 54,976 47,469 15.8
Interconnection & international roaming 3,363 3,545 (5.1)
Others 321 389 (17.4)
Total Revenues 63,649 55,627 14.4
EXPENSES
Operation & maintenance 15,777 13,791 14.4 Depreciation & amortization 9,470 9,234 2.6 Cost of services 2,356 2,698 (12.7) Interconnection & international roaming 2,088 2,243 (6.9)
Personnel 2,798 2,588 8.1
General & administration 1,354 1,263 7.1
Marketing 2,144 1,822 17.7
Others - net (179) 38 (566.4)
Total Expenses 35,808 33,677 6.3
Finance income (charges) - net 101 17 482.9
INCOME BEFORE TAX 27,942 21,967 27.2
INCOME TAX EXPENSE (6,916) (5,447) 27.0
NET INCOME 21,026 16,519 27.3
EBITDA 37,132 31,222 18.9
EBITDA Margin- over revenues 58.3% 56.1% 2.2ppt
ROA 31.8% 28.1% 3.8ppt