IDX : TLKM NYSE : TLK
Government of Indonesia : 52.1% Public : 47.9% Jl. Gatot Subroto Kav. 52, Jakarta 12710 Phone : 62 21 5215109 Fax : 62 21 5220500 Email : [email protected] Website : www.telkom.co.id
DISCLAIMER
This document contains financial conditions and result of operation, and may also contain certain projections, plans, strategies, and objectives of the Company, which would be treated as forward looking statements within the meaning of applicable law. Forward looking statements, by their nature, involve risk and uncertainty that could cause actual results and development to differ materially from those expressed or implied in these statements. Telkom Indonesia does not guarantee that any action, which may have been taken in reliance on this document, will bring specific results as expected.
Highlights
nTelkom Indonesia delivered remarkable performance in FY16 by recording triple-double-digit growth in Revenue, EBITDA, and Net Income of 13.5%, 15.7%, and 24.9% YoY, respectively.
nData, Internet & IT Services segment was the growth driver which increased by more than 31% YoY. The segment contributed 37.0% to total Revenue.
nTelkomsel remained focus on growing digital business, installing 25,744 new BTSs during the year, 92% of which were 3G/4G BTS.
Financial Highlights
Market Capitalization (Mar 3, 2016):
Rp388.1 Tn (USD29.2 Bn)
Average Daily Trading Volume 2016:
93.6 Mn Shares (IDX) & 438,619 DR (NYSE)
Average Daily Trading Value 2016:
2
PT TELKOM INDONESIA (PERSERO) Tbk
FULL YEAR OF 2016 (AUDITED)
The following analysis and discussion is based on our Indonesian GAAP financial statements for the full year ended December 31, 2015 and 2016. The reports have been submitted to Indonesia Financial
Cellular Voice and SMS 54,477 52,417 3.9
Data, Internet & IT Service 42,991 32,688 31.5
Fixed Line Voice 7,542 7,833 (3.7)
Interconnection 4,151 4,290 (3.2)
Network and Other Telco Services 7,172 5,242 36.8
Total 116,333 102,470 13.5
Telkom recorded total revenue of Rp116.3 trillion in 2016, an increase of 13.5% YoY with Data, Internet & IT Services as the growth driver. The details are as follows:
n Cellular Voice and SMS revenues increased by 3.9% YoY supported by successful innovative product
such as voice and combo packages that drove voice traffic as well as advanced pricing strategy.
n Data, Internet & IT Services revenues jumped 31.5% YoY mainly attributable to strong mobile and
fixed (IndiHome) broadband services. Mobile data traffic (payload) increased by 94.8%, while IndiHome successfully strengthened its footprint.
n Fixed Line Voice revenues decreased by 3.7% YoY due to cannibalization from mobile services that
resulted in decline in fixed line traffic.
n Interconnection revenues declined by 3.2% YoY in line with lower incoming voice and SMS services
mainly due to the widespread use of OTT messaging services.
n Network and Other Telecommunication Services revenues grew by 36.8% YoY mainly due to
3
Expenses
Key Indicators (Rp. Bn)
YoY
FY16 FY15 Growth (%)
Operation, Maintenance & Telecommunication Services 31,263 28,116 11.2
Personnel 13,612 11,874 14.6
Interconnection 3,218 3,586 (10.3)
Marketing 4,132 3,275 26.2
General & Administrative 4,610 4,204 9.7
4
EBITDA, EBITDA Margin, and Net Income
As a result of manageable operating expenses, EBITDA increased by 15.7% YoY to Rp59.5 trillion with EBITDA margin improved to 51.1% from 50.2% last year. While our Net Income sharply increased by 24.9% YoY to Rp19.4 trillion with strong Net Income margin of 16.6%, improved from 15.1% in 2015.
Financial Position
Key Indicators (Rp.Bn)
YTD
FY16 FY15 Growth (%)
Assets 179,611 166,173 8.1
Liabilities 74,067 72,745 1.8
Non-controlling Interests 21,160 18,292 15.7 Equity attributable to owners of the company 84,384 75,136 12.3
n Total assets as of 31 December 2016 reached Rp179.6 trillion, increased by 8.1% mainly due to
increase in fixed assets in line with capex absorption.
n Total liabilities at end of December 2016 increased 1.8% to Rp74.1 trillion mainly attributed to higher
accrued expenses.
5
Debts
Currencies (Rp.Bn)
YTD Portion (%)
FY16 FY15 Growth (%) FY16 FY15
IDR/Rupiah 26,091 26,476 (1.5) 93.9 88.2
USD/US Dollar 991 2,764 (64.1) 3.6 9.2 JPY/Japanese Yen 707 792 (10.7) 2.5 2.6
Total 27,789 30,032 (7.5) 100.0 100.0
6
Mobile Services
Telkomsel Financial Result
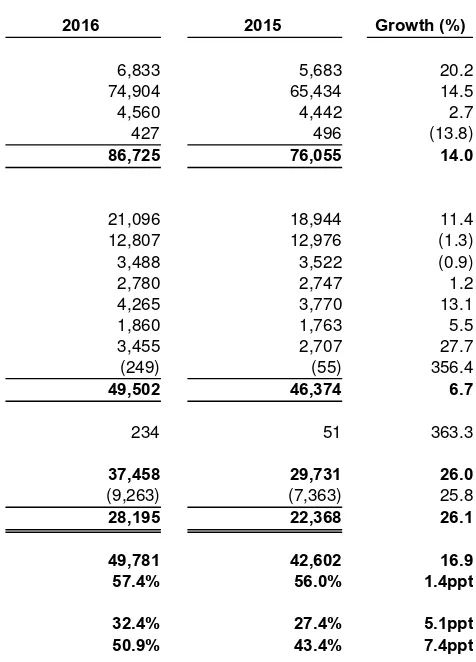
Telkomsel once again delivered a set of remarkable results for 2016 in terms of both financial and operational perspective. For the fifth consecutive year, we achieved triple-double-digit growth in Revenues, EBITDA and Net Income at 14.0%, 16.9% and 26.1% YoY, respectively, driven by the successful execution of our transformation with Digital Business as engine of growth and healthy performance in the Legacy business. Revenues grew to Rp86,725 billion with Digital Business continued to be the growth engine and posted 36.9% YoY growth, driven by Data which increased by 36.6% YoY and Digital Services which increased by 38.8% YoY. Digital Business accounted for 35.4% of total revenues, increased significantly from 29.5% a year ago. We were able to sustain our Legacy business despite Over The Top (OTT) cannibalization in SMS, which grew by 4.5% YoY (Voice +10.1% and SMS -3.3% YoY) due to successful execution of cluster-based pricing, market segmentation and superior network. EBITDA and Net Income margins were higher by 1.4ppt and 3.1ppt to 57.4% and 32.5%, respectively.
Despite a saturated market, Telkomsel was able to have a healthy growth in subscriber base of 13.9% YoY to 173.9 million attributable to effective sales and marketing programs. In line with our philosophy to always lead in network supply and grow our Digital Business, we deployed 25,744 new BTS during 2016 of which 92.4% were 3G/4G BTS. Our data traffic increased by 94.8% to 958,733 TB mainly fueled by high growth in 3G/4G capable device that reached 82.6 million (+33.9% YoY), or 47.5% of our customer base. In terms of infrastructure, by end of December 2016 our BTS on-air totaled 129,033 units (+24.9% YoY), 61.0% of
FY16 FY15 Growth (%) 4Q16 3Q16 Growth (%)
Revenues 86,725 76,055 14.0 23,076 22,544 2.4
Legacy 56,066 53,652 4.5 14,589 14,605 (0.1)
Digital Business 30,659 22,403 36.9 8,488 7,939 6.9 Expenses incl. Depreciation & others 49,502 46,374 6.7 13,694 12,404 10.4
EBITDA 49,781 42,602 16.9 12,649 13,292 (4.8)
EBITDA Margin (%) 57.4% 56.0% 1.4ppt 54.8% 59.0% (4.1ppt)
Net Income 28,195 22,368 26.1 7,169 7,614 (5.8)
Net Income Margin (%) 32.5% 29.4% 3.1ppt 31.1% 33.8% (2.7ppt) Proportion of Digital Business (%) 35.4% 29.5% 5.9ppt 36.8% 35.2% 1.6ppt
Telkomsel recorded operating revenues of Rp86,725 billion for FY16, an increase of 14.0% YoY.
n Prepaid revenue increased by 14.5% YoY to Rp74,904 billion, mainly driven by ARPU growth supported
7
customers contributed 7.9% to total revenue.
n Interconnection and International Roaming revenues increased slightly by 2.7% YoY to Rp4,560 billion,
due to seasonal increase in traffic from other local operators.
In FY16, total expenses including depreciation and amortization increased by 6.7% YoY to Rp49,502 billion, lower than revenue growth of 14.0%, indicating Telkomsel operational efficiency.
n Operation & Maintenance expenses increased by 11.4% YoY to Rp21,096 billion in line with the
8
equivalents.
n Non-current Assets increased 4.3% at Rp60,963 billion, mainly attributable to the increase in intangible
assets.
n Current Liabilities increased 9.3% to Rp21,891 billion mainly due to the increase in account payable and
unearned revenue.
n Non-current Liabilities decreased 32.2% to Rp8,520 billion, mainly due to lower outstanding
medium-term loans.
n Total Equity increased by 15.3% to Rp59,370 billion due to additional retained earnings as a result of
the higher net income in this period.
Cash Flow
Net cash generated from operations in FY16 increased 17.7% YoY to Rp42,805 billion. Cash flow used in investment activities was Rp12,794 billion mainly for the payment of infrastructure spending. Net cash used in financing activities (exclude Dividend) were Rp4,731 billion, compared to Rp2,077 billion generated last
year due to proceed from short & medium-term loans.
Statements of Cash Flows
For Full Year Ended December 31, 2016 and 2015
Statements of Cash Flows (Rp Bn) FY16 FY15 Growth (%)
Cash Flow from Operating Activities 42,805 36,359 17.7 Cash Flow for Investing Activities (12,794) (12,951) (1.2) Cash Flow from (for) Financing Activities (4,731) 2,077 (327.8)
Dividend Payment (19,401) (21,533) (9.9)
Net Increase in Cash & Cash Equivalents 5,879 3,951 48.8 Cash and Cash Equivalents at Beginning of Years 13,802 9,851 40.1 Cash and Cash Equivalents at End of Years 19,681 13,802 42.6
Debt Profile
9
RESULTS BY SERVICE
Celullar Services
As of 31 December 2016, Telkomsel served 173.9 million subscribers nationwide, an increase of 13.9% YoY. Out of the total base, 47.5% or 82.6 million were using 3G/4G capable device which grew strongly by 33.9% YoY.
Voice and SMS
We were able to sustain healthy revenue growth from voice, which increased by 10.1% YoY to Rp40,030 billion. The healthy growth in voice revenue mainly attributable to higher voice traffic (MoU) which increased by 3.1% YoY to 231.7 billion minutes. The higher traffic is mainly due to improvement in network quality, high proportion of base still using 2G handset devices, aggressive promotion to migrate from Pay As You Use (PAYU) to voice packages as well as growth in our customer base.
On the other hand, revenue from SMS declined by 3.3% YoY to Rp13,209 billion due to the decline in SMS traffic (-16.4% YoY to 182.8 billion units) as we have seen trend of OTT services cannibalization such as instant messaging applications.
Digital Business
Digital business remained our engine of growth with our focus to continue leading network supply in 3G and 4G infrastructure. This segment recorded strong performance with 36.9% YoY growth to Rp30,659 billion and increased its contribution to total revenue substantially to 35.4% from 29.5% last year.
Revenue from Data grew by 36.6% YoY to Rp27,708 billion, driven by healthy growth in 3G/4G capable device adoption (+33.9% YoY to 82.6 million users), successful migration of PAYU to Flash packages, as well as continued strong growth in data payload, which increased by 94.8% YoY to 958,733 TB. As of 31 December 2016, 19.0 million of our customers that have LTE devices have swapped to USIM to utilize 4G services.
Digital Services also grew strongly by 38.8% YoY to Rp2,951 billion. Key products and services within this segment included Digital Lifestyle (Music, Games, Video Contents, etc.), Digital Advertising, Mobile Financial Services (Mobile Banking, T-Cash, T-Wallet) and Enterprise Digital Services (T-Drive, T-Bike, etc.).
Network Deployment
10
ARPU
Blended ARPU increased 5.2% YoY due to successful implementation of cluster-based pricing, market segmentation, higher quality customer base, increase in 3G/4G capable device penetration as well as strong growth in data payload resulted in overall higher ARPU contribution. We see the trend of higher ARPU contribution when customers migrate from 2G to 3G and also from 3G to 4G device. While data ARPU are still growing strongly, we started to see declining on voice ARPU and SMS ARPU due to cannibalization of OTT services.
The following table presents performance of our cellular business:
11
Fixed Line Services
Consumer Services - IndiHome
As of December 2016, total IndiHome subscribers reached 1.62 million. ARPU of IndiHome in 4Q16 was Rp341 thousand, improved from Rp313 thousand in the previous quarter. To improve IndiHome ARPU level, we encouraged customers to purchase various add-ons or to upgrade to higher speed services.
12
Backbone Networks
We continuously expand our terrestrial and submarine backbone to support both our mobile and fixed business. In the end of 4Q16 we completed Sulawesi-Maluku-Papua Cable System (SMPCS) Extension and other domestic fiber optic backbone which spans more than 4,000 km.
In an effort to become international data hub, we completed Southeast Asia-Middle East-West Europe-5 (SEA-ME-WE-5) submarine cable system which spans 20,000 km from Dumai, Indonesia to Marseilles, France constructed in consortium with a number of telco operators. Including this cable system, our total fiber-based backbone network reached 106,600 km as of December 2016.
13
Telkom is also going to launch another satellite, Telkom-4, in 2Q18. It has higher capacity as it will carry 48 C-Band and 12 extended C-Band transponders. As of December 2016, the progress of this project was around 41.8%.
Recent Development
14
charge. VideoMax has 3 data packages variant for movie lovers with affordable prices and quota up to 12GB.
n Telkomsel launched Pesta Akhir Tahun program to appreciate and increase customer loyalty with a
chance to win various prizes including four BMW Series 3, six Toyota Sienta, 100 Honda Beat, 500 LG K4 Smartphone and 1,000 packages of credit worth Rp1 million each by purchasing selected products and redeemed POIN at *123# or MyTelkomsel App.
ADDITIONAL INFORMATION
Awards & Recognition
During 4Q16, we have been awarded by several institutions for our achievements, among others:
n Good Corporate Governance Award 2016 for Telkom as The Most Trusted Company based on
Corporate Governance Perception Index and Investors and Analysts Assessment Survey from the Institute for Corporate Governance (IICG).
n Tokoh Finansial Indonesia Award 2016 for Telkom as The Best SOE 2016 for non-financial,
telecommunication and broadcasting sector, and for Alex J. Sinaga as Top Executive of Listed Company 2016 from Investor Magazine.
n Top Infrastructure Award 2016 for Telkom as Top Infrastructure on Telecommunication Sector 2016
from Business News Indonesia Magazine.
n TOP IT & Telco 2016 Award for Telkom as Best Company in IT and Telco Sector in Indonesia, Top IT
Corporate Best Practice, Top IT Special Recognition, Top CSR based on IT, Top Internet Service Provider for IndiHome, and Top IT Leadership for Alex J. Sinaga from Ministry of ICT and I-Tech Magazine.
n Economic Challenges Award 2016 for Telkom in Telecommunication Sector from Metro TV.
n Indonesia Customer Satisfaction Award 2016 for IndiHome as No. 1 Brand in Internet Service Provider
Wireline/Fixed category from Frontier Consulting Group and SWA Magazine.
n Asia Corporate Excellence & Sustainability Awards 2016 (ACES) for Telkom as Top Companies to
Work For in Asia from MORS Group.
n Corporate Governance Conference & Awards for Telkom as The Best State-Owned Enterprise and Top
50 Public Listed Companies from Indonesian Institute for Corporate Directorship (IICD).
n Golden World Awards 2016 for Telkom in Digital Media Relations and Social Media for PR categories
from The International Public Relations Association (IPRA).
n 9th Annual Indonesia Excellence Awards for Telkom as Indonesia Telecom Service Provider of the
Year, for TelkomSigma as Indonesia Data Center Provider of the Year and Indonesia Telco Big Data Service Provider of the Year, for Telkomtelstra as Indonesia Managed Service Provider of the Year, and for Infomedia as Indonesia Contact Center Outsourcing Service Provider of the Year from Frost & Sullivan.
n The 2016 International Business Award (IBA) for Telkom receiving 7 Gold Stevie Winners, 6 Silver
15
n The IDX Best Blue 2016 for Telkom from Indonesia Stock Exchange.
n Global Carrier Awards (GCA)2016 for Telin as the Best IP Transit (IPX) Service from Capacity Media.
n Carriers World Awards 2016 for Telin as Best Regional Carrier Wholesale from Total Telecom.
n World Communication Awards (WCA) 2016 for Ririek Adriansyah as CEO of The Year 2016 from Total
Telecom.
n Broadband Awards 2016 for Telkomsel as Top 5 Best Customer Experience Innovation (Bill Shock
16
Table 1
PERUSAHAAN PERSEROAN (PERSERO)
PT. TELEKOMUNIKASI INDONESIA Tbk AND SUBSIDIARIES CONSOLIDATED STATEMENT OF FINANCIAL POSITION
As of December 31, 2016
(Figures in tables are expressed in billions of Rupiah, unless otherwise stated)
2016 2015 Growth (%)
ASSETS
CURRENT ASSETS
Cash and cash equivalents 29,767 28,117 5.9
Other current financial assets 1,471 2,818 (47.8)
17
Table 2
PERUSAHAAN PERSEROAN (PERSERO)
PT TELEKOMUNIKASI INDONESIA Tbk AND SUBSIDIARIES
CONSOLIDATED STATEMENT OF PROFIT OR LOSS AND OTHER COMPREHENSIVE INCOME For the Year Ended December 31, 2016
(Figures in tables are expressed in billions of Rupiah, unless otherwise stated)
2016 2015 Growth (%)
REVENUES 116,333 102,470 13.5
Operations, maintenance and telecommunication service
expenses (31,263) (28,116) 11.2
Depreciation and amortization expenses (18,532) (18,534) (0.0) Personnel expenses (13,612) (11,874) 14.6 Interconnection expenses (3,218) (3,586) (10.3) General and administrative expenses (4,610) (4,204) 9.7
Marketing expenses (4,132) (3,275) 26.2
18
Table 3
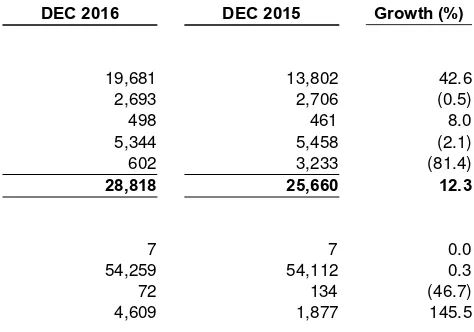
PT TELEKOMUNIKASI SELULAR (TELKOMSEL) STATEMENTS OF FINANCIAL POSITION
AS OF DECEMBER 31, 2016 (AUDITED) WITH COMPARATIVE FIGURES AS OF DECEMBER 31, 2015 (AUDITED)
(figures are presented in billions of Rupiah)
DEC 2016 DEC 2015 Growth (%)
ASSETS
CURRENT ASSETS
Cash & cash equivalents 19,681 13,802 42.6
Accounts receivables 2,693 2,706 (0.5)
Accrued income 498 461 8.0
Current portion of long-term prepayments 5,344 5,458 (2.1)
Others 602 3,233 (81.4)
Total Current Assets 28,818 25,660 12.3
NON-CURRENT ASSETS
Long-term investment 7 7 0.0
Fixed assets-net 54,259 54,112 0.3
Advances for fixed assets 72 134 (46.7)
Intangible assets-net 4,609 1,877 145.5
19
Table 4
PT TELEKOMUNIKASI SELULAR (TELKOMSEL) STATEMENTS OF PROFIT AND LOSS
FOR THE YEARS ENDED DECEMBER 31, 2016 AND 2015 (AUDITED)
(figures in tables are presented in billions of Rupiah)