www.elsevier.com / locate / livprodsci
Effect of chopping and level of inclusion of whole sugar cane
in the diet on intake and growth of goats
a ,
*
b cNguyen Thi Mui
, Inger Ledin , Dinh Van Binh
a
National Institute of Animal Husbandry, Hanoi, Viet Nam
b
Department of Animal Nutrition and Management, Swedish University of Agricultural Sciences, P.O. Box 7024, 750 07 Uppsala, Sweden
c
Goat and Rabbit Research Centre, Sontay, Hatay, Viet Nam
Received 18 January 1999; received in revised form 14 December 1999; accepted 11 January 2000
Abstract
A total of 156 crossbred goats (F1 of India3Bachthao) with an initial weight of 10.2–11.9 kg and ages ranging between 3.5 and 4 months were used in studies to examine how physical form and inclusion level of sugar cane influenced intake. In the intake study whole sugar cane was divided into leaves, tops and stalks. The leaves were offered chopped into five different lengths (5, 10, 15, 20 and 25 cm) and a control group was given whole leaves. The sugar cane tops were chopped into: (i) slices (1–3 cm), (ii) 15-cm lengths and split into two parts, (iii) 20-cm lengths and split into four parts. The sugar cane stalks were chopped in three different ways: (i) slices (1–3 cm), (ii), 20-cm lengths and rind removed, and (iii) 15-cm lengths and split into four parts but with the rind remaining. The goats were given a basal diet of concentrate and molasses–urea blocks. The results of the intake study showed that slicing the sugar cane stalks into small pieces (1–3 cm) resulted in a significant increase in feed intake, while there were no important differences between the different methods used for processing sugar cane leaves or tops in terms of voluntary dry matter (DM) intake. In the rate of inclusion study the goats were fed a basal diet of concentrate, a molasses–urea block and jack fruit leaves. Chopped whole sugar cane (CWSC) was combined with guinea grass at different ratios to provide 0, 15, 30, 45, 60 and 75% sugar cane on a DM basis. The actual intakes achieved were 0, 13, 23, 26, 37 and 51% CWSC, respectively, of DM. The results showed that when using CWSC in the diet for growing goats, an inclusion of 30% total DM resulting in a consumption of 23% of DM was optimal in terms of liveweight gain, feed conversion ratio and feed costs. DM digestibility was not significantly different for the treatments in the latter study (62.2–66.7%), but crude fibre digestibility was highest for the treatment without sugar cane and lowest for the treatment with the highest consumption of CWSC. A weak negative relationship was identified between the digestibility of crude fibre (Y ) and the proportion of CWSC (X ) in the diets represented by equation: Y50.597–0.0017X,
2
r 50.016 2000 Elsevier Science B.V. All rights reserved.
Keywords: Goat; Whole sugar cane; Processing; Intake; Growth
*Corresponding author. Tel.:146-18-671-646; fax:146-18-672-995. E-mail address: [email protected] (N.T. Mui).
1. Introduction by decreasing the length of the long fibres in the rind. Voluntary intake by cattle was increased by Sugar cane consists of three principal fractions, 38% when the stalks were chopped to 15-cm lengths stalk, tops and green leaves. The chemical com- and the rind removed, resulting in a DM intake of position and digestibility, which differ between these 18.7 g / kg body weight (BW) (Preston, 1977). fractions have been studied by several authors. Perez The objectives of the present study were to and Garcia (1975) found that whole sugar cane identify how the particle size of different compo-contained 16% total sugars, 3.2% crude protein (CP) nents of the sugar cane plant influenced voluntary and 35% acid detergent fibre (ADF), all expressed in feed intake of growing goats and how different rates percent of dry matter (DM), and 11.3 MJ / kg DM. In of CWSC inclusion influenced feed intake and the work reported by Mui et al. (1996) the DM growth rate.
content was 28–29% in the leaves, 16–18% in the tops and 24–29% in the stalks. DM digestibility has
been found to be between 69 and 72% for the stalk 2. Materials and methods
or stalks mixed with leaves (Ffoulkes and Preston,
1979). While the digestibility of the fibre in sugar 2.1. Location and climate of the study area cane does not exceed 25%, in contrast to the grasses
the overall digestibility does not decrease with The experiments were conducted at the Goat and maturity. There is rather a slight increase in di- Rabbit Research Centre, Hatay province, 60 km gestibility, since accumulation of the soluble cell north-west of Hanoi. The Centre is located in the contents (sugars) more than offsets the decline in cell buffer zone between the mountainous area and the wall digestibility caused by lignification of the delta, 1058259 E and 218069 N, 220 m above sea structural cell wall carbohydrates (Preston, 1977). level. The climate is monsoon-tropical, with a wet In the last decades much work has been done on season between April and November and a dry sugar cane, concerning digestibility, metabolism and season from December to March. Average annual effect of supplementation with non-protein nitrogen, rainfall is 1850 mm, with a mean temperature range minerals or protein-rich foliages. The studies have of 24–308C. The experiments were conducted in the generally focussed on milk and meat production in dry season.
systems with dual-purpose cattle. There is, however,
very little known about the feeding of chopped 2.2. Experimental animals and feeds whole sugar cane (CWSC) to growing and lactating
(Ar-Table 1 30% bone meal. The chemical composition of the Chemical composition of the feeds feeds is shown in Table 1.
DM OM Ash CP CF
(g / kg) (g / kg (g / kg (g / kg (g / kg
2.3. Experimental design
DM) DM) DM) DM)
Jack fruit 328 891 112 145 275
Concentrate 900 977 14 185 71 2.3.1. The intake experiment
MUB 670 – – 370 49 Three experiments were carried out to study the Guinea grass 254 891 109 81 380 intake of three fractions of whole sugar cane (leaves, Whole sugar cane 256 978 21 21 297
tops and stems) chopped into different lengths. The
Stalks 270 – – 17 235
animals, 108 growing goats (1–2 weeks after
wean-Tops 183 – – 41 362
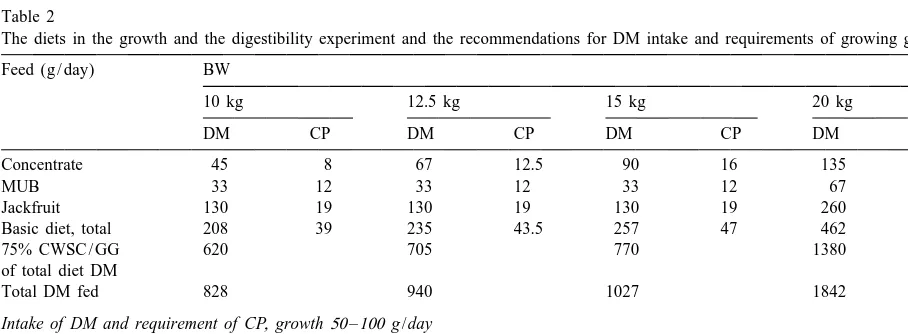
Green leaves 294 – – 76 393 ing), were given leaves, tops and stalks ad lib. at the rate of 150% of the fresh intake the previous day (Castle et al., 1979; Forbes, 1995; Peacock, 1996). tocarpus heterophyllus). The sugar cane leaves were Each experiment lasted 19 days, with 10 days of harvested daily, while the cane tops and stalks were adaptation to the diet and 9 days of measuring intake harvested weekly. The jack fruit leaves and GG were and refusals. Samples of feed offered and refusals harvested daily early in the morning from the area were taken for DM determination every day. The around the centre. GG was cut at 35–40 days and air goats were given a basal diet of concentrate (50 dried under shade or in the house for 1 h before g / day), MUB (50 g / day) and jack fruit foliage (400 feeding. The concentrate used in the experiments g / day) as a protein source, corresponding to the was produced at the centre using local ingredients requirements for growing goats at 10 kg BW and a (20% rice bran, 12% maize meal, 15% cassava root liveweight gain of 50–100 g / day (Devendra and meal, 30% groundnut cake, 10% soy bean meal, 4% McLeroy, 1982; Table 2).
fish meal, 3% salt and 6% minerals). The molasses– The foliage was given as small bunches hanging urea blocks (MUB) consisting of 35% rice bran, above the feeding troughs of the pen. The sugar cane 10% urea, 15% minerals, 5% salt and 35% molasses was chopped with a machete. Sugar cane leaves, tops were also made at the centre. The mineral mixture in or stems were offered three times daily, one-third in the concentrate and the MUB was 70% CaCO and3 the morning (07:00 h) together with the MUB,
one-Table 2
The diets in the growth and the digestibility experiment and the recommendations for DM intake and requirements of growing goats Feed (g / day) BW
10 kg 12.5 kg 15 kg 20 kg
DM CP DM CP DM CP DM CP
Concentrate 45 8 67 12.5 90 16 135 25
MUB 33 12 33 12 33 12 67 24
Jackfruit 130 19 130 19 130 19 260 38
Basic diet, total 208 39 235 43.5 257 47 462 87
75% CWSC / GG 620 705 770 1380
of total diet DM
Total DM fed 828 940 1027 1842
Intake of DM and requirement of CP, growth 50 –100 g /day
a
After Devendra and 505 40 545 44 584 47 663 53
McLeroy (1982)
a
After Peacock (1996) 300 43 375 47 450 51 600 59
a
third at noon (12:00 h) together with the concentrate intervals during the whole experimental period (110 and the rest in the afternoon (18:00 h) together with days), always before the morning feeding.
jack fruit foliage. All the feeds were fed in separated
troughs. The animals had free access to fresh water 2.3.3. The digestibility experiment
and a mineral lick with the composition 70% Six male goats were chosen for a digestibility trial. Ca (PO ) , 15% NaCl and 15% cement as a binding3 4 2 The goats were randomly allocated to same six diets agent. The liveweights were recorded before and as in the growth experiment (Table 2) and with the after the experiments. same feeding and management routines as in the In the first part of the experiment 36 goats were intake experiment. The experiment consisted of 9 fed green sugar cane leaves, harvested at the normal days adaptation followed by 7 days collection, harvesting time. The goats were divided randomly repeated for three periods using the same animals but into six groups of three males and three females. The with a new random allocation for each period. All sugar cane leaves were chopped into five different animals were penned in digestibility crates during the lengths; 5, 10, 15, 20, 25 cm and one group was experiment but were allowed 10 days of free feed-given whole leaves. ing / grazing between the collection periods.
In the second part of the experiment 36 goats were During the collection period, feed offered and randomly divided into three groups of 12 goats refusals of CWSC, GG, jack fruit foliage, concen-(seven males and five females). The goats were fed trates and MUB were measured and faeces were sugar cane tops chopped three different ways: (i) collected. Samples of feed and refusals were taken 1–3-cm slices, (ii) 15-cm lengths and split into two for analysis of content of DM, CP and crude fibre parts, (iii) 20-cm lengths and split into four parts. (CF). The faeces were weighed every day at 07:00 h In the third part of the experiment 36 goats were then mixed thoroughly and 10% was taken for DM randomly divided into three groups of 12 goats (eight determination at 608C. The samples were analysed males and four females). The goats were fed sugar using the standard methods of AOAC (1985). The cane stalks chopped three different ways: (i) 1–3-cm digestibility coefficients for DM (DDM), CP (DCP) slices, (ii) 20-cm lengths and rind removed, (iii) and CF (DCF) of the total diet were calculated as 15-cm lengths and split into four parts but with the described by McDonald et al. (1992).
rind remaining.
2.4. Statistical analysis 2.3.2. The growth experiment
In the growth experiment the effect of the level of
The data from the experiments were analysed CWSC inclusion on growth and feed intake was
using Minitab Software (1994). The results from the examined. Based on the results from the intake
intake and the growth experiment were analysed experiment the smallest particle size (1–3 cm) was
using one-way analysis of variance. The treatment chosen for the experiment. A completely randomized
means which showed significant differences at the design was used and 48 goats were allocated to six
probability level of P,0.05 were compared with treatments (five males and three females per
treat-each other using the Fisher pairwise comparison ment), where CWSC was combined with GG at six
procedures. different ratios. The same feeding and management
The model used in the analysis was: routines as in experiment 1 were used. The diets in
the experiment and the requirements for growing Yij5m 1Ti1eij
goats are presented in Table 2. The ratios of CWSC /
GG on a DM basis of 0 / 100, 20 / 80, 40 / 60, 60 / 40, where Y is the jth observation of the ith treatment,ij
80 / 20 and 100 / 0, corresponded to 0, 15, 30, 45, 60 m is the general mean, T is the effect of the ithi
and 75% CWSC in total dietary DM. The amount of treatment, and e is the random error effect.ij
covariance using initial weight as independent vari- where Y is the jth observation of the ith treatment, a able adjusting feed intake, live weight gain and feed the intercept, b the slope of Y against the corre-i
conversion ratio (FCR calculated as total DM intake sponding value of X , Xi i the effect of the ith divided by total liveweight gain) of the animals for treatment, and e the random error effect.ij
the overall experimental period. The model used was:
3. Results
Yij5m 1Ti1b(Xij2X )1eij
3.1. Voluntary feed intake of different parts of where Y is the jth observation of the ith treatment,ij
whole sugar cane m is the general mean, T is the effect of the ithi
treatment, b is the regression of Y on X , X is theij ij ij
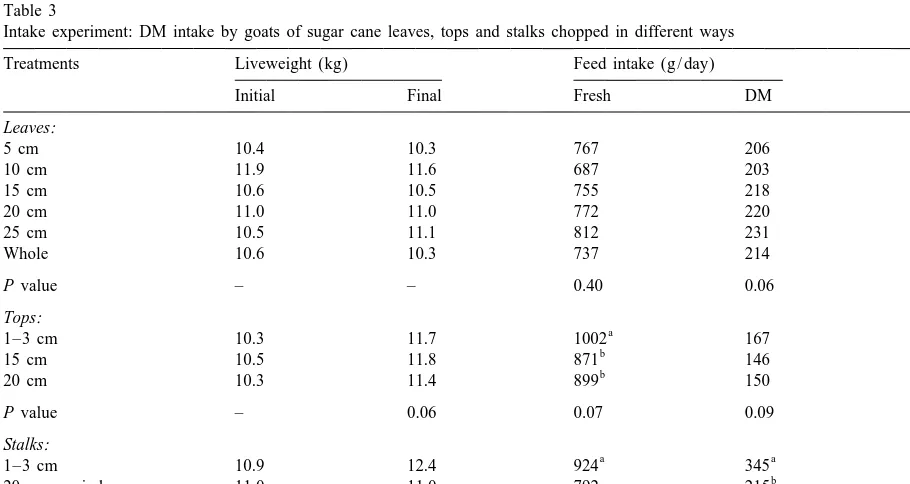
The results from the intake studies are shown in record of the covariate in the individual indicated by
Table 3. Voluntary intake of fresh green leaves varied the subscripts, X, is the overall mean of the
according to chopping length and was in the range of covariate, and e is the random error effect.ij
687–812 g / head per day or 203–231 g DM / head In the digestibility experiment, DDM, DCP and
per day. Feed intake was highest when the leaves DCF of the total diet were calculated by difference,
were chopped into 25-cm lengths, but there were no with the assumption that there were no interactions
significant differences in intake between the different with the basal diet. Regression analysis was used to
chopping lengths in the experiment. determine the relationship between level of CWSC
The intake of fresh sugar cane tops was sig-included in the diet and the DDM of the diet and the
nificantly higher for animals fed the tops chopped relationship between fibre content and DCF of the
into slices of 1–3 cm (1002 g / head per day) diet. The model used was:
compared with chopped at 15 or 20-cm lengths (876 and 899 g / head per day, respectively). When com-Yij5a1bXi1eij
Table 3
Intake experiment: DM intake by goats of sugar cane leaves, tops and stalks chopped in different ways
Treatments Liveweight (kg) Feed intake (g / day) DM / kg
BW
pared on a DM basis or as g / kg BW the smallest the leaves had the highest level of CP, 7.6%. Since the stalk constitutes the major part of the DM of the chopping size still resulted in the highest intake, but
whole sugar cane the average value is low. Jack fruit the differences were not significant.
leaves had a high CP value (14.5%) and a CF value Chopping of sugar cane stalks into 1–3-cm slices
comparable to that of CWSC. The ash content was significantly increased feed intake of fresh and dry
high in jack fruit and GG but low in the whole sugar material as well as DM intake expressed in g per kg
cane. BW. Removing the rind also improved intake
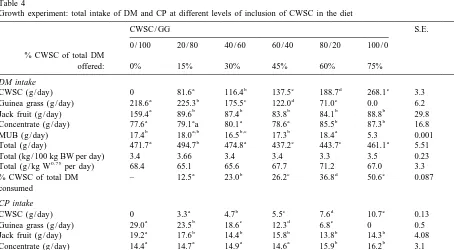
com-Analysis of variance of levels of inclusion of pared to when the rind was included. All goats
CWSC on voluntary feed intake (Table 4) showed maintained body weight with green sugar cane leaves
that total DM intake was significantly different and increased live weight in the trials with sugar
between the treatments (437–495 g / day). The in-cane tops or stalks after 19 days on the diet.
tended levels of inclusion of CWSC in DM were not achieved but the actual intake was lower than 3.2. Chemical composition of the feeds, voluntary
planned at all levels. The average DM intake in feed intake, feed conversion ratio and live weight
percent of BW was, however, similar for all treat-gain of goats in relation to level of inclusion of
ments, between 3.3 and 3.6%. The intake of DM CWSC in the diets.
0.75
related to the metabolic body weight (W ) did not 0.75 Chemical compositions of the feeds in both the differ between treatments (65–71 g / kg W ). The
0.75
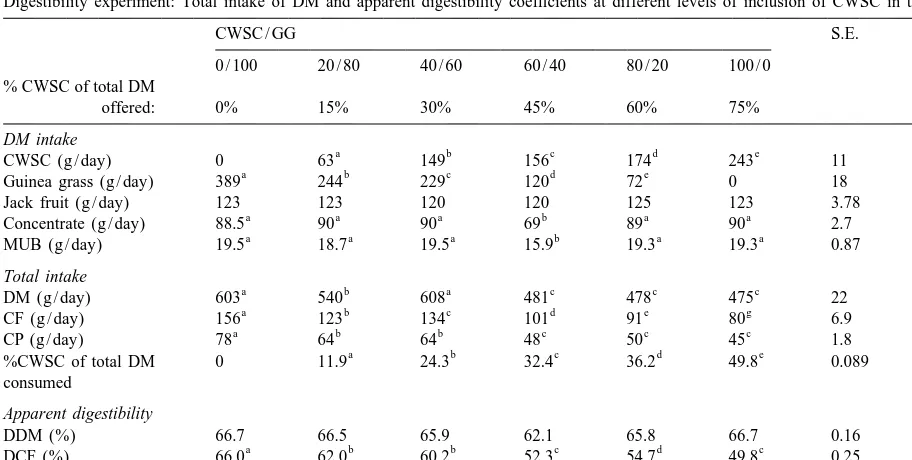
growth and digestibility studies are presented in intake of CP, both total and per kg W decreased Table 1. CWSC and GG had a similar DM content. significantly with increasing level of CWSC. CWSC had a low value for CP, only 2% of DM. The The DDM, DCP and DCF of the six diets are lowest content of CP was in the stalks, 1.7%, while presented in Table 5. The actual intake was
follow-Table 4
Growth experiment: total intake of DM and CP at different levels of inclusion of CWSC in the diet
CWSC / GG S.E. Prob.
Guinea grass (g / day) 218.6 225.3 175.5 122.0 71.0 0.0 6.2 0.001
a b b b b b
Jack fruit (g / day) 159.4 89.6 87.4 83.8 84.1 88.8 29.8 0.053
a a a a b b
Concentrate (g / day) 77.6 79.1 a 80.1 78.6 85.5 87.3 16.8 0.001
b a,b b,c b a a b
MUB (g / day) 17.4 18.0 16.5 17.3 18.4 5.3 0.001 17.7 ,
a b a c c a
Total (g / day) 471.7 494.7 474.8 437.2 443.7 461.1 5.51 0.057
Total (kg / 100 kg BW per day) 3.4 3.66 3.4 3.4 3.3 3.5 0.23 0.88
Concentrate (g / day) 14.4 14.7 14.9 14.6 15.9 16.2 3.1 0.001
MUB (g / day) 3.2 3.4 3.1 3.3 3.2 3.4 0.09 0.10
a b c d e f
Total (g / day) 66.0 62.0 56.0 51.0 47.0 44.0 0.48 0.001
0.75 a a b b c b
Total (g / kg W per day) 9.3 8.9 8.0 7.6 6.8 6.5 0.29 0.001
Table 5
Digestibility experiment: Total intake of DM and apparent digestibility coefficients at different levels of inclusion of CWSC in the diet
CWSC / GG S.E. Prob.
%CWSC of total DM 0 11.9 24.3 32.4 36.2 49.8 0.089 0.05
consumed
LS-means within rows with different superscripts differ significantly (P,0.05).
ing the same trend as in the growth trial though the tive relationship between the DCF and the proportion values were somewhat different. The DDM of the of actual intake of CWSC in the diets, represented by
2
diets was between 62.2 and 66.7% and did not differ the equation: Y50.597–0.0017X, r 50.016 where significantly between treatments. The DCP was Y5DCF and X5% CWSC in the diet.
significantly higher in the diets containing up to The effect of including CWSC in the diets on the 24.3% CWSC as a roughage compared to the diets live weight gain is shown in Table 6. When the diet with 32.4% or more CWSC, which had a similar consisted to 36.8 and 50.6% of DM of CWSC there DCP. The DCF was highest for the treatment con- was a significantly lower daily gain as compared to taining 100% GG and decreased gradually when the 12.5, 23 and 26.2% DM of CWSC. The diet in which level of CWSC increased. There was a weak nega- 23% of the DM consisted of CWSC gave the
Table 6
Live weight gain (LWG), feed conversion ratio (FCR) and feed costs at different levels of inclusion of CWSC in the diet to goats
CWSC / GG Prob.
0 / 100 20 / 80 40 / 60 60 / 40 80 / 20 100 / 0 % CWSC of total DM
offered: 0% 15% 30% 45% 60% 75%
Initial weight (kg) 11.6 10.2 10.8 10.9 10.6 10.9 0.54
a a b c a a
Final weight (kg) 16.0 16.2 18.1 16.9 15.5 15.7 0.054
a b c b d d
significantly highest live weight gain (P,0.05), the The lower feed intake noted when the goats were best FCR and lowest feed cost. There was an fed chopped cane stalk with the rind remaining indication that when using 50.6% of the DM as indicates that the highly lignified outer rind has a CWSC in the diet, i.e., replacing all GG with sugar negative effect on intake. Preston (1977) suggested cane, the feed costs were reduced by 23% compared that the long fibres present in the rind act as a to feeding only GG, but the lowest costs were limiting factor on intake. When the cane was chop-obtained with 23% CWSC, which reduced the feed ped into 1–3-cm lengths these fibres were shortened, costs by 40%. which resulted in a higher intake. Slicing sugar cane can also give the goats the possibility to select the more digestible components in the core of the stalk.
4. Discussion The animals on all the treatments consumed more
DM / kg BW than reported by Devendra and The harvesting time of sugar cane is concentrated McLeroy (1982) for meat goats in the tropics (3– to 3–5 months in the dry season and the biomass 3.1%), but less than was reported from India by yield is high, from 80 to 154 tonnes / ha (Mui et al., Gupta (1992), 4.35–4.42%. Ashok and Wadhwani 1996). The annual biomass yield of GG varies from (1992) reported similar results, 3.05–3.66 and 3.77% 60 to 150 tonnes / ha depending on soil fertility and of BW. However, the average DM intake per kg
0.75
altitude, with the majority of production in the wet W was similar to the level recommended by 0.75 season. Although total production costs were higher AFRC (1998) for growing goats (66 g DM / kg W for sugar cane, the cost per unit of DM produced was daily), and these findings are in agreement with those lower compared to GG (Mui, 1993). With regards to of Gupta (1992), Shaer et al. (1996), Islam et al. the period of availability and the production costs it (1997) and Shoo (1990).
is therefore interesting to look at the possibilities to Data from the digestibility trial indicated that the replace at least part of the grass with sugar cane. average DM digestibility for the six treatments was The results of the present studies showed that feed 65%. Similar values were obtained by Gupta (1992), intake by goats was highest when sugar cane tops Shaer et al. (1996) and Islam et al. (1997) when and stalks were chopped into 1–3 cm. The green feeding different rations to growing goats. DCF leaves could be fed at any length from 5 to 25 cm, declined when the level of CWSC increased in the even whole to goats without any negative effect on diet, indicating that the fibre fraction from sugar cane intake. These results are in agreement with findings has a lower digestibility than the fibre from GG. in a study on cattle reported by Montpellier et al. The desired consumption levels of sugar cane (1977), where the voluntary consumption index was were not achieved but the actual levels were lower lower when the stalks were chopped in pieces larger than planned. DM was fed in excess, more than than 2 cm. Silvestre et al. (1976) studied treatments 200% of the consumption, and when there was a consisting of chopping sugar cane stalk coarsely choice the goats evidently preferred the other feeds. (1–2-cm pieces) or finely (less than 0.5 cm) and There was some difference in the intake values for chopped cane tops into 4–5-cm lengths, and there the growth trial and the digestibility trial, but it was a suggestion that feed intake was higher with the should be pointed out that the intake values in the coarse chopping. The sugar cane in this experiment digestibility trial are based on fewer animals and a was cut manually, but when a machine is used there shorter period of time than the growth trial, which is normally a distribution of particle sizes and it may could explain the differences.
AOAC, 1985. Official Methods of Analysis, 12th Edition. As-in beef and dairy cattle diets at 30–55% of diet DM
sociation of Analytical Chemists, Washington, DC, 957 pp. was economically viable with regard to average daily
Ashok, M.P., Wadhwani, K.N., 1992. Feed-lot Performance of gain and milk production. It should, however, be Marwari Kids On Rations With Varying Proportion of Concen-stressed that it is possible to feed a diet where the trate and Roughages. Recent Advances in Goat Production. In: International Conference on Goats, March 1992 New Delhi, pp. roughage consists of whole sugar cane only, but the
835–838. growth will probably be lower even if the lack of
Castle, M.E., Retter, W.C., Watson, J.N., 1979. Silage and milk protein is compensated for, because of the lower production, comparisons between silages of different chopped digestibility of the fibre in sugar cane. lengths. Grass Forage Sci. 34, 293–301.
Devendra, C., McLeroy, G.B., 1982. Nutrient requirements of goats. In: Goat and Sheep Production in the Tropics. Longman Group, Singapore, pp. 61–68.
5. Conclusion Ffoulkes, D., Preston, T.R., 1979. Effect on voluntary intake and
digestibility of supplementing chopped sugar cane stalk with The results of the present studies indicate that cane tops, banana leaves or cassava forages. Trop. Anim. Prod.
4, 37–41. there are no important differences between the
Forbes, J.M., 1995. Selection within a single food. In: Voluntary different methods used in this study for processing
Food Intake and Diet Selection in Farm Animals. CAB sugar cane leaves and tops. None of these processes International, Wallingford, UK, pp. 289–292.
appears to have any significant effect on voluntary Gherardi, S.G., Kellaway, R.C., Black, J.L., 1992. Effect of forage intake. For cane stalks, however, chopping into small particle length on rumen digesta load, packing density and voluntary feed intake by sheep. Aust. J. Agric. Res. 43, 1–3-cm slices improved feed intake compared to the
1321–1336. other cutting methods.
Gupta, H.K., 1992. Growth Performance and Nutrient Utilization The different rates of inclusion of CWSC had no in Sikkim Local Vs Sikkim Local3Barbari Crossbred Goat effect on DM intake which was between 3.3 and Kits. Recent Advances in Goat Production. In: International 3.6% of BW. The actual levels of intake of CWSC Conference on Goats, March 1992 New Delhi, pp. 835–838.
Islam, M., Chowdhury, S.A., Alam, M.R., 1997. The effect of was lower than planned showing that when fed in
supplementation of Jackfruit Artocarpus heterophyllus and excess the goats preferred the other feeds before
Mashkalai Vigna mungo bran to common grass on the per-sugar cane. formance of goats. Asian-Aust. J. Anim. Sci. 10 (2), 206–209. Using CWSC for feeding growing goats at 23% of McDonald, P., Edwards, R.A., Greenhalgh, J.F.D., 1992. In: DM of the diet gave the best growth rate (64.6 Animal Nutrition, 4th Edition. Longman Scientific & Technical
Publications, Harlow, pp. 142, 201–203, 375–376. g / day), and the best FCR and increased live weight
Minitab Software, 1994. Minitab Inc. Pennsylvania State College, gain by 41% in comparison with a pure GG diet.
PA 16801, USA, Release 10.2
Montpellier, F.A., Vadez, R.E., Preston, T.R., 1977. Processing of sugar cane: effect of derinding and coarseness of chopping on animal performance and rumen fermentation. Trop. Anim.
Acknowledgements
Prod. 2, 206–212.
McSweeney, C.S., Kennedy, P.M., 1992. Influence of dietary The authors wish to thank the Swedish Interna- particle size on chewing activity and reticulo-rumen motility in tional Development Co-operation Agency (Sida) and goats and sheep fed wheaten (Triticum aestivum) hay. Small the Ministry of Agriculture in Vietnam for financing Ruminant Res. 9, 107–115.
Mui, N.T., 1993. Economic evaluation of growing elephant grass, the present study. Thanks are also due to the Goat
guinea grass, sugar cane and cassava as animal feed or for cash and Rabbit Research Centre, Hatay and the National
on Bavi high land. In: Sustainable Livestock Production on Institute of Animal Husbandry, Hanoi, Vietnam and Local Feed resources. Agricultural Publishing House, Ho Chi to the Swedish University of Agricultural Sciences, Minh City, pp. 16–19.
Uppsala, Sweden for their help and facilities. Mui, N.T., Preston, T.R., Ohlsson, I., 1996. Response of Four Varieties of Sugar Cane to Planting Distance and Mulching. M.Sc. Thesis, Swedish University of Agricultural Sciences, P.O. Box 7024, 750 07 Uppsala, Sweden, 53 pp.
References Neckles, F.A., 1988. Experiences with whole sugar cane feeding
in Trinidad and Tobago. Sugar cane as feed. FAO. Anim. Prod. Health Paper 72, 83–92.
AFRC, 1998. Feed intake. Handbook of the Nutrition of Goats.
Neckles, F.A., Garcia, G.W., Benn, A., 1984. Sugar Cane: A AFRC Technical Committee on Responses to Nutrients, Report
New Technologies in Food Production. In: Proceeding of Shaer, H.M., Kandil, H.M., Khamis, H.S., Abou El Nasr, H.M., seminar, St. Augustine (Trinidad and Tobago), pp. 117–123. 1996. Alternative feed supplement resources for sheep and Osafo, E.L., Owen, E., Said, A.N., Gill, M., Sherington, J., 1997. goats in Egypt. In: Lindberg, J.E., Gonda, H., Ledin, I. (Eds.).
´ Effects of amount offered and chopping on intake and selection Recent Advances in Small Ruminant Nutrition. Options
Medit-´ ´
of sorghum stover by Ethiopian sheep and cattle. Anim. Sci. erranenne, Serie A, no. 34, pp. 93–97.
65, 55–62. Shoo, R.A., 1990. Growth rate, feed intake and feed utilization of Peacock, C., 1996. The feeding habits of goats. In: Handbook of small East African goats supplemented with Leucaena
Improving Goat Production in the Tropics. A Manual for leucocephala. Small Ruminant Res. 3, 9–18.
Development Workers. Oxfam, UK, pp. 65–90. Silvestre, R., Macleod, N.A., Preston, T.R., 1976. Animal per-Perez, I.F., Garcia, V.R., 1975. Sugar cane for cattle feeding in dry formance and rumen fermentation with sugar cane chopped
season. Effect of urea doses on feed intake and milk production finely or coarsely. Trop. Anim. Prod. 1, 86–92. of dairy cows. Cuban J. Agric. Sci. 9, 105–108.