This paper has been presented at International Seminar on Innovation in Mathematics and Mathematics Education 1st ISIM-MED 2014 Innovation and Technology for Mathematics and Mathematics
Education Department of Mathematics Education,Yogyakarta State University Yogyakarta, November 26-30, 2014
E
–
54
Implementation Of Project Based Learning As An Effort To Improve
Student’s
Strategic Competence And Productive Dispotition
Erni Nuraeni, Rahayu Kariadinata, Iyon Maryono
Studi Program of Mathematics Education, State Islamic University- Bandung
Jl. A.H. Nasution No.105 Cibiru -Bandung
Abstract
This study aimed to obtain objective information regarding: the mathematical description of the learning process with the PjBL model of task group project and the PjBL model of task paired project; differences increase the achievement of mathematical strategic competence and of students by using the PjBL model of task group project, the PjBL model of task paired project and conventional learning models; and productive disposition impact on the students learning by using the PjBL model of task group project and the PjBL task paired project. The results of this study are: 1) the process of learning by using the PjBL model of task group project and the PjBL model of task paired project has increased in each meeting with their respective percentage of the activity of teachers and students at the first meeting and the second meeting consecutive 80%, 90% and 70 %, 90%. 2) There are the differences in the mathematical strategic competence improvement among the students who use the PjBL model of task group project with the PJBL model of task paired project, and there are the differences in the mathematical strategic competence improvement among the students who use the PjBL model of task group project with the conventional learning. (3) There are the differences between the mathematical achievements in the strategic competence of students who use the PjBL model of task group project with the conventional learning. (4) The impact of productive disposition toward students by using PjBL model of task group project and using the PjBL model of task paired project are positive and good impact on student’s grades.
A. Introduction
Education is an important role that is contained within a nation. Success or failure of a nation can be seen from the education of its citizens. Education in Indonesia is still relatively weak, it is because of the weakness of the learning process is carried out. The learning process in the classroom is more likely to be directed to memorize the information, do not understand the information to be associated with everyday life.
Actually, students do not think about the study of mathematics in the classroom will have a close relationship with daily life. In addition, the lack of interest and seriousness of students in learning mathematics due to lack of a view of the importance of mathematics in everyday life, making negative attitudes arise in students. The forms of these negative attitudes constrain the success of students in learning mathematics. It can be said that the ability of mathematical disposition is still lacking, so it needs to be fostered positive attitudes and habits to see math as useful in everyday life. The word disposition in terms is commensurate with the attitude. Mathematical disposition have that sense of respect for the usefulness of mathematics in life, an attitude of curiosity, attention, and interest in learning math, and tenacious attitude and confidence in solving problems (Syaban, 2009: 129). Also called productive mathematical disposition (disposition) (attitude productive), namely the growth of positive attitudes and habits to see mathematics as something logical, useful and beneficial.
International Seminar on Innovation in Mathematics and Mathematics Education
1st ISIM-MED 2014 Department of Mathematics Education,Yogyakarta State University,Yogyakarta,
November 26-30, 2014
EP-462
that can help students understand mathematics is: conceptual understanding, procedural fluency, strategic competence, adaptive reasoning, and productive disposition.
Mathematical skills which consists of five sections that can’t be separated because it is a unified whole that can improve students' understanding, for example, the ability of the strategic competence of the students would not be good, if it is not supported by the ability of understanding the concept (conceptual understanding) first. However, in this study will be more emphasis on the strategic competence and productive disposition alone. Strategic competence is the ability to formulate, present, and solve mathematical problems. From the definition of strategic competence can be seen that students are expected to present a problem mathematically in any form including numeric, symbols, oral, or graphic.
The learning process is carried out emphasizing the theoretical aspects of the exploration done by making the forms of representation or students doing the real tasks. By the various existing learning models, one model of learning that is a model to approach the concept of Project Based Learning (PjBL), because in principle there is a PjBL model of constructive investigation, constructivism, problem solving, inquiry-sets, integrated studies and reflections that can improve strategic competence of students.
The principle of constructive investigation may improve the ability to formulate and to design a problem-solving knowledge, the principles of constructivism and inquiry-set can improve the ability to show the issues in a variety of forms, as well as the principles of problem solving and integrated studies can enhance students' problem solving abilities. So the ability to formulate, to present, and to solve the problems in strategic competence can be resolved.
According to Koch, Chlosta, & Klandt (Rais, 2010: 2) one of the things that is interesting is why it is important to apply PJBL is shown by several studies that preceded it. The results showed that 90% of students who follow the learning process with the implementation of PJBL confident and optimistic to implement the PJBL in the world of work and to improve their academic achievement.
1. Lesson with PJBL Model
In The George Lucas Educational Foundation (Sutirman, 2013: 46) PjBL steps are: Start with the essential questions, making the design of the project plan, schedule, and monitor student progress of the project, assess the results, and reflections. As for the explanation as follows:
a) Phase 1: Start with the essential question
International Seminar on Innovation in Mathematics and Mathematics Education
1st ISIM-MED 2014 Department of Mathematics Education,Yogyakarta State University,Yogyakarta,
November 26-30, 2014 EP-463
b) Phase 2: Create a project plan design
Students create a design plan of the project to be carried out in accordance with the framework of the project has been given by the teacher. In making the design of the project, students complete these steps to make the project work and the division of labor. Students work both in groups and in pairs to obtain a series of activities or steps that will be implemented during the project implementation.
c) Phase 3: Creating a schedule
In addition to making the steps of the project, students would make the project implementation schedule and plan the processing time. Students who worked with the group must comply with the rules that have been agreed within the group, because if there is not proper in the execution of the tasks of other projects will be hampered.
d) Phase 4: Monitor the progress of students and projects
In this phase, students carry out a project with the results of previous planning. Activities undertaken at this stage is an investigation and presentation of the project. Investigations were carried out could be to ask the experts, to exchange experiences with discussions, and so on. As for the stage presentation can be done by reporting or presentation. Presentation of the results may include images, graphs, diagrams, mathematical mapping, and others.
e) Phase 5: Assessing the results
Teachers assess all students work on the preparation, execution, until the results of the project based on productivity during the project implementation. If there is a real product that is produced, the product that was the subject of assessment for teachers.
f) Phase 6: Reflection
At this stage the teacher and the students reflect on the activities and the results of the project was run. Things that are reflected are the difficulties encountered and how to overcome them and feeling that is felt at the time to find the solution of the problems encountered. If necessary the other group was asked to respond.
B. Problem Formulation
1) How does the process of mathematics learning by using the PjBL model of task group project and the PjBL model of task paired project task group? 2) Is there a difference in improving the strategic competence of students who
use mathematical learning by using the PjBL model of task group project, the PjBL model of task paired project and conventional learning?
International Seminar on Innovation in Mathematics and Mathematics Education
1st ISIM-MED 2014 Department of Mathematics Education,Yogyakarta State University,Yogyakarta,
November 26-30, 2014
EP-464
4) How the impact of the use of the PjBL model task group project and the PjBL model task paired project in productive disposition towards mathematics learning of students ?
C. Methods and Research Design
This study was conducted by using experimental method and quasi-experimental design Nonequivalent control group design type as shown in Table 1 below :
Table 1 Design Research
Group Pre test Treatment Post test
Experiments I O X1 O
Experiments I O X2 O
Control O O
(Sugiyono, 2010: 11) Specification:
O = Pre-test and Post test
X1 = Learning PjBL model group project assignment. X2 = Learning with PjBL model of project tasks in pairs.
1. Determining Population and Sample
This research was conducted at SMP 2 Cileunyi. Method of sampling used was cluster sampling technique. By doing the above technique derived class the following provisions:
a) Class VIII-B as a control class with conventional learning models.
b) Class VIII-C as the first experimental class learning model PjBL group project assignment.
c) Class VIII-D as an experimental class II with PjBL learning model of project tasks in pairs.
2. Research Instrument a. Observation sheet
To measure the activity of students and teachers in the mathematics learning activities that is observation sheets. The Aspects will be observed by the observer is the role of the teacher, the role of the students, the student interaction, and the teacher interactions during learning activities takes place.
b. Test
Researchers will conduct tests twice: the initial test (pretest) and final test (posttest). About the form of the test used in the form of strategic competence description consists of 7 questions with details about an easy 2, 3 and 2 about the matter being difficult.
c. Productive Disposition Scale Sheet
International Seminar on Innovation in Mathematics and Mathematics Education
1st ISIM-MED 2014 Department of Mathematics Education,Yogyakarta State University,Yogyakarta,
November 26-30, 2014 EP-465
with consists of 10 positive statements and 10 negative statements. According to Suherman (2003: 189), the Likert scale, respondents were asked to read each statement carefully presented, then asked to rate these statements. Assessment of the statements is subjective nature.
D. Results and Discussion
1. Pre Test Data Analysis
Based on the analysis of data normality test pre-test data obtained as follows: a. Normality Test Data Pre Test
From the results of normality data of pre-test score was obtained from the data as follows:
Table 3 Results of Normality Test Data Pre Test Students Model
If the Sig. < 0.05, the data distribution is not normal If the Sig. > 0:05, then the data were normally distributed
Based on the Table 3 note that all the data students' pre-test experimental class I, class II and control experiments with normal distribution.
b. Homogeneity of Variance Test Pre Test
To determine the homogeneity of the population variance is followed by the parametric statistical test of homogeneity test with SPSS 16.
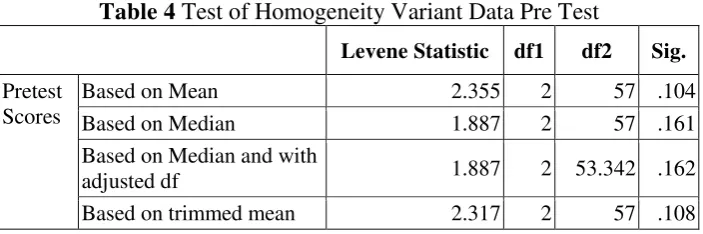
Table 4 Test of Homogeneity Variant Data Pre Test
Levene Statistic df1 df2 Sig.
International Seminar on Innovation in Mathematics and Mathematics Education
1st ISIM-MED 2014 Department of Mathematics Education,Yogyakarta State University,Yogyakarta,
November 26-30, 2014
EP-466
In Table 4 it appears that Levene Statistics Base on the Mean is 2.355 with a probability score (Sig) is 0.104 0.05. Thus the score of the data variance pre-test in the third graders experiment I, experiment II and the control of the same class (homogeneous).
2. Improved Strategic Competence Data Analysis Math Students
a. Data Normality Test Gain
The results of the normality test using SPSS 16 is presented in Table 5 below.
Table 5 Results of Normality Test Gain Index
Class Kolmogorov-Smirnov Shapiro-Wilk Statistic df Sig. Statistic df Sig.
Experiments I .107 21 .200 .946 21 .290
Experiments II .091 20 .200 .946 20 .631
Control .132 19 .200 .970 19 .784
Guidelines for decision-making
If the Sig. Of <0.05, the data distribution is not normal If the Sig. > 0:05, then the data were normally distributed
Based on Table 5 it appears that the score of the Kolmogorov-Smirnov sig for experimental class I class II and class control experiments respectively 0,200; 0,200 and 0,200, while the Shapiro-Wilk is 0.290; 0.631 and 0.784. Because of the sig> 0.05 then the index gain for Experimental Class I, class II and class control experiments with normal distribution.
b. Testing the Homogeneity of Variance Gain
The following data homogeneity test results of the calculation are presented in Table 6.
Table 6 Test of Homogeneity of Variance Index Gain Levene Statistic df1 df2 Sig.
Based on Mean 2.024 2 57 .142
Based on Median 1.987 2 57 .146
Based on Median and with adjusted df 1.987 2 49.710 .148
Based on trimmed mean 2.038 2 57 .140
Basis for decision making:
If the probability 0.05 so, the variance of the three groups are the same. If the probability 0.05 so, the variance of the three groups are not the same.
International Seminar on Innovation in Mathematics and Mathematics Education
1st ISIM-MED 2014 Department of Mathematics Education,Yogyakarta State University,Yogyakarta,
November 26-30, 2014 EP-467
Ho: There are no differences between the mathematical competences of strategic improvement of student learning model that uses the PJBL task group project, the PJBL task paired project and the conventional learning.
Ha: There are differences in the strategic improvement of mathematical competence among students who use learning model PJBL group project assignment, project pairs and conventional learning.
Here are descriptions test of the data using SPSS 16 is presented in Table 7
Table 7 Gain Index Calculation ANOVA
Sum of Squares df Mean Square F Sig.
Between Groups .513 2 .257 6.697 .002
Within Groups 2.185 57 .038
Total 2.699 59
Basis for decision making:
If the probability (sig.) > 0.05 then Ho is accepted If the probability (sig.) 0.05 then Ho is rejected
Based on Table 7, the result show that the calculated of F score is 6.697 with probability (sig.) is 0.002. Because the probability of < 0.05 then Ho is rejected and Ha accepted. In other words, there is a difference of strategic capacity building mathematical competence between the first graders are learning experiment with the PJBL model of task group, the experiments class with the PJBL model of task paired project and control class with the conventional learning model.
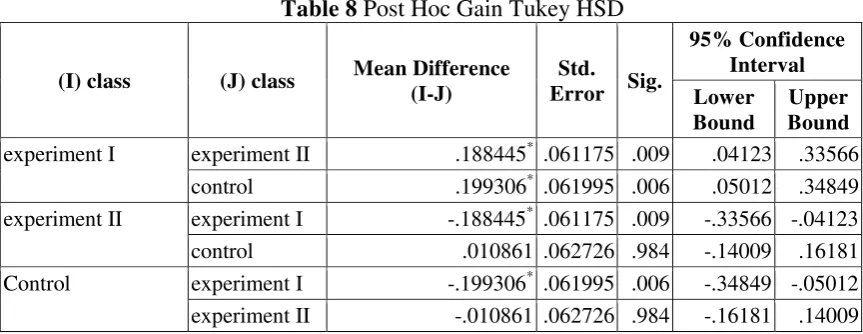
To see an increase in the most effective (both) of these three learning models using SPSS 16 used Turkey analysis that looks into the Post Hoc Test are presented in Table 8.
International Seminar on Innovation in Mathematics and Mathematics Education
1st ISIM-MED 2014 Department of Mathematics Education,Yogyakarta State University,Yogyakarta,
November 26-30, 2014
EP-468
From the Table 8 obtained the Sig. namely 0.006, because 0.006 < 0.05 then Ho is rejected and Ha accepted. So it can be concluded, that there are differences in the strategic improvement of mathematical competence among the students by using the PJBL model of task group project with conventional learning.
From the Table 8 obtained the Sig. namely 0.984. Because of 0.984 > 0.05 then Ho is accepted. So it can be concluded that there is no difference between the increases in strategic mathematical competence of students by using the PJBL model of task paired project with conventional learning.
3. Data Analysis of Student Mathematics Achievement of Strategic Competence
a. Data Normality Test Post Test
Normality test of mathematical achievement of the strategic competence of students from all three groups using SPSS 16 is presented in Table 9 below.
Table 9 Results of Normality Test Post Test Data
Learning Model
Kolmogorov-Smirnova Shapiro-Wilk
Statistic df Sig. Statistic df Sig.
Experiments I .149 21 .200 .922 21 .097
Experiments I .121 20 .200 .966 20 .679
Control .178 19 .117 .948 19 .370
Guidelines for decision-making
If the Sig Of <0.05, the data distribution is not normal If the Sig > 0:05, then the data were normally distributed
Based on the Table 9, it appears that the score of the Kolmogorov-Smirnov sig for experimental class I, class II and class control experiments respectively 0,200; 0,200; and 0,117, while the Shapiro-Wilk 0.097; 0.679; and 0.370. Because the sig> 0.05 then the data post-test for experimental class I, class II and class control experiments with normal distribution.
b. Homogeneity of Variance Test Post Test Data
Homogeneity of variance test performed by using SPSS 16 The following data are the results of the homogeneity test calculations are presented in Table 10.
Table 10 Test of Homogeneity Variant Data Post test
Levene Statistic df1 df2 Sig.
Based on Mean 1.215 2 57 .304
Based on Median .864 2 57 .427
Based on Median and with adjusted df .864 2 48.615 .428
Based on trimmed mean 1.102 2 57 .339
Basis for decision making:
If the probability 0.05 then the variance of the same three groups
International Seminar on Innovation in Mathematics and Mathematics Education
1st ISIM-MED 2014 Department of Mathematics Education,Yogyakarta State University,Yogyakarta,
November 26-30, 2014 EP-469
In Table 10 it appears that Levene Statistics Base on the Mean is 1.215 with a probability score (Sig) is 0.304 0.05. Thus the score of the data variance of the third grade students post test experiment class I, class II and conventional experiments the same (homogeneous).
When analyzed with SPSS 16 output is obtained as shown in Table 11.
Table 11 Calculation of ANOVA Post Test
Sum of Squares df Mean Square F Sig.
Between Groups 2548.894 2 1274.447 4.138 .021
Within Groups 17553.439 57 307.955
Total 20102.333 59
Based on the Table 11, it appears that the calculated F score is 3.646 with probability (sig.) is 0.021. Because the probability of <0.05 then Ho is rejected and Ha accepted. In other words, there is a difference competence mathematical achievement of strategic capabilities between the first grades of students who are learning in experiment class I, with the PJBL model of task group project, students who are learning in experiments class II, with the PJBL model of task paired project and control class students who studied with the conventional learning models.
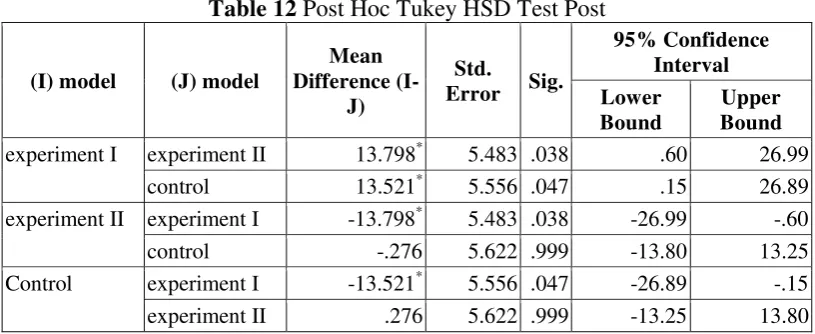
To see the achievement of the most effective (both) of these three learning models using SPSS 16 used Turkey analysis can be seen in the Post Hoc Test are presented in Table 12.
Table 12 Post Hoc Tukey HSD Test Post
(I) model (J) model
From the Table 12 in the first row got the Sig. ie 0,038, as 0,038> 0.05, then Ho is accepted so it can be concluded that there is no difference between the mathematics achievements of the strategic competence by using the PJBL model of task group project task group with the PJBL model of task paired project.
International Seminar on Innovation in Mathematics and Mathematics Education
1st ISIM-MED 2014 Department of Mathematics Education,Yogyakarta State University,Yogyakarta,
November 26-30, 2014
EP-470
achievement between students' strategic competence learning using the PJBL model of task group project and the conventional learning.
From the Table 12, obtained the Sig. namely 0.999, because 0.975> 0.05 then Ho is accepted So it can be concluded, that there is no difference between the mathematics achievement of strategic competence using the PJBL model of task paired project with conventional learning.
4. Data Analysis Observations
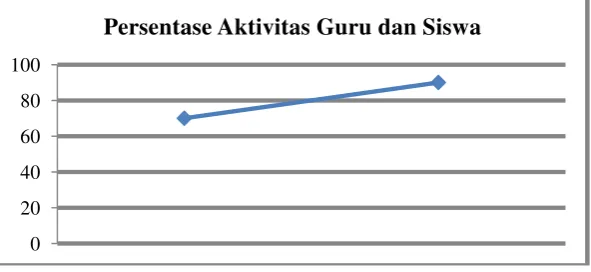
a. The Activity of Teacher Observation Sheet and Student in Experiments Class I The results of the analysis of the data obtained by observation sheet activity percentages of teachers and students in the experimental class I as shown in the following chart.
Figure 1 graphs the percentage Activity Teacher and Student Class Experiments I
In Figure 1 show that the graph has increased in every meeting. Every meeting showed that the activity of teachers and students to increase learning in the classroom using the PJBL model of task group project.
b. The Activity of Teacher Observation Sheet and Student in Experiment Class II From the analysis of teachers' observation sheets and student activity, the data obtained percentage of the activity of the teacher and the students in the experimental class II as shown in the following chart.
Figure 2 Graph Percentage Activities of Teacher and Student Class Experiments II
75 80 85 90 95
Percentage of Teachers and Student Activity
0 20 40 60 80 100
International Seminar on Innovation in Mathematics and Mathematics Education
1st ISIM-MED 2014 Department of Mathematics Education,Yogyakarta State University,Yogyakarta,
November 26-30, 2014 EP-471
In Figure 2, it appears that the graph has increased at every meeting, every meeting showed that the activity of teachers and students to increase learning in the classroom using the PJBL model of task paired project.
5. Analysis of the Students Productive Disposition
Based on the analysis of scale productive disposition, it is known that the average attitude scores of students by using the PJBL model of task group project in learning mathematics is 2.92. While the average scores of the students’ attitude by using the PJBL model of paired project towards the learning of mathematics is 2.686.
E. Closing
1. Conclusion
Based on the result of this research, it can be concluded that:
1) the process of learning by using the PjBL model of task group project and the PjBL model of task paired project has increased in each meeting with their respective percentage of the activity of teachers and students at the first meeting and the second meeting consecutive 80%, 90% and 70 %, 90%.
2) There are the differences in the mathematical strategic competence improvement among the students who use the PjBL model of task group project with the PJBL model of task paired project, and there are the differences in the mathematical strategic competence improvement among the students who use the PjBL model of task group project with the conventional learning.
3) (3) There are the differences between the mathematical achievements in the strategic competence of students who use the PjBL model of task group project with the conventional learning.
4) (4) The impact of productive disposition toward students by using PjBL model of task group project and using the PjBL model of task paired project are positive and good impact on student’s grades.
2. Suggestion
Based on the results of the research, discussion, and conclusions above, so this research suggested for teacher and other researchers.
1) For teachers, it is suggested for the teachers that should be able to choose a project that really fit with the ability of junior high school students and the selection of projects that can be useful and fun for students.
International Seminar on Innovation in Mathematics and Mathematics Education
1st ISIM-MED 2014 Department of Mathematics Education,Yogyakarta State University,Yogyakarta,
November 26-30, 2014
EP-472
Bibliography
Kilpatrick, J. Swafford, J., & Findell, B. 2001. Adding It Up: Helping Children Learn Mathematics. Washington, DC : National Academy Press.
Rais, Muh. 2010. PROJECT-BASED LEARNING: Inovasi Pembelajaran yang Berorientasi Soft skills. National Seminar on Technology and Vocational Education Faculty of Engineering, State University of Surabaya. not Published Sugiyono .2010. Statistika untuk Penelitian. Bandung: Alfabeta.
Suherman, Erman. 2003. Evaluasi Pembelajaran Matematika. Bandung: JICA UPI. Not published.
Sutirman. 2013. Media & Model-model Pembelajaran Inovatif. Yogyakarta: Graha Ilmu.