Summary Carbon dioxide exchange in fruits of Cin-namomum camphora Sieb. was followed over a growing season from July to December 1992. Dark respiration was exponen-tially related to temperature, with a Q10 value near 2. Light dependence of photosynthetic CO2 refixation, i.e., the ratio of gross photosynthesis to dark respiration, was approximated by a hyperbolic function. Seasonal variation in maximum CO2 refixation capacity ranged between 52 and 174%, reaching a maximum in early August. Daily photosynthetic CO2 refixation ranged between 17 and 51% over the growth period. We evaluated seasonal variation in translocation rate to the fruit on the basis of the seasonal rates of gross photosynthesis, dark respiration and increase in fruit dry weight, and used the results to develop a simple carbon flow model of fruit development. Seasonal changes in translocation rate paralleled those in fruit growth rate, with two peaks during the periods before and after September. Seed formation took place in the period between the two peaks. The relationship between fruit growth rate and translocation rate was approximated by a linear function. The carbon flow model estimated that, over the reproductive period, the amount of assimilate translocated to each fruit was 377.2 mg dry weight, of which 58.5% was accounted for by weight growth and 41.5% was consumed by net respiration. Carbon dioxide refixation accounted for 22.9% of the carbon balance of the fruit.
Keywords: carbon flow balance, fruit development, photosyn-thetic CO2 refixation, translocation.
Introduction
There are several reports describing the occurrence of photo-synthesis in reproductive tissues of various tree species (Dick-mann and Kozlowski 1970, Rook and Sweet 1971, Bazzaz et al. 1979, Linder and Troeng 1981, Koppel et al. 1987, Ogawa et al. 1988, Whiley et al. 1992). These studies suggest that the photosynthetic contribution of developing fruits to their own dry matter demands is significant. However, it has also been reported that fruiting depresses tree growth (Eis et al. 1965, Tappeiner 1969, Teich 1975, Ogawa et al. 1988), which implies that carbohydrates are translocated from other organs for the production of fruits. Early studies showed that develop-ing fruits preferentially mobilize current photosynthate in
leaves (Dickmann and Kozlowski 1968, Rook and Sweet 1971).
Although translocation plays an important role in fruit growth and seed formation, the process is poorly understood. Quantitative analysis of translocation to fruits could help elu-cidate the physiological controls on the regulation of distribu-tion and translocadistribu-tion of photosynthates within the tree.
We followed the time course of CO2 exchange in fruits of Cinnamomum camphora Sieb. over an entire growing season and developed a simple carbon flow model from the results. The model estimates daily and seasonal translocation of pho-tosynthates to a fruit. A quantitative relationship between translocation and dry weight increment of a fruit was also derived.
Materials and methods Plant material
Between 31 and 42 fruits from a Cinnamomum camphora tree growing on the campus of Nagoya University were sampled on 11 occasions between July 11 and December 29, 1991. In December 1991, the height of the sample tree was 11.0 m and stem diameter at breast height was 29.3 cm. The tree flowered in early June, fruited in early July, and dropped all fruits in late December.
Measurements
Rates of CO2 exchange were measured in an open gas-ex-change system with an infrared gas analyzer (URA-2S, Shi-madzu, Kyoto, Japan). Air was stored in an air bag and supplied to the assimilation chamber at a rate of 0.5 l min--1. The CO2 concentration in the air averaged 392.1 ± 13.6 (SD) ppm throughout the experimental period.
The assimilation chamber was immersed in a thermoregu-lated water-bath with 1.5-cm layer of water above the chamber surface. Chamber air temperature was maintained by circulat-ing air through copper tubes in the water-bath, with the desired temperature being maintained by means of a temperature con-troller (TE-106S, Toyo, Chiba, Japan). Air temperature in the assimilation chamber was measured with a copper-constantan thermocouple. Air temperature inside the chamber was
ad-Seasonal courses of CO
2
exchange and carbon balance in fruits of
Cinnamomum camphora
KAZUHARU OGAWA
1and YOSHINORI TAKANO
1,21
Section of Forest Ecophysiology, School of Agricultural Sciences, Nagoya University, Chikusa-Ku, Nagoya 464-01, Japan
2 Present address: Department of Forestry, Fukuoka Pref., Fukuoka 807, Japan
Received August 21, 1995
justed to the mean air temperature in the field at the beginning of each measurement day. Mean air temperature in the field varied from 11.0 to 29.9 °C during the measurement period from July to December.
Light was provided by two 500-W incandescent flood lamps, and a 1.0-cm thick water filter was placed between the lamps and the assimilation chamber to absorb excess infrared radiation. Various photon flux densities were achieved by changing the voltage supplied to the lamps. The photon flux density (PFD) on the outside top surface of the chamber (PFDo,
µmol m--2 s--1) was measured with a quantum sensor (LI-190SA, Li-Cor, Inc., Lincoln, NE), and PFD inside the assimi-lation chamber (PFDi, µmol m--2 s--1) was calculated from the equation: PFDi = 0.908 PFDo0.999 (determination coeffi-cient = 1.00). In addition, daily irradiance outdoors beside the experimental tree was measured with a photometric sensor having a spectral sensitivity in the range of 400 to 680 nm (IKS-15, Koito, Tokyo, Japan) (Hagihara et al. 1987).
Fruits with attached peduncles were removed from the tree and taken immediately to the laboratory where the end of each peduncle was recut under distilled water. The peduncles were placed in vials containing distilled water. For each CO2 meas-urement, there were between 31 and 42 fruits in the assimila-tion chamber.
Photosynthetic response to light was determined by measur-ing CO2 exchange at eight PFDi values in the range of 25 to 800 µmol m--2 s--1. Photosynthetic CO2 refixation ( p , %), was calculated as the difference between CO2 release measured in the light and CO2 release measured in the dark (Linder and Troeng 1981, Koppel et al. 1987). Dark respiration was meas-ured at the same temperature as the photosynthetic measure-ments. The dark respiration response to temperature was assessed by measurements at six temperatures, from 10 to 35 °C.
After the CO2 exchange measurements, fruit diameters were taken, and fruit dry weights were measured after oven-drying at 85 °C for 24 h. The dry matter/CO2 conversion factor was assumed to be 0.614 (C6H10O5/6CO2) (Yoda 1983, Mariko and Koisumi 1993). Beginning in August, chlorophyll concentra-tion of the fruits was determined spectrophotometrically by a modification of the method of Mackinney (1941).
Results
Diameter and dry weight growth
Fruit diameter increased until reaching 9 mm in late Septem-ber. Fruit dry weight increased linearly before leveling off between late November and late December (Figure 1). The period of dry weight increase was about 2 months longer than the period of diameter growth, because diameter growth ceased at the onset of seed formation in September.
Temperature dependence of dark respiration
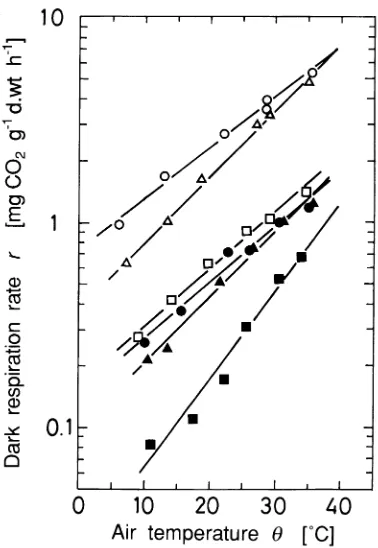
Dark respiration rate (r, mg CO2 gdw--1 h--1) was linearly related to air temperature in the assimilation chamber (θ, °C) when plotted on semi-log coordinates (Figure 2). The regression line was given by an exponential function,
Figure 1. Time course of mean dry weight and diameter growth of
C. camphora fruits. Vertical bars indicate ± SD.
Figure 2. Dependence of dark respiration rate (r) on air temperature inside the assimilation chamber (θ), in C. camphora fruits. The lines fit the expression: r = r0 exp (kθ) (Equation 1), where the determina-tion coefficient ranged from 0.95 to 0.99. Symbols: s, July 11; n, August 19; h, September 14; d, October 14; m, November 20; and
r = r0 exp(kθ), (1)
where r0 and k are coefficients.
The Q10 value (Q10 = exp(10k)) for r ranged from 1.58 to 2.11 during the experimental period, except in December when the value increased to 2.7.
Photosynthetic CO2 refixation
The relationship between photosynthetic CO2 refixation (p, %), and PFDi (µmol m--2 s--1) on log-log coordinates satisfied the hyperbolic formula,
p = bPFDi 1 + aPFDi
, (2)
where a and b are coefficients specific to each season (Fig-ure 3). The values of a and b, which did not show clear seasonal changes, were in the range of 23 to 408 µmol m--2 s--1 and 0.44 to 2.35 to µmol m--2 s--1, respectively.
Table 1 shows the seasonal variation in maximum CO2 refixation capacity, pmax, which is equivalent to the asymptote (b/a) in Equation 2. Maximum CO2 refixation capacity varied between 52 and 174%, reaching a seasonal maximum in early August.
Relationship between CO2 refixation capacity and
chlorophyll concentration
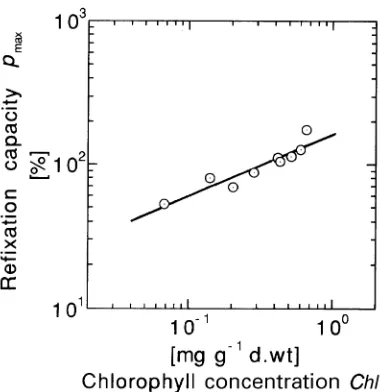
Fruits were green after fruiting, but began to turn purplish-black in mid-November. All fruits were purplish-black after late No-vember. The chlorophyll concentration ranged between 0.0680 and 0.662 mg gdw--1, and decreased as the season progressed (Table 1). The relationship between maximum CO2 refixation capacity (pmax, %) and chlorophyll (Chl) concentration (Fig-ure 4) was approximated by the power function: pmax = 163.1 Chl0.437, indicating that maximum CO2 refixation
capac-ity is roughly proportional to the square root of the chlorophyll concentration.
Daily photosynthetic CO2 refixation
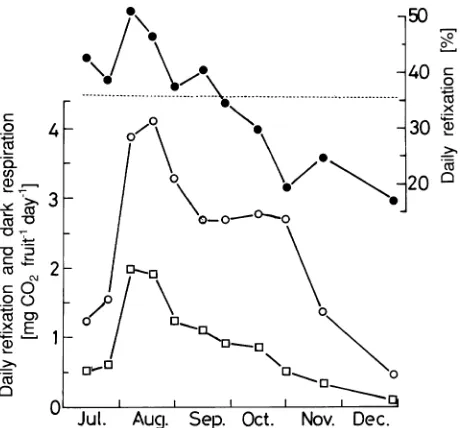
We estimated daily photosynthetic CO2 refixation on the basis of Equation 2. As shown in Figure 5, estimated daily photosyn-thetic CO2 refixation increased during early fruit development, reached a maximum in early July, and decreased toward De-cember. Estimated daily dark respiration was maximal in mid-August and decreased as the season progressed, reaching a
Figure 3. Dependence of photosynthetic CO2 refixation (p) on photon flux density inside the assimilation chamber (PFDi), in C. camphora fruits. The curves fit the expression: p = bPFDi/(1 + aPFDi) (Equa-tion 2). Symbols: s, July 11; n, August 19; h, September 14; d,
October 14; m, November 20; and j, December 29.
Figure 4. Relationship between maximum CO2 refixation capacity ( pm a x) and chlorophyll concentration (Chl) of C. camphora fruits. The line approximates pmax = 163.1 Chl0.437, where the determination coefficient was 0.87.
Table 1. Seasonal variations in maximum CO2 refixation capacity (pmax, %) and chlorophyll concentration (Chl, mg gdw--1) of C.
cam-phora fruits. The relationship between pmax and Chl was pmax = 163.1 Chl0.437.
Refixation capacity Chlorophyll concentration
(%) (mg gdw--1)
July 11 112.1
--July 23 115.1
--August 6 173.7 0.661
August 19 126.3 0.600
August 30 113.3 0.517
September 14 111.3 0.417
September 28 104.6 0.432
October 14 87.3 0.285
October 31 68.6 0.204
November 20 79.9 0.141
constant rate during the period from early September to late October. Daily photosynthetic CO2 refixation expressed as a percentage of daily dark respiration had a maximum of 51% in early August and decreased to a minimum of 17% in late December.
Carbon balance
Net translocation, which is defined as translocation of assimi-lates into a fruit minus assimilate translocation out of the fruit (Hozumi and Kurachi 1991), was estimated from a simple carbon flow model of a fruit before fruit fall. In the model, translocation into fruits from other tree parts (∆Ti, mgdw fruit--1) at a given time interval (∆t, days) was expressed as,
∆Ti=∆r −∆p +∆w, (3)
where ∆r, ∆p and ∆w are dark respiration, photosynthetic CO2 refixation, and dry weight growth of a fruit, respectively.
Sea-sonal trends in r, p and w are shown in Figure 6. Translocation rate (∆Ti/∆t) changed in parallel with the change in growth rate (∆w/∆t), exhibiting two peaks during the periods from early August to late August and from mid-October to late October. Seed formation began in September. Thus, we conclude that the decrease in the rates of ∆Ti/∆t and ∆w/∆t was related to the onset of seed formation. Although the ratio of (∆w/∆t)/(∆Ti/∆t) was more or less constant throughout the growing season, ranging from 53 to 63%, it declined to 42% in December (Figure 6).
The carbon flow model estimated total assimilate transloca-tion to a fruit over the whole reproductive period to be 377.2 mg dry weight, of which 58.5% was distributed to dry weight increment, and the rest was consumed by dark respira-tion (i.e., net respirarespira-tion not refixed by photosynthesis) (Linder and Troeng 1981, Koppel et al. 1987) (Table 2 and Figure 7). The model estimated that 22.9% of the carbon balance of a fruit was obtained by CO2 refixation, which reduced respira-tion loss by 35.6%.
Figure 5. Seasonal variations in daily photosynthetic CO2 refixation (h), dark respiration (s), and daily photosynthetic CO2 refixation expressed as a percentage of daily dark respiration (d) of C. camphora
fruits.
Figure 6. Seasonal changes in daily rates of translocation (∆Ti/∆t), net respiration (∆r/∆t --∆p/∆t), dry weight growth (∆w/∆t), and the ratio of
∆w/∆t to ∆Ti/∆t of C. camphora fruits. The filled circles show the ratio of dry weight growth to translocation for the entire growth period.
Table 2. Translocation estimated on the basis of Equation 3: ∆Ti = ∆r -- ∆p + ∆w over the entire reproductive period from July 11 to December 19,
1991. The dry matter/CO2 conversion factor was assumed to be 0.614 (Yoda 1983, Mariko and Koizumi 1993).
Unit of expression Photosynthetic CO2 refixation Dark respiration Net respiration Dry weight increment Translocation
mgdw fruit--1 86.4 242.9 156.6 220.7 377.2
%1 22.9 64.4 41.5 58.5 100.0
35.62
1 Amount relative to amount of assimilate translocated to the fruit. 2 Photosynthetic CO
Discussion Fruit coloration
Although fruit color changed from green to purplish-black or black, the fruit contained chlorophyll and photosynthesized over the entire growing season. Similarly, Koppel et al. (1987) found that green and purple cones of Picea abies (L.) Karst. had similar chlorophyll concentrations in the cone scales, ranging from 0.2--0.3 mg gdw--1, and similar photosynthetic rates. An analysis of the relationship between maximum CO2 refixation capacity and chlorophyll concentration indicated that fruit photosynthesis is partly regulated by chlorophyll concentration.
Fruit carbon balance
We estimated that maximum daily gain of photosynthetic CO2 refixation in fruit was half of daily dark respiration. This value is high compared with the maximum daily refixations of 40% in Pinus sylvestris L. strobili (Linder and Troeng 1981) and 26--34% in P. abies (Koppel et al. 1987). However, over the entire growth period, photosynthetic CO2 refixation reduced the respiration loss by 36% for C. camphora fruit, which is comparable to the value of 30% for P. sylvestris strobili (Linder and Troeng 1981), but higher than the value of 16--17% re-ported for P. abies (Koppel et al. 1987). The dry weight incre-ment/translocation ratio of 41.5% in C. camphora was lower than the ratios in P. sylvestris (Linder and Troeng 1981) and
P. abies (Koppel et al. 1987), which we calculated to be 66.7% and 60.6--64.2%, respectively, whereas the CO2 fixa-tion/translocation ratio of 22.9% was higher than the corre-sponding ratios in these two species (14.9% and 7.3--7.4%, respectively).
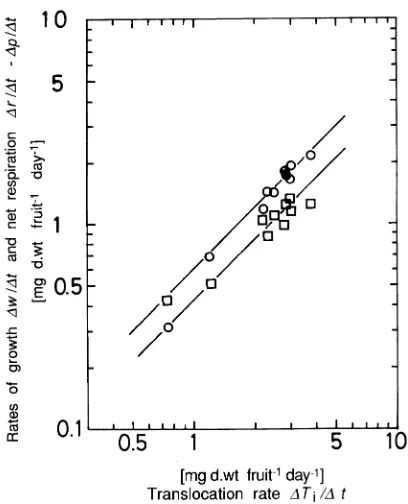
The relationship between ∆w/∆t and ∆Ti/∆t, (Figure 7) fitted the proportionality function,
∆w /∆t = q (∆Ti /∆t), (4)
where q is a coefficient with a value of 0.595. This value shows that over the entire growing season, an average of 59.5% of the photosynthate translocated to the fruit was used for dry weight growth of the fruit and 40.5% was consumed by net respira-tion.
Acknowledgments
We thank Prof. S. Linder, Swedish University of Agricultural Sci-ences, for critical reading of the manuscript and invaluable comments. This work was financed in part by a Grant-in-Aid for Scientific Research (No. 03845040, No. 04856034) from the Ministry of Educa-tion, Science and Culture of Japan.
References
Bazzaz, F.A., R.W. Carlson and J.L. Harper. 1979. Contribution to reproduction effort by photosynthesis of flowers and fruits. Nature 279:554--555.
Dickmann, D.I. and T.T. Kozlowski. 1968. Mobilization by Pinus
resinosa cones and shoots of C14-photosynthate from needles of different ages. Am. J. Bot. 55:900--906.
Dickmann, D.I. and T.T. Kozlowski. 1970. Photosynthesis by rapidly expanding green strobili of Pinus resinosa. Life Sci. 9:549--552. Eis, S., E.H. Garman and L.F. Ebell. 1965. Relation between cone
production and diameter increment of Douglas fir (Psuedotsuga
menziesii (Mirb.) Franco), grand fir (Abies grandis (Dougl.) Lindl.),
and western white (Pinus monticola Dougl.). Can. J. Bot. 43:1553--1559.
Hagihara, A., K. Hozumi and S. Honda. 1987. An apparatus for determining the CO2 gas-exchange of a forest tree in the field. Bull. Nagoya Univ. For. 9:32--36.
Hozumi, A. and N. Kurachi. 1991. Estimation of seasonal changes in translocation rates in leaves of a Japanese larch stand. Bot. Mag. Tokyo 104:25--36.
Koppel, A., E. Troeng and S. Linder. 1987. Respiration and photosyn-thesis in cones of Norway spruce (Picea abies (L.) Karst.). Trees 1:123--128.
Linder, S. and E. Troeng. 1981. The seasonal course of respiration and photosynthesis in strobili of Scots pine. For. Sci. 27:267--276. Mackinney, G. 1941. Absorption of light by chlorophyll solutions.
J. Biol. Chem. 140:315--322.
Mariko, S. and H. Koizumi. 1993. Respiration for maintenance and growth in Reynoutria japonica ecotypes from different altitudes on Mt. Fuji. Ecol. Res. 8:241--246.
Ogawa, K., A. Hagihara and K. Hozumi. 1988. Photosynthesis and respiration in cones of hinoki (Chamaecyparis obtusa). J. Jpn. For. Soc. 70:220--226.
Rook, D.A. and G.B. Sweet. 1971. Photosynthesis and photosynthate distribution in Douglas-fir strobili grafted to young seedlings. Can. J. Bot. 49:13--17.
Figure 7. Relationships between daily rates of dry weight growth (∆w/∆t) (s) and net respiration (∆r/∆t -- ∆p/∆t) (h) and daily translo-cation rate (∆Ti/∆t) of C. camphora fruits. The two lines correspond to: ∆w/∆t = q ∆Ti/∆t (determination coefficient = 0.96) and ∆r/∆t
--∆p/∆t = (1 -- q)∆Ti/∆t, (obtained by substituting Equation 4 in
Tappeiner, J.C. 1969. Effect of cone production on branch, needle, and xylem ring growth of Sierra Nevada Douglas-fir. For. Sci. 15:171--174. Teich, A.H. 1975. Growth reduction due to cone crops on precocious white spruce provenances. Can. For. Serv. Bi-Mon. Res. Notes 31:6.
Whiley, A.W., B. Schaffer and S.P. Lara. 1992. Carbon dioxide ex-change of developing avocado (Persea americana Mill.) fruit. Tree Physiol. 11:85--94.