Territory Management
Key to Productivity
Account Analysis and Time Allocation
•
Single Factor Model: ABC Account Classification
•
Portfolio Models
•
Account Opportunity
•
Competitive Position
•
Decision Models
•
Sales Funnel - complex selling; not straight rebuy
•
Unqualified Opportunity
•
Qualified Opportunity
•
Best Few Opportunities
Territory Management
Key to Productivity
Customer Break-even Analysis
Figure 5-2
What are appropriate strategies for each account?
A
B
C
•
Greater account penetration
•
Sell expanded product mix
•
Consolidate orders
•
Service by phone
•
Concede to competition
Territory Management
Key to Productivity
Breakeven Sales Volume
Territory Management
Key to Productivity
Salesperson Cost per Call
Direct
Selling Expense
Cost per Call =
Total Calls per Year
Total Calls per Year =
A Portfolio Model
Core
Accounts
Accounts are very attractive.
Invest heavily in selling resources.
Core
Accounts
Accounts are very attractive.
Invest heavily in selling resources.
Drag
Accounts
Accounts are moderately attractive.
Invest to maintain current position.
Drag
Accounts
Accounts are moderately attractive.
Invest to maintain current position.
Growth
Accounts
Accounts are potentially attractive.
May want to invest in heavily
Growth
Accounts
Accounts are potentially attractive.
May want to invest in heavily
Competitive Position
Strong
Weak
A
cc
ou
nt
O
pp
or
tu
ni
ty
High
Low
Problem
Accounts
Accounts are very unattractive. Minimal investment of selling resources.
Problem
Accounts
Unqualified
Qualified
Best few
50% closure
probability
75% closure
probability
90% closure
probability
21
13
15
23
22
18
24
20
19
17
16
14
9
12
10
11
8
7
5
6
3
1
2
4
Personal Time Management
Emergencies
Emergencies
Personal
Growth
Personal
Growth
Time
Wasters
Time
Wasters
Recreation
Recreation
Importance
High Low
High
Low
U
rg
Territory Management
Key to Productivity
Industry
Breakeven
Business Services
1,096.37
Chemicals
15,474.67
Construction
9,730.00
Electronics
433.25
Food Products
6,580.00
Instruments
11,629.13
Machinery
1,580.77
Office Equipment
616.67
Printing/Publshing
3,811.61
Personal
Selling
Developing a list of Prospects
1. Direct Inquiry
• Advertising
• Direct Mail
• Trade publications
• Trade shows
2. Directories -- Thomas Register
3. Referrals
Territory Management
Key to Productivity
Minimum Account Size Exercise: Problem 1
$34.50 x 4
.10
= $1.38
Smallest Customer Orders
1 call per month
$345.00
2 calls per month
$690.00
3 calls per month
$1,035.00
Territory Management
Key to Productivity
Time Allocation: Problem 2
Why not allocate calls strictly based on % of sales?
Territory Management
Key to Productivity
Portfolio Analysis: Problem 3
Where do allocation problems seem to occur?
Why might this happen?
•
Salesperson allocating on basis of current competitive
position, not on basis of account opportunity
•
Too much time on low opportunity accounts
•
Best Target: high opportunity, weak competitive cell
•
High opportunity, strong comp may be vulnerable
Territory Management
Key to Productivity
Portfolio Analysis: Problem 3
Possible more productive effort allocation strategy:
Assuming number of Accounts in each cell roughly equal:
High/Strong
36 Calls per year
High/Weak
24 Calls per year
Low/Strong
10 Calls per year
Low/Weak
4 Calls per year
Personal
Selling
Developing a list of Prospects
1. Direct Inquiry
• Advertising
• Direct Mail
• Trade publications
• Trade shows
2. Directories -- Thomas Register
3. Referrals
Personal
Selling
Sample Prospect Profile - Characteristics
• Multiple-practice physician office
• Internal medicine, family practice
• Surburban location
• New practice -- less than 5 years
• Good credit history
Personal
Selling
Qualifying Prospects
1. Needs for your products/services
2. Authority to make purchase
3. Credit rating & ability to pay
Overall
Average
$879,321
$1,499,870
5.5%
-0.9%
Selected Industries:
Drugs/Medicine
$ 445,900
$2,460,000
18.6%
11.4%
Paper
1,392,500
6,250,000
16.2
9.1
Services
158,100
532,118
12.9
6.0
Chemicals
490,000
1,357,462
10.7
4.0
Electronics
665,400
1,880,769
10.9
4.2
Building Materials
1,650,400
1,681,667
0.2
-5.9
Glass Products
1,390,000
512,500
-9.5
-15.0
Tools/Hardware
908,300
1,312,500
3.7
2.6
Sales Per Salesperson
1977
1987
Nominal
Annual
Growth
MINIMUM ACCOUNTS SIZE EXERCISE
You are a rookie salesperson with Associated Medical Supplies, Inc., a wholesaler of disposable medical supplies. As new salesperson you are finding it difficult to convince accounts to change from their current suppliers. The doctors with whom you are having the most success tend to be small, single practices located in the rural areas. Competition for these accounts is not as intense, perhaps because their purchases are fairly small. They usually place about $900 of business with you a month. Nevertheless, they seem to be most appreciative of your coming each week to take inventory of their supplies and write an order. Furthermore, it is better than no sales at all.
Lately your boss has been getting on you because productivity has not increased as much as he had hoped for when placing you in the territory. In particular, direct selling costs including compensation, are currently 15% of sales; whereas the total company’s target is for direct sales costs to be 10% of net sales. In light of this, you are wondering if spending time on small rural physicians is the best way for you to manage your territory. You have calculated that your cost per call is currently $34.50.
Should you be calling on these small physician practices?
What is the smallest size customer you should pursue in order to meet your company’s selling cost objectives?
ABC Account Classification
If equal calls per customer:
% of
% of
ACCOUNT
No. of Total
Sales
Total
Total calls
Sales ($)
CLASSI-
Accts. Accts. (000)
Sales
Per Classif.
Per Call
FICATION
(1)
(2)
(3)
(4)
(5)
(6)
TIME ALLOCATION
As a salesperson for Strength Footwear, Inc., you have been very successful. Your commissions are well over $70,000 a year. Demand for your product line is very strong, but so is the demand on your time. You work your territory 220 days a year and can make 4 calls a day. The maximum number of times you need to see any account is every other week, but you need to call on each account at least once a quarter. To help you allocate your time according to sales results, you have gathered the following information on customer sales:
Accounts Sales Last Year
Top 10 Accounts $150,000
Next 10 best accounts 56,250 Next 10 best accounts 55,500 Next 20 best accounts 37,500 Next 20 best accounts 37,000 Next 20 best accounts 18,750
Last 20 accounts 15,000
$370,000
Develop and justify a call schedule for allocating time across the 110 customers in your territory.
TIME ALLOCATION ANALYSIS
Number Total Percent Percent Sales of Sales of of per Accounts Volume Sales Accounts Account
10 $150,000 40.5% 9% $15,000
10 56,250 15.2 9 5,625 10 55,500 15.0 9 5,550 20 37,500 10.1 18 1,875 20 37,000 10.0 18 1,850 20 18,750 5.1 18 938 20 15,000 4.1 18 750
110 $370,000 100.0 99 $ 3,364
Competitive Position
Competitive Position
Segment 1 Attractiveness:
Accounts are very attractive because they offer high opportunity and sales organization has strong competitive position.
Selling Effort Strategy:
Accounts should receive a heavy investment of sales resources to take advantage of opportunity and maintain/improve competitive position.
Segment 2 Attractiveness:
Accounts are potentially attractive due to high opportunity, buy sales organization currently has weak competitive position.
Selling Effort Strategy:
Additional analysis should be performed to identify account where sales organization’s competitive position can be strengthened. These accounts should receive heavy investment of sales resources, while other accounts receive minimal investment.
Segment 3 Attractiveness:
Accounts are moderately attractive due to sales organization’s strong competitive position. However, future opportunity is limited.
Selling Effort Strategy:
Accounts should receive a sales resource investment sufficient to maintain current competitive position.
Segment 4 Attractiveness:
Accounts are very unattractive: they offer low opportunity and sales organization has weak competitive position.
Selling Effort Strategy:
Accounts should receive minimal investments of sales resources. Less costly forms of marketing (for example, telephone sales calls, direct mail) should replace personal selling efforts on a selective basis, or the account coverage should be eliminated entirely.
Strong
Weak
High
Competitive Positition
Competitive Positition
Segment 1
Attractiveness:
Accounts are very attractive because they offer
high opportunity and sales organization has
strong competitive position.
Selling Effort Strategy:
Accounts should receive a heavy investment of
sales resources to take advantage of opportunity
and maintain/improve competitive position.
Strong
Competitive Positition
Competitive Positition
Segment 2
Attractiveness:
Accounts are potentially attractive due to high
opportunity, buy sales organization currently has
weak competitive position.
Selling Effort Strategy
:
Additional analysis should be performed to identify
account where sales organization’s competitive position
can be strengthened. These accounts should receive
heavy investment of sales resources, while other
accounts receive minimal investment.
Weak
Competitive Positition
Competitive Positition
Segment 3
Attractiveness:
Accounts are moderately attractive due to sales
organization’s strong competitive position.
However, future opportunity is limited.
Selling Effort Strategy:
Accounts should receive a sales resource
investment sufficient to maintain current
competitive position.
Strong
Competitive Positition
Competitive Positition
Segment 4
Attractiveness:
Accounts are very unattractive: they offer low
opportunity and sales organization has weak
competitive position.
Selling Effort Strategy:
Accounts should receive minimal investments of sales
resources. Less costly forms of marketing (for
example, telephone sales calls, direct mail) should
replace personal selling efforts on a selective basis, or
the account coverage should be eliminated entirely.
Weak
PORTFOLIO ANALYSIS
You are concerned about your productivity and have decided to analyze your account allocation strategy. You sell outdoor sportswear to women’s retail clothing stores. The sportswear segment of women’s clothing has been growing rapidly though some retailers have been quicker than others to recognize and take advantage of the opportunity. You have ocmpiled the following account information from this past year:
Account Competition Sales
Account Opportunity Position Calls Sales Designer Depot High Strong 24 $60,000 Fashion Conspiracy High Strong 22 $57,000 Clothes Time High Weak 15 $29,500 Moda Fashion Low Weak 15 $20,000
Peachtree Low Weak 17 $21,000
Tomorrow Fashion High Weak 18 $36,000
Reprise Low Strong 24 $34,250
Plus Fashions Low Strong 22 $35,000 Casual Girls High Weak 10 $14,000 Another Season Low Strong 21 $37,000 Bandiera’s Low Weak 15 $20,000 Sports Locker High Strong 20 $53,000
Assume that these accounts are representative of all your accounts. Contruct a portfolio model and assess your effort allocation.
Where do time allocation problems seem to occur? Why might this happen?
PORTFOLIO ANALYSIS
Calls Sales DD 24 $ 60,000 FC 22 $ 57,000 SL 20 $ 53,000 Total 66 $170,000 Avg.: 22 $ 56,667
Calls Sales CT 2415 $ 29,500 TF 18 $ 36,000 CG 10 $ 14,000 Total 43 $ 79,500 Avg.: 14 $ 26,500
Calls Sales R 24 $ 34,250 PF 22 $ 35,000 AS 21 $ 37,000 Total 67 $106,250 Avg.: 22 $ 35,417
Calls Sales MF 15 $ 20,000 P 17 $ 21,000 B 15 $ 20,500 Total 47 $ 61,500 Avg.: 16 $ 20,500
Number of Sales Calls Response Function
Dollar
Sales per
Quarter
Number of
Sales Calls
Per Quarter
$20,000
$10,000
Territory Management
Key to Productivity
Prospecting Model -- Selling Priorities
FIRST
Close your “
Best Few
”
sales objectives
SECOND
Prospect for “
Unqualified
”
objectives
THIRD
Work the “
Qualified
” objectives
Territory Management
Key to Productivity
Territory Coverage
Judgmental Routing -- Basic Rules
° Route should be circular
° Route should never cross itself
° Same route should not be used to
go to and from a customer
Territory Management
Key to Productivity
Paths for Productivity Improvement
% Rating
Rank
Important*
1
New Technology
69%
2
Incentives for Strategic Accounts
69%
3
Incentives for Strategic Products
68%
4
Improve Motivation Programs
57%
5
Increase Incentives on Volume
56%
6
Use Alternative:Telemarketing
45%
Source:
Sales & Marketing Management
, Jan. 90, p. 41
Selecting a Partial Route using the Largest-Angle Method
y
x
Start
1
2
3
4
5
6
Selecting a Partial Route using the Largest-Angle Method
1
2
3
4
5
6
Step 2-3
Selecting a Partial Route using the Largest-Angle Method
1
2
3
4
5
6
Step 4
Selecting a Partial Route using the Largest-Angle Method
1
2
3
4
5
6
Selecting a Partial Route using the Largest-Angle Method
1
2
3
4
5
6
Step 6
You are a salesperson for a large consumer goods manufacturer. You call on a set
of retailers on a regular basis to ensure proper distribution of your products and to
sell merchandising ideas for moving more of your product lines. You are expected
to make 8 calls a day on the purchasing managers of your accounts. Normal
operating hours for these stores is from 10:00 a.m. to 6:00 p.m., though most
purchasing managers will arrive earlier and generally leave between 4:30 and 5:00
p.m. . Like most salespeople you work out of your own home. Below is the
geographic lay-out of the accounts you plan on seeing tomorrow. Design a sales
route for seeing these 8 accounts using the largest angle method.
A
C
E
B
G
D
H
G
Home
Largest Angle Method
Preliminary Route
A
B
C
E
G
F
H
D
Largest Angle Method
Final Solution
A
B
C
E
D
G
F
H
Alternative Solution
Travel Time Minimized
A
B
C
E
D
H
F
G
Territory Management
Key to Productivity
Salespeople’s Time Wasters
1. Telephone interruptions
2. Drop-in visitors
3. Lack of self-discipline
4. Crises
5. Meetings
6. Lack of objectives, priorities & deadlines
7. Indecision and Procrastination
8. Attempting too much at once
9. Leaving tasks unfinished
Territory Management
Key to Productivity
Sales Management Guidelines for
Involvement in Territory Management
1. Be aware of
your management style
which
with you and your salespeople are
most comfortable and productive
.
2. Consider
experience & maturity
of your
sales force in deciding management style
Territory Management
Key to Productivity
Sales Concentration
% Total Sales
0
20
40
60
80
100
Source: SMM, Jan. 90, p. 40
Top
Top
10%
Top
20%
Personal
Selling
Sample Prospect Profile - Characteristics
• Multiple-practice physician office
• Internal medicine, family practice
• Surburban location
• New practice -- less than 5 years
• Good credit history
Table 5-1
Computing the Cost per Call for an Industrial Products Salesperson
Compensation
Salary, commisions, and bonus $60,000
Fringe benefits (hospital, life insurance, social security) 9000 $69,000 Direct Selling Expenses
Automobile 7000
Lodging and meals 5250
Entertainment 2250
Communications 3500
Samples, promotional material 1750
Miscellaneous 1500 21,250
Total Direct Expenses $90,250
Calls Per Year
Total available days 260 days
Less:
Vacation 10 days
Holidays 10 days
Sickness 5 days
Meetings 18 days
Training 12 days 55 days
Net Selling Days 205 days
Average calls per day 3 calls
Total Calls per Year (205 X 3) 615 calls
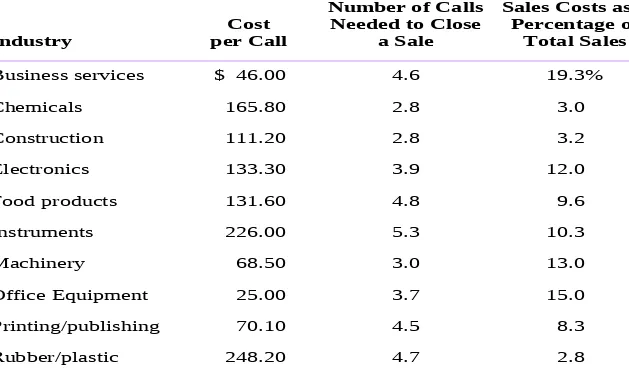
Table 5-2
Selected Statistics on Cost per Call and Number of Calls Needed to
Close a Sale
Industry
Cost per Call
Number of Calls Needed to Close
a Sale
Sales Costs as a Percentage of
Total Sales
Business services $ 46.00 4.6 19.3%
Chemicals 165.80 2.8 3.0
Construction 111.20 2.8 3.2
Electronics 133.30 3.9 12.0
Food products 131.60 4.8 9.6
Instruments 226.00 5.3 10.3
Machinery 68.50 3.0 13.0
Office Equipment 25.00 3.7 15.0
Printing/publishing 70.10 4.5 8.3
Rubber/plastic 248.20 4.7 2.8
Customer Break-even Analysis
A
C
B
1 2 3 4 5 6
$1,630 $3,261 $4,891 $6,522 $8,153 $9,784
Average Sales Volume
Per Month