M - 35
THE METHODS OF VERTEX DISCRIMINANT MULTICATEGORY
ANALYSIS WITH BOOTSTRAP APPLICATION
Warnida Lena1, I Made Sumertajaya, Bagus Sartono
Statistics Department FMIPA, Bogor Agricultural University, Indonesia E-mail1: [email protected]
Abstract
Underdeveloped district is the district that has less developed community and region compare with the other areas in the national scale base on economical category, society, human resources, infrastructure, financial capacity, accessibility, and regional characteristics. It is not easy in classification of underdeveloped district that involves many variables and the number of observations by multicategory cases. Sometimes the data used does not fill the double normal assumption and the group of variance-covariance matrix is not a homogeneous. Verteks Discriminant Analysis (VDA) is the method of the newest multicategories classification which can handle high-dimensional data. In this research, the significance testing of the function of vertex discriminant is done by using a bootstrap approach to determine the significantly variables. Through simultaneous confidence intervals of − , based on the results of analysis show that from the 27 predictor variables used, all significant variables have the real effect in determining the status of underdeveloped district. The accuracy of the classification that is obtained from the vertex discriminant function is about 94.44% for data training and 72.22% for data testing.
Keywords: underdeveloped district, VDA, bootstrap, simultaneous confidence interval
INTRODUCTION
Ministry of Rural Development (KPDT) states that the development of underdeveloped areas is a deliberate attempt by the government to change the area with various socio-economic problems and physical limitations into developed areas with the same quality of life or not far behind compared to other Indonesian regions. KPDT determines the status of regional lag based on six main criteria, namely economy, society, human resources, infrastructure, financial capacity, accessibility, and regional characteristics. Status of the lag will be used as the references of rural development.
Based on the guidelines of the Explanation of Determination of Underdeveloped Areas by KPDT, explained that technical calculation of underdeveloped area is done by multiplying the results of standardization data with the weights for each variable, then multiplicate ± 1 where the indicator to measure the level of ugliness become positive, then do the summation . The total is used as a benchmark of the determination of underdeveloped district status. However, the standardization process will generate positive and negative value. When doing the multiplication to ± 1, it will give the opportunity to produce the wrong conclusions.
The appropriate grouping of underdeveloped area based on the causing factor of its lag is a very important issue to support the strategies of the coping lag areas. For that, it takes the appropriate analytical methods to get more accurate and efficient results. The common classification method used in classifying an object is the discriminant analysis.
possible for the objects between groups (Rencher, 2002). There are several discriminant analysis which are currently developing include Fisher linear discriminant analysis (ADF), quadratic discriminant analysis, canonical discriminant analysis and the latest linear discriminant analysis namely vertex discriminant analysis (VDA). Nurmaleni (2014), conducts a study that compares two methods of linear discriminant ADF and ADV. In its application, the ADF can not be used for the classification when the X matrix is not full rank. It causes the singular variance-covariance matrix so that it has no inverse matrix. This condition will happen when many greater variables p rather than many observations n.
VDA is the latest multicategory classification method which is introduced by Lange and Wu (2008). VDA can classify the objects when X matrix is full rank and not full rank. The classification in VDA is done by minimizing the objective function that involves ∈ -insensitive loss and quadratic penalty.
Bootstrap is one of the estimation technique of confidential interval of population parameter that is able to cope the deviated data from its assumptions and the data which does not have the distribution assumptions (Efron and Tibshirani, 1993).
This research will examine how to determine the variables that have a real influence in the formation of discriminant function of VDA multicategory method for the full rank of matrix X by using bootstrap resampling approach through −Hot elling simultaneous confidential intervals.
RESEARCH METHOD Method and Material
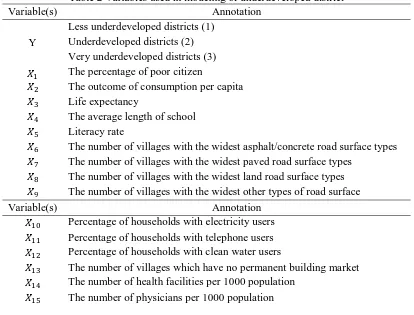
[image:2.595.91.505.449.764.2]The data used in this research were 162 data underdeveloped districts in Indonesia, which was obtained from the Ministry of Rural Development which sourced from the PODES collection In 2011 and 2014, SUSENAS in 2012, SUSENAS in 2013 and Financial Statistics of Regency/City in 2012-2013 (sourced from Central Bureau of Statistics). While the variables used in this study can be seen in Table 2.
Table 2 Variables used in modeling of underdeveloped district Variable(s) Annotation
Y
Less underdeveloped districts (1) Underdeveloped districts (2) Very underdeveloped districts (3) The percentage of poor citizen
The outcome of consumption per capita Life expectancy
The average length of school Literacy rate
The number of villages with the widest asphalt/concrete road surface types The number of villages with the widest paved road surface types
The number of villages with the widest land road surface types The number of villages with the widest other types of road surface Variable(s) Annotation
Percentage of households with electricity users Percentage of households with telephone users Percentage of households with clean water users
The number of villages which have no permanent building market The number of health facilities per 1000 population
The number of elementary and junior high schools per 1000 population Financial capacity
The average distance from the village office to the district office The distance from the village to the basic education services The number of villages with access to health services > 5 km Percentage of vulnerable villages of earthquakes
Percentage of vulnerable villages of landslides Percentage of vulnerable village of flood
Percentage of vulnerable village of other disaster Percentage of villages in protected areas
Critical land village
Percentage village of conflict in recent year
Some of the tools used in this study are R 3.0.3 with package VDA, Minitab 16 and MS Excel.
Methodology
The Formation of Verteks Discriminant Function The steps of the data analysis as follows:
1. Separating the district data into strata based on the status of underdevelopment;
2. Doing resampling bootstrap in each strata with n data collecting as much as available data on each strata, = , where = = 1,2, …, ;
3. Combining the data from collecting each strata;
4. Standardize all predictors to have mean 0 and variance 1;
5. The formation of VDA function with following stages: (Lange and Wu 2008) a. Deciding the initial of iteration m = 0w it h ( ) = 0and ( ) = 0; b. Determining the value of vertices from each group by the equation:
υj= (k)
-121 if j=1
c1+dej-1 if 2≤ j ≤k+1
c = −1 + √ + 1 ( )
and = + 1
and defines = ;
c. Majoring the loss function R(A,b)≤ 1
n∑ wi ri-si
2
+
λ
∑ aj2
k j= 1 n
i= 1 with ith current
residual ( ) = − ( )x − ( ) and case weights:
w
i=
⎩
⎪
⎪
⎨
⎪
⎪
⎧
1
2
‖
r
im
‖
,1
4(
ϵ
-
‖
r
im‖
)
,1
4(
‖
r
im‖
-
ϵ
)
,for
‖
r
im‖
≥
2
ϵ
for
‖
r
im‖
≤ϵ
for
ϵ≤
‖
r
im‖
≥
2
ϵ
=
0
r
im2
ϵ
‖
r
im
‖
-1 r
im
for
‖
r
im‖
≥
2
ϵ
for
‖
r
im
‖
≤ϵ
for
ϵ≤
‖
r
im
‖
≥
2
ϵ
d. Minimize the surrogate function by determining ( ) and ( ) that is obtained from solving k sets of linear equations;
e. If ( )− ( ) < and R( ( ), ( ))−R( ( ), ( )) < both hold
f. Otherwise repeat steps c through e.
6. Doing the step 2 to 5 by resampling bootstrap as = 1000(Davison and Hinkley, 1997). It will be obtained vertex discriminant function as follows:
Resampling bootstrap = 1000
. = . . + . . + . . + ⋯+ . . + . .
. = . . + . . + . . + ⋯+ . . + . .
⋮
. = . . + . . + . . + ⋯+ . . + . .
. = . . + . . + . . + ⋯+ . . + . .
. = . . + . . + . . + ⋯+ . . + . .
⋮
. = . . + . . + . . + ⋯+ . . + . .
. = . + . . + . . + ⋯+ . . + . .
. = . . + . . + . + ⋯+ . . + . .
⋮
. = . . + . . + . . + ⋯+ . . + . .
The Significance Test of Vertex Discriminant Function
The significance test of VDA discriminant function method is done by determining the
95%simultaneous confidence intervals ( − )for each discriminant coefficients (Johnson dan Wichern 2007).
− (( )) ; ; ; ≤ ≤ +
( )
( ) ; ; ; (1)
where i = 1, ..., p which all have confidence coefficient of 1-α. The simultaneous confidence intervals for the coefficients of variable discrimination which contain a value of zero indicate that the variables do not give the real effects in the vertex discriminant function.
New Object Classification
The classification of new objects in the VDA method is predicted by (Lange and Wu, 2010):
y = argminj=1,..,k+1 vj-Axi-b (2)
The Size of Error Classification in Discriminant Analysis
Apparent error rate (APER) is one of methods to evaluate the discriminant analysis in the classification. According to Johnson and Wichern (2002) APER value is many error percentages in grouping by the function of classification.
APER = t heamountofw rongobject sint he classi ication t heamountofobject s
RESULTS AND DISCUSSION
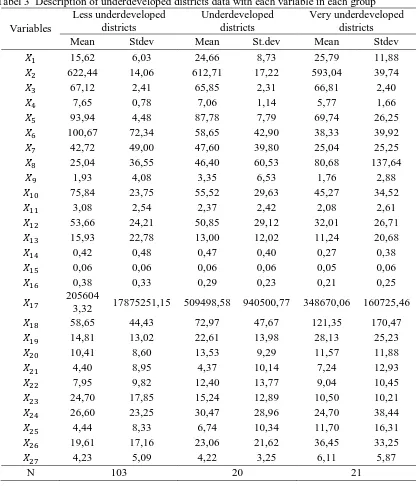
Tabel 3 Description of underdeveloped districts data with each variable in each group
Variables
Less underdeveloped districts
Underdeveloped districts
Very underdeveloped districts Mean Stdev Mean St.dev Mean Stdev 15,62 6,03 24,66 8,73 25,79 11,88 622,44 14,06 612,71 17,22 593,04 39,74 67,12 2,41 65,85 2,31 66,81 2,40
7,65 0,78 7,06 1,14 5,77 1,66 93,94 4,48 87,78 7,79 69,74 26,25 100,67 72,34 58,65 42,90 38,33 39,92 42,72 49,00 47,60 39,80 25,04 25,25 25,04 36,55 46,40 60,53 80,68 137,64
1,93 4,08 3,35 6,53 1,76 2,88 75,84 23,75 55,52 29,63 45,27 34,52
3,08 2,54 2,37 2,42 2,08 2,61 53,66 24,21 50,85 29,12 32,01 26,71 15,93 22,78 13,00 12,02 11,24 20,68 0,42 0,48 0,47 0,40 0,27 0,38 0,06 0,06 0,06 0,06 0,05 0,06 0,38 0,33 0,29 0,23 0,21 0,25 205604
3,32 17875251,15 509498,58 940500,77 348670,06 160725,46 58,65 44,43 72,97 47,67 121,35 170,47 14,81 13,02 22,61 13,98 28,13 25,23 10,41 8,60 13,53 9,29 11,57 11,88 4,40 8,95 4,37 10,14 7,24 12,93 7,95 9,82 12,40 13,77 9,04 10,45 24,70 17,85 15,24 12,89 10,50 10,21 26,60 23,25 30,47 28,96 24,70 38,44 4,44 8,33 6,74 10,34 11,70 16,31 19,61 17,16 23,06 21,62 36,45 33,25 4,23 5,09 4,22 3,25 6,11 5,87
N 103 20 21
Table 3 explains that the average percentage of the poor citizen
( )in the
group of less underdeveloped district status is about 15.6 with standard deviation of
6.03. Then, in the group of underdeveloped district status, the average percentage of the
poor is about 24.66 with standard deviation of 8.73. In the group of highly
underdeveloped district status, the average percentage of the poor is about 25.79 with
standard deviation of 11.88. The percentage indicator of the poor citizen
( )is an
indicator that measures the badness. It can be seen that the higher value of the average
percentage of the poor citizen
( )indicates the status of underdeveloped district is
getting worse.
It also shows that for the indicator of the expenditure of consumption per capita
standard deviation of 17.22 and in the group of highly underdeveloped district status is
about 593.04 with standard deviation of 39.74. The indicator of the expenditure of
consumption per capita
( )is an indicator that measures the goodness. The greater
average value of the indicator of the expenditure of consumption per capita
( )indicates the status of underdeveloped districts is getting better. And then, for the
indicator that measures the goodness, the higher value of indicator of district status
tends to be better and the higher value of indicator that measures the badness of district
status tends to be worse. Although it is not happened at all indicators.
In training data, districts with the status of less underdeveloped are 103 districts,
districts with the status of underdeveloped are 20 districts and districts with the status of
highly underdeveloped are 21 districts. In testing data, districts with the status of less
underdeveloped are 12 districts, districts with the status of underdeveloped are 3
districts and districts with the status of highly underdeveloped are 3 districts. Districts
with the status of less underdeveloped most nearly spread throughout the province in
Indonesia. While the district with the status of underdeveloped and highly
underdeveloped more spread in eastern Indonesia.
The Formation of Verteks Discriminant Function
By 1000 bootstrap replicates, VDA method forms each 1000 vertex function
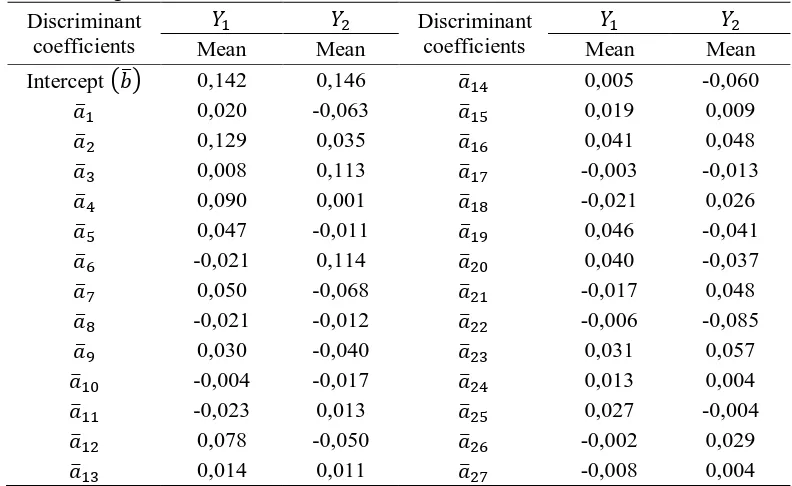
, and to distinguish four groups based on many objects of 144 districts, many groups of 5, and the large of lambda 0.006944. The average of discriminant coefficients for each variable in each vertex discriminant function can be seen in Table 4.
Table 4 Average of discriminant coefficient of each variable to vertex discriminant function Discriminant
coefficients
Discriminant coefficients
Mean Mean Mean Mean
Intercept 0,142 0,146 0,005 -0,060 0,020 -0,063 0,019 0,009 0,129 0,035 0,041 0,048 0,008 0,113 -0,003 -0,013 0,090 0,001 -0,021 0,026 0,047 -0,011 0,046 -0,041 -0,021 0,114 0,040 -0,037 0,050 -0,068 -0,017 0,048 -0,021 -0,012 -0,006 -0,085
0,030 -0,040 0,031 0,057 -0,004 -0,017 0,013 0,004 -0,023 0,013 0,027 -0,004
0,078 -0,050 -0,002 0,029 0,014 0,011 -0,008 0,004
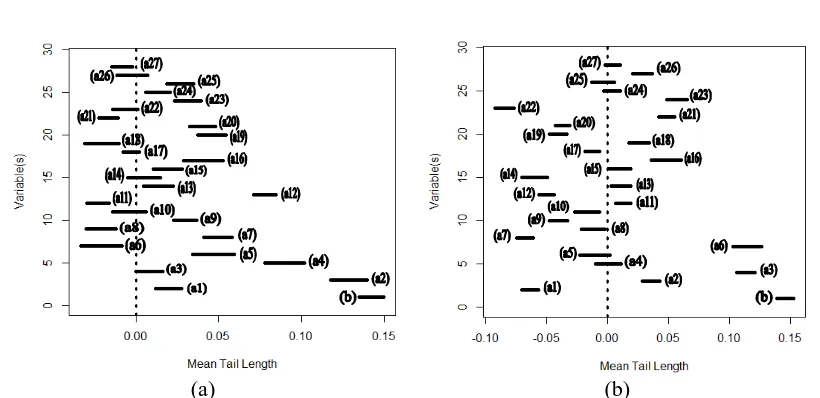
[image:6.595.98.494.400.643.2](a) (b)
Figure 1 (a) The simultaneous confidence interval for the discriminant coefficients of (b) The simultaneous confidence interval for the discriminant coefficients of
From Figure 1, it is seen that in the discriminant function of vertex the percentage indicator of household with electricity users ( ), the number of health facilities per 1000 population ( ), financial capacity ( ), the percentage of vulnerable villages of landslides
( ) and the percentage of critical land village ( ) are not significant. In the discriminant function of vertex the indicator of the average length of school ( ), the literacy rate ( ), the percentage of vulnerable village of other disaster ( ), the percentage of villages in protected areas ( ) and the percentage village of conflict in recent year ( ) are not significant. However, there is no a variable that is not significant at the third vertex functions simultaneously. Thus, it can be concluded that all variables give significant effect. In other words, all variables can be included in the formation of discriminant function.
Based on 27 variables obtained, the form of the first discriminant function ( 1) and the second discriminant function ( 2) as follows:
= 0,184 + 0,057 + 0,176 −0,011 + 0,096 + 0,05 + 0,0273 +
0,033 −0,055 + 0,047 −0,016 −0,025 + 0,115 + 0,037 −
0,059 + 0,059 + 0,034 −0,002 −0,051 + 0,07 + 0,055 −
0,033 −0,006 + 0,028 + 0,003 + 0,042 + 0,05 −0,003
= 0,108−0,086 + 0,019 + 0,126 −0,04 + 0,026 + 0,052 −
0,072 −0,011 −0,06 −0,019 + 0,022 −0,052 −0,004 −
0,035 −0,007 + 0,054 −0,013 + 0,02 −0,057 −0,034 +
0,064 −0,095 + 0,055 + 0,0001 + 0,025 + 0,031 + 0,011
[image:7.595.93.503.79.278.2]The goodness of VDA discriminant function method above can be seen from the classification of accuracy of each group as seen in Table 6.
Table 6 Goodness of VDA discriminant function method for 144 training data Model Classification
Group 1 2 3 Many Objects The Real
Classification
1 100 2 1 103
2 2 17 1 20
3 2 0 19 21
Many Objects 104 19 21 144
Based on Table 6, it can be seen that VDA discriminant function method is able to classify 136 objects (94,44%) accurately and many objects are misclassified about 8 objects (5,56%). Based on the attachments, it can be seen that the error classification of (value APER) VDA method about 0.055556. It shows that the accuracy of VDA Method in classifying recisely objects in the case of data training about 0.944444.
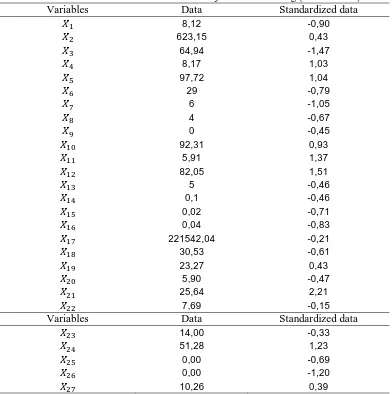
[image:8.595.103.495.363.757.2]Furthermore, the evaluation of VDA method was done by viewing the great error classification (APER value) by using 18 data testing. Such as for the first object of testing data is South Solok district with the initial classification is less underdeveloped districts. The value for each variable and the value of standardization can be seen in Table 7.
Table 7 Values of variables for the first object of data testing (South Solok) Variables Data Standardized data
8,12 -0,90
623,15 0,43
64,94 -1,47
8,17 1,03
97,72 1,04
29 -0,79
6 -1,05
4 -0,67
0 -0,45
92,31 0,93
5,91 1,37
82,05 1,51
5 -0,46
0,1 -0,46
0,02 -0,71
0,04 -0,83
221542,04 -0,21
30,53 -0,61
23,27 0,43
5,90 -0,47
25,64 2,21
7,69 -0,15
Variables Data Standardized data
14,00 -0,33
51,28 1,23
0,00 -0,69
0,00 -1,20
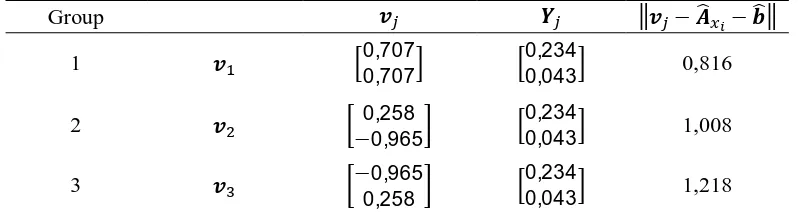
The value of each variable is substituted into 2 vertex discriminant function to obtain the value = 0,234, and = 0,043. Then calculated the shortest distance between the third value of vertex discriminant function toward the node to determine the assumption of classification of South Solok district. The value of the node to 3 groups and the distances between objects with the node can be seen in Table 8.
Table 8 The node and the distance between objects with the node
Group − −
1 0,707
0,707
0,234
0,043 0,816
2 0,258
−0,965
0,234
0,043 1,008
3 −0,965
0,258
0,234
0,043 1,218
Based on Table 8 by looking at the smallest distance between the object and the node, South Solok district is classified into group less underdeveloped districts where the assumption of classification is the same as the initial classification. The results of classification for 18 data testing can be seen in Table 9.
Table 9 The classification result of VDA discriminant function method for 18 data testing Model Classification
Group 1 2 3 Many Objects The real
classification
1 10 1 1 12
2 1 2 0 3
3 1 1 1 3
Many Objects 12 4 2 18
Table 8 describes that on data testing 13 objects (72,22%) appropriately classified to the third VDA discriminant function method and 5 objects (27,78%) misclassified. Thus, we can conclude that VDA discriminant function method is good method in distinguishing groups.
However, in the same way if the variables are not significant not included in the formation of vertex discriminant function, the goodness of classification result in training data is 86.11% and the goodness of classification in testing data is 72.22%. The goodness in classification on training data decreases when the variables are not significant eliminated. However, in testing data the goodness of classification is the same. It shows that although a variable is not significant in one vertex function, the variable still can be included in the formation of discriminant function because the vertex function of the variables is still significant.
CONCLUSION AND SUGGESTION
Based on the research result of the methods of vertex discriminant multicategory analysis with bootstrap application, it can be concluded as follows:
1. 27 variables or indicators used by the ministry in determining the status of underdeveloped district, provide the real influence in the formation of vertex discriminant function.
Suggestion for further research:
In this research, it is known that the VDA method has good ability in classification. VDA method can be applied in various fields. In the case of multivariate classification that involve many variables need to be done the significance test to reduce variables so that the resulting discriminant function more efficiently.
REFERENCE
Central Bureau of Statistics. (2013). Statistik Keuangan Kabupaten/Kota Tahun 2012-2013. Jakarta, Indonesia: Author.
Central Bureau of Statistics. (2011). Statistik Potensi Desa Provinsi 2011. Jakarta, Indonesia: Author.
Central Bureau of Statistics. (2014). Statistik Potensi Desa Provinsi 2014. Jakarta, Indonesia: Author.
Davison, A. C. And Hinkley, D. V. (1997). Bootstrap Methods and their Applications. Cambridge University Press.
Efron, B. And Tibshirani, R. J. (1993). An Introduction to the Bootstrap. New York: Chapman & Hall.
Johnson RA, Wichern DW. (2007). Applied Multivariate Statistical Analysis (6th ed). New Jersey (US): Pearson Prentice Hall.
Ministry of Rural Development. (2010). Rencana Strategis Tahun 2010-2014. Jakarta, Indonesia: Author.
Nurmaleni. (2015). Perbandingan Metode Klasifikasi antara Analisis Diskriminan verteks dan
Diskriminan Fisher. (Masters theses). Available from Bogor Agricultural University
repository.
Lange K, Wu TT. (2008). An MM Algoritm For Multicategory Vertex Discriminant Analysis. J
Comput Graph Stat. 17(3): 527-544.
Lange K, Wu TT. (2010). Multicategory Vertex Discriminant Analysis For High-Dimensional Data. The Annals of Applied Statistics. 4(4): 1698-1721.